ETH at the middle of the road.Let's keep this short. $1600 has to be broken then $2K. The first resistance will likely be broken but not the second one.
$900 is the buying target for the dip buyers.
ETHBULLUSDT trade ideas

Long trade
🔥 Trade Breakdown – Buyside (ETH/USD)
📅 Date: Friday, April 18, 2024
⏰ Time: 9:14 AM (NY Session AM)
Pair: ETH/USD
📈 Trade Direction: Buy (Long)
Trade Parameters:
Entry: 1599.77
Take Profit (TP): 1612.93 (+0.82%)
Stop Loss (SL): 1595.77 (–0.25%)
Risk-Reward Ratio (RR): 3.29
🧠 Trade Narrative:
Buyside intraday execution during the NY AM session sets the tone for directional bias based on liquidity sweep and continuation to the upside.

Long trade
15min TF overview
🚀 Trade Breakdown – Buyside (ETH/USD)
📅 Date: Friday, April 18, 2025
⏰ Time: 11:00 AM (NY Session AM)
Pair: ETH/USD
📊 Trade Direction: Buy (Long)
Trade Parameters:
Entry: 1578.20
Take Profit (TP): 1610.65 (+2.06%)
Stop Loss (SL): 1576.24 (–0.12%)
Risk-Reward Ratio (RR): 16.56
🧠 Trade Narrative: Observing recent price action and selling climax 11.00am Friday 18th April seem indicative of a buyside trade idea.

A Small Step into the Future's History (Maybe!)Might we soon experience events so monumental and dramatic that they leave a lasting mark on history?

Ethereum Vs "Lots Of People""Lots of people are saying Ethereum will go very low and..." They were right, Ethereum is already trading extremely low, same prices as in the March 2023 wick low and a bullish reversal is about to happen. The low is in and confirmed, it happened on the 7-April session. You shouldn't listen, believe or follow "lots of people." "Lots of people," doesn't have any substance, race, color, ideas, beliefs, shape or form. There is no such thing as "lots of people." There is only me, you and the chart.
This simple chart says it all, but the main signal comes from the smaller Altcoins and those pairs that are moving ahead. I am now seeing pairs breaking up producing 80% within a single candle in a few hours. Just two days ago the breakouts were maxed out at 40%, today it is going higher and its been only 48 hours.
Bullish momentum will continue to build up and grow. Bullish action will encompass the entire Cryptocurrency market in a matter of weeks. Full blown bullish action in late May 2025. But it is happening now but still early.
Let's forget my own personal bias and consider the chart signals.
Ethereum bottomed June 2022. Right now it is trading within a long-term higher low and support has been found at the same March 2023 level.
The March 2023 low was only a wick, the session close happened within a long-term sideways period between January and October 2023, the unbreakable, long-term support zone. Ethereum is now safely trading within this range. Since it took Ethereum 280 days to develop this support level, it won't break with a single candle and, the low in March 2023 was $1,369 while on the 7-April weekly session it ended at $1,384. Technically, this is a double-bottom but the small difference in price means that buyers were expecting this drop and were ready to buy.
A break of this support zone would need a challenge of this lower wick. The next week, this week which is still active, we have a very strong higher low and another Doji and reversal candle. The previous candle itself is a reversal signal as it came as a Doji and green. The trading volume reveals a bias towards the bullish side. The highest bearish volume already happened in February, revealing the fact that the bears ran out of strength already and all the ammunition they had—already spent.
November 2025 is the most likely date but a top can also happen in August or October 2025. If the general market pattern changes, the bull market can extended into 2026 but this is unlikely, normally, it always happen in exactly the same way.
We want to see the bull market extended, but it can extend for some pairs and not for others, the market is too big right now. Some pairs are trading really high up, like Bitcoin, Solana, Binance Coin and Tron, while other pairs are trading at All-Time Lows. Those at All-Time Lows can extend until 2026, those really high can end early, anything goes.
Generalizations won't be of help, but it can fun for reading. We can fill ourselves with hope but then, the market does whatever it wants. We take action based on resistance and support. Buy now, sell when prices are up.
Namaste.

ETH rejection from EMA zone — watching for shortPrice is currently near the 8 EMA and 20 EMA on the 1H chart. I'm watching for a weak bearish candle followed by a strong green rejection candle with volume. If it happens, I’ll enter a long based on my micro pullback strategy. Trend still looks bullish unless price breaks above. Let’s see how it reacts here.

ETH USDTCRYPTOCAP:ETH price remains extremely compressed, showing minimal movement for nearly 3 days. This type of consolidation often comes before a significant move — now it's just a matter of waiting for the breakout in either direction.

ETHUSDTFollowing the idea of a terminal diagonal triangle in wave C of the second downward zigzag (which itself doesn't look very clean), the current formation could represent an initial diagonal triangle, which is still missing two waves.
If this initial diagonal triangle structure is confirmed, then after its completion, we can expect a corrective move downwards with a leading impulse. It is precisely this leading impulse downwards that could provide an interesting opportunity to open a long position.

ETHUSDT LONG TRADE SETUPTechnical Analysis : ETH is facing strong resistance, with a high chance that the market will go down in the short term. Other indicators like 50 EMA are also showing similar signals.


Ethereum (ETH): Our Attentions Are At Bollinger Bands Now, as many of you remember, we are aiming to see the bullish CME (on upper zones) to be filled on ETH, but there is no proper volume from any side currently.
So with this kind of sideways movement, our attention is at Bollinger Bands upper and lower zones, which are going to be our micro target zones while we see a proper BOS from either buyers or sellers.
Also keeping eyes on the middle line of Bollinger Bands, as this can be our trend ladder to either lower zones or upper zones. So let's keep on monitoring until we get more clarity.
Swallow Academy

Long trade
🚀 Trade Breakdown – Buyside (ETH/USD)
📅 Date: Thursday, April 17, 2025
⏰ Time: 3:00 PM (NY Session PM)
🪙 Pair: ETH/USD
📊 Trade Direction: Buy (Long)
Trade Parameters:
Entry: 1582.90
Take Profit (TP): 1612.94 (+1.90%)
Stop Loss (SL): 1577.04 (–0.34%)
Risk-Reward Ratio (RR): 5.13
🧠 Trade Narrative:
NY PM reversal-style trade:
Playing off a refined demand zone on the lower timeframe, sweep of a prior low, and aiming for a local high for this buyside trade idea.
Not the best entry, however, manage stop loss based on the narrative of supply and demand

[ETH] 2025.04.18Symbol: Ethereum (ETH)
🔔 Follow SEOVEREIGN to receive alerts on our latest analyses.
🚀 Boosts help us bring you deeper insights across more assets!
📊 We regularly publish structured market reports and Elliott Wave-based analyses on the crypto market.
Hello and welcome—this is SEOVEREIGN.
We believe Ethereum is currently trading within a favorable accumulation zone.
📍 Key Technical Highlights
Primary Targets (TP1 & TP2) are based on Fibonacci retracement levels, specifically the 0.382 and 0.618 zones, which are clearly marked with orange lines on the chart.
From the Deep Crab harmonic pattern perspective:
A first attempt at trend reversal occurred at the 1.902 pivot, but failed to sustain.
The market is now attempting a second reversal from Point 2, a structurally more promising zone.
RSI bullish divergence has been confirmed, providing an additional signal of potential reversal momentum.
From an Elliott Wave standpoint:
The current price structure covers both the end of the C wave and a retest of the B wave high, forming a zone of dual technical relevance.
Statistically, C waves often measure 0.618x, 1x, or 1.618x the length of the preceding A wave.
In this case, the C wave equals 1.618 times the A wave—
a classic, high-probability reversal structure that supports confident entry into long positions.
We will continue to monitor developments and provide timely updates as the market evolves.
Wishing you all successful trades—
Thank you for reading.

ETH: NEW UPDATEHello friends
Given the price decline we had and the lower lows that the price made in a support area, you can see that buyers entered and broke the downtrend and made higher lows, which is expected to move the price to the specified targets.
*Trade safely with us*

ETHUSDTHey guys....
sharing ideas is fun for me... here is my ETHUSDT setup for you guys..Expecting a decent pump from this support zone to the resistance which is 1935.

ETHUSDT – Eyeing a Potential Rejection Near 1650 ResistanceEthereum is currently in a downtrend, and the recent upward move appears to be part of a correctional phase. Price is now approaching the descending trendline and a key resistance area around $1650, which previously acted as support.
This zone could serve as a potential rejection area, especially if the broader bearish structure holds.

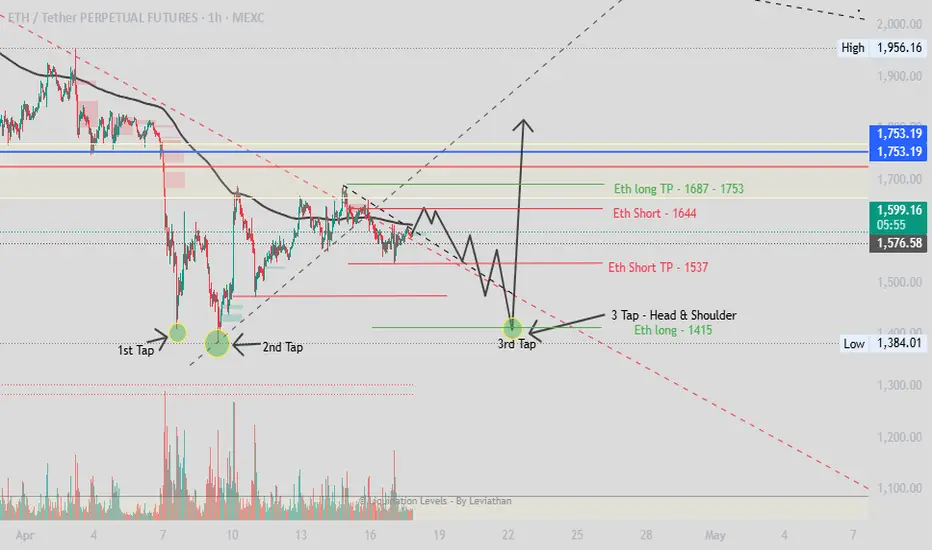
ETH - Short & Long Trades - All Upcoming Moves DefinedETH Short Trade:
After the break of ETH uptrend structure, topping at 1693 and making a local low at 1539, I would expect Eth to accumulate up to its supply zone at 1644 (Eth Short Entry Zone) before falling back down to 1537 (ETH Short TP Zone).
ETH Long Trade:
Looking at the previous lows, ETH has made two lows, 1st low at 1411, 2nd low at 1485, I would be expecting ETH to make another low at 1415 (ETH Long Entry) accomplishing the 3 Tap Pattern - Head & Shoulder. After this 3-Tap move is successfully completed, ETH should accumulate up to 1687 - 1753 (ETH Long TP Zone).
DeGRAM | ETHUSD Breakout of the Downward Triangle📊 Technical Analysis
- Bullish reversal
ETH/USDT has exited a falling triangle pattern, signaling a bullish reversal.
- Target zone
The next critical resistance zone is around $2 300.
- Predictive Scenario
Expect ETH to move steadily towards this target, confirming bullish sentiment.
💡 Fundamental analysis
Investor optimism is rising amid improving cryptocurrency regulatory clarity and growing institutional acceptance, reinforcing ETH's bullish potential.
✨ Summary
The technical breakout is consistent with favorable fundamentals. ETH is likely heading towards the $2 300 resistance zone - stay tuned for market updates!
-------------------
Share your opinion in the comments and support the idea with a like. Thanks for your support!

Ethereum fees drop to five-year lowEthereum network transaction costs have dropped to a five-year low due to reduced on-chain activity. Currently at $0.168 per transaction, the lower fees reflect fewer people sending ETH or interacting with smart contracts. When usage is high, users bid up fees to speed up confirmations, but the reverse happens when activity declines. While low fees might hinder a price rebound, traders seem to be waiting patiently for global economic uncertainties to pass before increasing their trading frequency in Ethereum and altcoins.

Ethereum (ETH): Closed Long in BE, Possible $1,400 IncomingWe closed our long on Ethereum in BE, where, due to a lot of uncertainty in the markets, we are going to look now for a decline in the markets, which should send the price to $1,400.
Although we still see the long scenario playing out, we are going to possibly next enter near $1,680, where, once we see buying volume build further from there, we will look for the fill of the CME gap, but as long as we are below those zones, we will be switching to a short position here.
Swallow Academy

ETH idea for longSo we have EQH, now we are in month bisi, have two patten
1. AMD, we are wait manipulation and break structure for long unicorn stetup
2. without manipulation this mean need search SMT with bct and wait 4h bisi
I hear Trump invest buy eth on 200m usd, this good point for long term position

DIRECTIONAL SHORT BIASsince its a daily configuration, I've decided to look for inner trends in the M5, notice there are 2 entries, its because there are 2 possible liquidity areas to be grabbed first and since theres a open H1 Demand block from prrvious swing, its more likely price is interested to go there. DO NOT ENTER YET

ETH swing Long IdeaI have in mind 2023 Lows, there is a weekly OB before it, so could provide some reaction, but ETH respects more high time frame S/R (support and resistance) so can provide a good trade for spot and perps
