ETH Analysis Update target ??
#Ethereum needs to close a daily candle above the orange zone at $2200 to confirm the continuation of the bullish trend. 📈
As long as the price remains below this level, caution is advised. A breakout and daily close above $2200 would likely trigger a strong upward movement.
ETHBULLUSDT trade ideas

Ethereum Rebounds from Key Confluence Zone$ETH/USDT Weekly Chart Analysis
Ethereum is holding a major long-term uptrend as the price bounces off the ascending trendline support. This level also aligns with a strong historical resistance-turned-support zone, adding more confluence to the current bounce.
As long as ETH stays above this structure, it suggests a potential macro bullish continuation, with eyes on the upper resistance line near $3,200–$3,500.
A strong defense at this zone reinforces long-term bullish sentiment.

BUY MARKET!!!Hello dears
If you are risk-averse, this analysis is for you...
Given the decline we had, you can see that the price was supported within the specified support range and a range was formed that can be purchased with risk and capital management and moved to the specified ranges...
*Trade safely with us*

Ethereum ETH Is Gaining Strength Agains BitcoinHello, Skyrexians!
BINANCE:ETHUSDT was a huge underdog last 4 month on the bearish phase, but recently it started to gain power, on the recent dump it has not showed correction.
On the daily chart we can see that price has printed 5 waves Elliott cycle. Wave 3 corresponds to the minimum Awesome oscillator. After that wave 5 has finished this cycle with divergence. The conservative bounce target is $3000 at 0.61 Fibonacci level, but we have one problem here. AO did not crossed zero line at wave 4, so we can be in wave 4 only now, in this case another one lower low will happen. We need to count sub waves every day. Wait for our updates.
Best regards,
Ivan Skyrexio
___________________________________________________________
Please, boost this article and subscribe our page if you like analysis!

Ethereum (ETH/USDT) – Bullish Momentum Building Toward targetHello guys...
Ethereum has broken out of its long-term descending channel and is currently trading inside a smaller ascending channel, showing strong bullish momentum. After a "fake breakout" below major support around $1,400, ETH quickly reclaimed higher levels, suggesting a bear trap.
Currently, ETH is approaching the critical resistance zone around $2,000. As long as the price stays inside this rising structure and continues making higher lows, the bias remains bullish toward a test of the major resistance.
✅ A clear breakout above $2,000 could trigger a stronger move up.
⚠️ However, if the structure breaks down, we should watch for potential pullbacks.
___________________________
Key Levels to Watch:
Support: $1,720–$1,750 zone
Resistance: $2,000–$2,050 zone

ETH ANALYSIS (12H)This analysis is an update of the analysis you see in the "Related publications" section
Ethereum has finally reached the flip zone.
Pay close attention: Ethereum dominance is sitting on monthly support, which is a level with strong bounce potential.
We have two possible scenarios for Ethereum | either it breaks through the flip zone, or it makes a correction and turns bullish again from around the bottom.
⚠️ What’s clear is that shorting Ethereum is risky and doesn’t make sense!
For risk management, please don't forget stop loss and capital management
When we reach the first target, save some profit and then change the stop to entry
Comment if you have any questions
Thank You

$ETHUSDT - Major Breakout Alert! CRYPTOCAP:ETH has officially broken out of a long-standing descending parallel channel on the daily chart — a key structural shift in market sentiment. This breakout is further supported by a successful close above the 50 EMA, which had acted as dynamic resistance throughout the downtrend.
Key Technical Developments:
- Broke out of a descending parallel channel
- Closed above 50 EMA for the first time in weeks
- Strong daily candle with 8% gain confirms momentum shift
Immediate Support: $1,790 (former resistance zone turned support)
Next Major Resistance: $2,393
This is the mid-zone before ETH challenges the broader supply area around $2,550–2,850.
This breakout mirrors Ethereum's typical behavior during previous cycle expansions — grinding accumulation followed by aggressive breakout moves. The confluence of the EMA breakout and channel structure suggests we could be looking at the beginning of a broader trend reversal.
Trading Plan:
Retests towards $1,850–$1,790 can offer high R:R entries.
Watch for continuation patterns or consolidation above $2,000 for the next push.
CRYPTOCAP:ETH is reclaiming momentum — if BTC remains stable, this move could expand quickly.
If you find this analysis helpful, please hit the like button to support my content! Share your thoughts in the comments, and feel free to request any specific chart analysis you’d like to see.

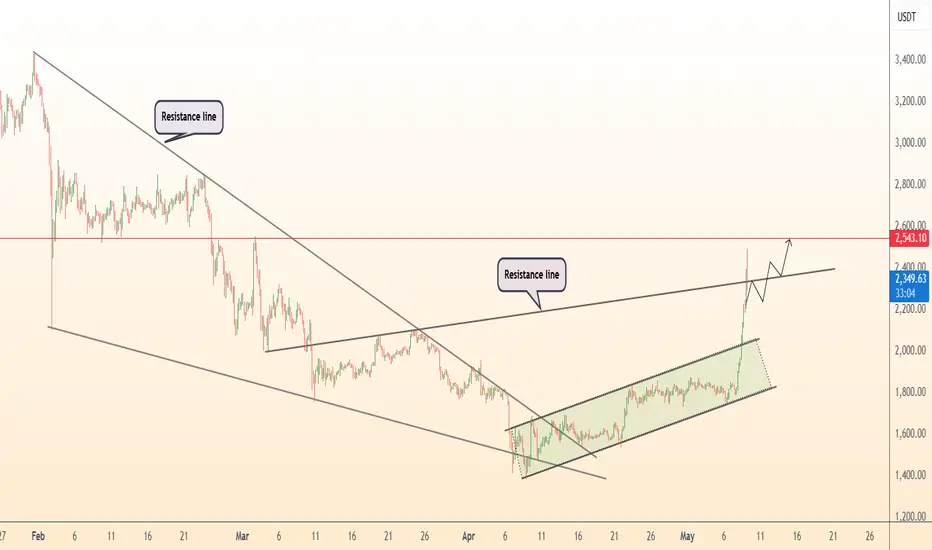
#ETH Breakout is incoming!$ETH/USDT – Breakout Watch
Ethereum is currently retesting a key descending resistance line after an extended period of consolidation. The structure suggests growing bullish momentum.
🟢 A successful breakout and daily close above the $1,900–$2,000 zone could trigger a move toward $2,200–$2,400 in the coming sessions.
Watch for confirmation with volume expansion and retest behavior. Rejection at this level could delay the move, but the pressure is clearly building.
Key Levels:
Resistance: $1,900–$2,000
Target: $2,200–$2,400
Support: $1,800
Chart looks clean breakout potential is real.
DYOR NAF
BINANCE:ETHUSDT BITSTAMP:ETHUSD

Ethereum rising as we expectedEthereum rising as we expected
new long in a case of Big OI rise
Sell better to take at key zone in a case of bullish absorption

ETH Short (Short term)ETH has just completed manipulation on weekly time frame which just closed earlier (2 hours ago from writing). Expecting down move to 50% of the weekly range ($1695) before continuing it's overall bullish trend to higher prices.
Able to position a short from $1818 to $1720 (range low).
$1816 is the opening of the 4 hour fair value gap.
Reference to ICT peoples 1W-> 4H.
Will write another idea on the overall long position.

ETH/USDT – Weekly Chart AnalysisETH/USDT Unique Technical Structure: Large Accumulation + Recovery Setup
This chart shows Ethereum’s price action over the past few years, highlighting key support and resistance areas. A strong visual signal (blue arrow) indicates bullish potential.
Chart Pattern Implications:
The pattern on this chart is not a classical shape (e.g., cup and handle), but it does show a Wyckoff-style accumulation phase followed by a failed breakout and reaccumulation:
Strong base formed between $1,000-$1,400
A series of lower highs and a range-bound structure after the 2022 peak
The bullish projection illustrated by the arrows shows a potential recovery towards the ATH again
This setup suggests that Ethereum is at a critical juncture – either:
It retests current support and begins a new uptrend.
Or it risks another test of the $1,400-$1,050 range before a breakout.
Risk-Reward: Current levels ($1,796) offer attractive long-term entries if you’re bullish.
Caution Zone: If ETH breaks below $1,400 with volume, $1,050 becomes the next key defense.
If you found this analysis helpful, hit the Like button and share your thoughts or questions in the comments below. Your feedback matters!
Thanks for your support!
DYOR. NFA

ETH: A Perfect Rebound!ETH Update:
As analyzed in our previous update, ETH has shown a promising rebound from support. It made an impressive move from $1,400 to the current market price of $2,000, marking an outstanding 45% rally.
With the RSI gradually gaining bullish momentum, ETH looks strong and could potentially rally back to the $3,000–$3,500 range.
Regards,
Dexter

Lingrid | ETHUSDT Trend Continuation Pattern. Potential LongBINANCE:ETHUSDT is consolidating inside an upward channel, holding just above the 1,757 support and the upward trend-line. After reaching a higher high near the channel top, price pulled back but remains within structure. If the trend-line holds, a rebound toward the 1,990 resistance looks likely. The bullish setup remains valid while price trades above the trend-line.
📈 Key Levels
Buy zone: 1,750 – 1,760
Buy trigger: bounce from trend-line
Target: 1,990
Sell trigger: break below 1,750
💡 Risks
If ETH loses trend-line support, momentum could flip to bearish.
Volatility from BTC or macro events may trigger false moves.
Watch for breakout above consolidation highs for early confirmation.
Traders, if you liked this idea or if you have your own opinion about it, write in the comments. I will be glad 👩💻

Ethereum (ETH): Reached Sideways Channel's Resistance LineEthereum is back at the resistance zone where sellers failed to show a proper breakdown, which would have triggered our sell entry yesterday.
Now that we've reached the resistance zone, this is the area we are looking for rejection now, which would give us similar movement to what we had each time we reached the resistance zone. As always, wait for MSB on smaller timeframes and once we see it short position can be taken!
Swallow Academy

Breakout trading point: 1861.57
Hello, traders.
If you "Follow", you can always get new information quickly.
Please click "Boost" as well.
Have a nice day today.
-------------------------------------
(ETHUSDT 1D chart)
The 1861.57 point is the HA-Low indicator point on the 1W chart.
The key is whether it can receive support and rise around the A section, that is, 1861.57.
Since the HA-Low indicator on the 1D chart is formed at the 1647.06 point, it is important whether it can receive support and rise in the 1647.06-1861.57 section.
If it shows support in the 1647.06-1861.57 section, it is a time to buy.
-
If it falls from 1647.06, there is a possibility that a stepwise downtrend will continue, so you should also consider a response plan for this.
In the case of a decline, the Fibonacci ratio section of 0 (1190.57) ~ 0.786 (1259.39) is expected to be an important support and resistance section.
-
Since the price is located below the M-Signal indicator on the 1M chart, it is recommended to conduct trading from a day trading or short-term trading perspective.
When it breaks through the 1861.57 point, a breakout trade is possible, but as I mentioned earlier, trading requires a short and quick response.
-
If the StochRSI indicator is above the midpoint, it is recommended to focus on finding a time to sell, and if it is below the midpoint, it is recommended to focus on finding a time to buy.
When creating a trading strategy by referring to the movement of these auxiliary indicators, you must check whether there is support at the support and resistance points drawn on the 1M, 1W, and 1D charts.
-
Thank you for reading to the end.
I hope you have a successful trade.
--------------------------------------------------
- Here is an explanation of the big picture.
I used TradingView's INDEX chart to check the entire range of BTC.
I rewrote the previous chart to update it while touching the Fibonacci ratio range of 1.902 (101875.70) ~ 2 (106275.10).
(Previous BTCUSD 12M chart)
Looking at the big picture, it seems to have been maintaining an upward trend following a pattern since 2015.
In other words, it is a pattern that maintains a 3-year bull market and faces a 1-year bear market.
Accordingly, the upward trend is expected to continue until 2025.
-
(Current BTCUSD 12M chart)
Based on the currently written Fibonacci ratio, it is displayed up to 3.618 (178910.15).
It is expected that it will not fall again below the Fibonacci ratio of 0.618 (44234.54).
(BTCUSDT 12M chart)
Based on the BTCUSDT chart, I think it is around 42283.58.
-
I will explain it again with the BTCUSD chart.
The Fibonacci ratio ranges marked in the green boxes, 1.902 (101875.70) ~ 2 (106275.10) and 3 (151166.97) ~ 3.14 (157451.83), are expected to be important support and resistance ranges.
In other words, it seems likely that they will act as volume profile ranges.
Therefore, in order to break through these ranges upward, I think the point to watch is whether they can receive support and rise near the Fibonacci ratios of 1.618 (89126.41) and 2.618 (134018.28).
Therefore, the maximum rising range in 2025 is expected to be the 3 (151166.97) ~ 3.14 (157451.83) range.
In order to do that, we need to see if it is supported and rises near 2.618 (134018.28).
If it falls after the bull market in 2025, we don't know how far it will fall, but based on the previous decline, we expect it to fall by about -60% to -70%.
Therefore, if it starts to fall near the Fibonacci ratio 3.14 (157451.83), it seems likely that it will fall to around Fibonacci 0.618 (44234.54).
I will explain more details when the bear market starts.
------------------------------------------------------

Ethereum (ETH): Waiting For Dominance By Buyers At $1,900Ethereum has formed a proper foundation from where we might see a good upward movement coming pretty soon; all we need is just to secure the $1,900, which then might send the price towards our target zones.
There is nothing much to talk about rather than waiting for the resistance zone and once we see that buyers will overtake that zone we are going to look for long positions here!
Swallow Academy

DeGRAM | ETHUSD the best score among the tops📊 Technical Analysis
● ETH blasted above the long‑term resistance line of the descending wedge, flipping it to support and signalling trend reversal.
● Price is riding a new rising channel; holding the mid‑channel support level (~$2 300) sets sights on the marked resistance level at $2 540 – 2 600.
✨ Summary
Wedge breakout + renewed ETF optimism favour a short‑term long: objectives $2 540 → $2 600+; strategy invalidated on a sustained drop below $2 200.
-------------------
Share your opinion in the comments and support the idea with like. Thanks for your support!
Has the alt season started?After hitting the $2200 area with a strong candle, corrections are worth buying.
These purchases could be the best or last chance to buy for those who missed out on the market.
Good days will begin with a little patience.

ETH/USD: Struggling at $1,850 – What Traders Should Watch NextQuick Overview:
Ethereum has repeatedly tested the $1,850 zone over the past week but has failed to gain traction. Key technical levels are stacking up to form a robust resistance barrier, and without fresh volume, any breakout attempt will likely fizzle.
Key Highlights:
Confluent Resistance at $1,850: VWAP-based resistance, the 0.618 Fibonacci retracement of the recent swing, a daily supply zone, and the Point of Control all converge here.
Volume Drying Up: Each rally attempt has suffered from below-average volume, indicating a lack of buyer conviction.
Channel Context: ETH remains capped by the upper boundary of its multi-month rising channel, reinforcing the bearish case until broken.
Full Analysis:
Ethereum’s recent price action shows a classic “climbing a wall” pattern: each push toward $1,850 stalls and retreats. This level is not arbitrary—it sits at the intersection of several major technical indicators. The VWAP (Volume-Weighted Average Price) has flipped to resistance after acting as support earlier in the rally, signaling that the average trader is now underwater at these prices. The 0.618 Fib retracement from the last major low to high adds a psychological layer, as many algorithmic strategies key off this golden ratio. Finally, the Point of Control from the current volume profile highlights $1,850 as the price where most trading volume occurred, making it a natural supply zone.
Rallies into this region have been met with tepid volume, suggesting that bulls are unwilling to commit at higher prices without a clear catalyst. On lower timeframes, candlesticks near $1,850 display long upper wicks and declining body sizes—classic signs of exhaustion. Meanwhile, the broader up-channel that’s governed ETH since late 2024 remains intact, capping upside and defining the trading range.
Bias & Trade Considerations:
Bearish Lean: Until ETH can close and hold above $1,850 on strong volume, the path of least resistance remains down.
Short Entry Zone: Consider entering short positions into $1,850–$1,860, with a stop overhead of the channel line. Initial targets near the range mid ($1,700) and the 200-day MA around $1,650.
Invalidation Criteria: A decisive daily close above $1,850 with above-average volume would invalidate the bearish thesis and open targets toward $1,950–$2,000.
What to Watch Next:
Volume Spikes: A volume surge above the 20-day average during an upside move would signal renewed buying power.
Channel Break: A clear break of the channel’s upper trendline on the daily chart is required to shift the bias bullish.
Support Levels: If $1,850 holds as resistance, monitor $1,800 and $1,750 for potential bounce areas.

$ETH Support + weeklyCRYPTOCAP:ETH is bouncing off a key trendline support + weekly demand zone
A strong reclaim above $2,350 green zone could trigger a clean move toward $4,800 resistance
Watch for retests and bullish structure forming 🧠

Long trade
1hr TF overview
🗓 Date: Saturday, 3rd May 2025
⏰ Time: 9:00 AM
📍 Session: London to New York Overlap (AM)
🪙 Pair: ETH/USDT
📈 Direction: Long (Buy Side)
🔹 Entry Details:
Entry Price: 1830.68
Take Profit: 1838.70 (+0.44%)
Stop Loss: 1830.28 (−0.02%)
Risk-Reward Ratio: 20.05
🔹 Trade Context:
Entered during the London–New York session crossover, a time known for high volatility and volume.

Support and Resistance Zone: 2273.58-2359.35
Hello, traders.
If you "Follow", you can always get new information quickly.
Please click "Boost" as well.
Have a nice day today.
-------------------------------------
(ETHUSDT 1M chart)
In order to turn upward on the 1M chart, the price must rise to the Fibonacci ratio range of 0.382 (2674.80) ~ 0.382 (2723.46) and maintain it.
Before that, the key is whether it can rise above the M-Signal indicator on the 1M chart.
-
(1W chart)
The key is whether the price can be maintained and rise above the M-Signal indicator of the 1W chart.
To do so, we need to check whether the price is maintained by rising near the right Fibonacci ratio 0.5 (2295.84).
In order to continue the uptrend in the medium to long term, the price must be maintained above the M-Signal indicator of the 1M chart.
Accordingly, the key is whether the price can rise above the M-Signal indicator of the 1M chart when the price is maintained by rising near the right Fibonacci ratio 0.5 (2295.84).
Therefore, it is expected that a breakout trade will be possible when the right Fibonacci ratio 0.5 (2295.84) is broken upward.
However, since the StochRSI indicator is showing signs of entering the overbought zone, the increase may be limited.
-
(1D chart)
It showed a big rise as it broke through the A section, that is, the 1861.57 point.
In any case, since it is currently below the M-Signal indicator of the 1M chart, we can see that there is still time to buy.
Therefore, as I mentioned earlier, we should focus on finding a buying point when the price rises above the M-Signal indicator of the 1M chart and maintains the price, or when it rises to the Fibonacci ratio range of 0.382 (2674.80) ~ 0.382 (2723.46) and maintains the price.
ETH is in a typical reverse arrangement (M-Signal of the 1M chart > M-Signal of the 1W chart > M-Signal of the 1D chart).
Therefore, we should focus on finding a buying point while watching the situation with a relaxed mind.
If it continues to rise like this,
1st: 2273.58-2359.35
2nd: 2627.18
3rd: 2921.73
We need to check if it can rise with support near the 1st-3rd above.
If not, if it falls, we need to check if it can support near 1861.57.
-
Thank you for reading to the end.
I hope you have a successful trade.
--------------------------------------------------
- This is an explanation of the big picture.
I used TradingView's INDEX chart to check the entire range of BTC.
I rewrote it to update the previous chart while touching the Fibonacci ratio range of 1.902(101875.70) ~ 2(106275.10).
(Previous BTCUSD 12M chart)
Looking at the big picture, it seems to have been following a pattern since 2015.
In other words, it is a pattern that maintains a 3-year bull market and faces a 1-year bear market.
Accordingly, the bull market is expected to continue until 2025.
-
(Current BTCUSD 12M chart)
Based on the currently written Fibonacci ratio, it is displayed up to 3.618 (178910.15).
It is expected that it will not fall again below the Fibonacci ratio of 0.618 (44234.54).
(BTCUSDT 12M chart)
I think it is around 42283.58 when looking at the BTCUSDT chart.
-
I will explain it again with the BTCUSD chart.
The Fibonacci ratio ranges marked in the light green boxes, 1.902 (101875.70) ~ 2 (106275.10) and 3 (151166.97) ~ 3.14 (157451.83), are expected to be important support and resistance ranges.
In other words, it seems likely to act as a volume profile range.
Therefore, in order to break through this section upward, I think the point to watch is whether it can rise with support near the Fibonacci ratios of 1.618 (89126.41) and 2.618 (134018.28).
Therefore, the maximum rising section in 2025 is expected to be the 3 (151166.97) ~ 3.14 (157451.83) section.
To do that, we need to look at whether it can rise with support near 2.618 (134018.28).
If it falls after the bull market in 2025, we don't know how far it will fall, but considering the previous decline, we expect it to fall by about -60% to -70%.
So, if the decline starts near the Fibonacci ratio 3.14 (157451.83), it seems likely that it will fall to around Fibonacci 0.618 (44234.54).
I will explain more details when the downtrend starts.
------------------------------------------------------

ethusdt
After testing $1680 in Ethereum, targets of 1960-2100 and 2260 are expected in order. If a daily close occurs below $1600, a stop may be required.
