ETHBULLUSDT trade ideas

Right now is the best time to be accumulating $ETH.Repeating Market Cycles (ChartPrime Indicator):
The ChartPrime oscillator shows a recurring pattern of market lows around the green-marked dates:
June 13, 2022 (Bear market bottom)
September 11, 2023 (Temporary low)
August 19, 2024 (Another correction)
March 24, 2025 (Potential bottom forming)
If this pattern holds, ETH could be near a cycle low, signaling a potential reversal soon.
Indicators Confirm Oversold Conditions:
The oscillator is near the lower green zone, historically aligning with market bottoms.
Past similar signals led to strong recoveries after a consolidation phase.

ETH - TUG OF WAR! WILL IT REACH $2300?PLLLLLEAAASEE new structure for the market as cited below! Observe and take stances! For nerds , Look at this
Ethereum has experienced a significant breakdown from its previously established value area between $2,060 and $2,100, as seen clearly in the 4H Volume Profile. The price sharply rejected the upper range and fell through low-volume nodes with little resistance, indicating aggressive selling and a clear lack of buyer support at higher levels. Currently, ETH is trading near $1,890, where the new Point of Control (POC) has formed, suggesting that the market is starting to accept this lower price region. However, the volume at these lower levels is still relatively thin, which means that the structure is not yet fully balanced, and volatility may continue. If ETH fails to reclaim the $1,920–$1,950 zone, we could see continued downside movement toward $1,850 or even $1,800, where a new high-volume base might establish. On the other hand, if bulls manage to push the price back above the recent breakdown point and sustain it, there could be a short-term recovery attempt.

Ethereum (ETH): Strong Rejection From Re-Test ZoneWe are seeing strong rejection from the local re-test zone, where we are aiming now to see a further drop until the $1,820, where we expect to see some kind of support to form.
Once we see the support zone form there, we will be looking for upward movement, but for now let's bleed a little bit more.
Swallow Team
Ethereum targetting 1,912$ or 1,776$I see here 2 possibilities.
First look at the uptrend break and retested. Therefore, it may drop to a lower Fibonacci level which is 1,912$
The other option is the triple top formation target which is around 1,776$
* What i share here is not an investment advice. Please do your own research before investing in any asset.
* Never take my personal opinions as investment advice, you may lose all your money.

ETH Rising Wedge: Are We Headed for a Bearish BreakdownHey traders! 👋
We’re seeing a rising wedge pattern on ETH, which is generally considered a bearish setup. 📉 We’ve also had a solid touch at the Fib 0.382, which is acting as strong resistance right now.
With that in mind, we’re opening a market order and targeting the daily FVG (Fair Value Gap) for the next move down. What’s even more interesting is that our eclipse indicator is showing bearish signals across all timeframes, adding even more weight to the trade. 🛑
We’re going for it—how about you? Let’s see how this plays out! 💪
Note: This is not financial advice. Always do your own research before making any trading decisions!

Last Chance To Buy Eth That LowI Am Warning You This Is The Last Chance To Buy Eth That Low
TP1 4000
TP2 7000
TP3 10000


ETH - A New look at ETH ?Is some "3 Fan Principle" happening to ETH?
Higher Time Frame look:
Follow for more ideas/Signals. 💲
Look at my other ideas 😉
Just donate some of your profit to Animal rights and rescue or other charity :)✌️

ETH-----Sell near 2010, target 1920 areaTechnical analysis of ETH contract on March 27: Today, the large-cycle daily level closed with a small negative line yesterday, the K-line pattern was a continuous positive single negative, the price was still at a low level, the attached indicator was a golden cross with a shrinking volume, and the general trend was still obviously downward. The current pullback trend is to prepare for the next big drop; the technical trend of the four-hour chart has touched the high point of 2110 twice in a month, which is quite obvious. The current K-line pattern is a continuous negative, and the attached indicator is a dead cross, so there is a high probability that there will be a continued retracement trend; the short-cycle hourly chart fell in the European session yesterday and the US session continued to break the low, and the high point of the correction was near the 2025 area. Similarly, today we need to see a continued decline, and the pullback cannot break the high point of the correction.
Today's ETH short-term contract trading strategy: sell at the current price in the 2010 area, stop loss in the 2040 area, and target the 1920 area;

ETH - As long as the $1,950 holds...Hello TradingView Family / Fellow Traders. This is Richard, also known as theSignalyst.
📈After breaking above the $2,000 level, ETH has been overall bullish trading within the rising orange channel.
Moreover, it is retesting as strong support zone, so we will be looking for longs as long as the $1,950 level holds.
🏹 Thus, the highlighted blue circle is a strong area to look for buy setups as it is the intersection of support and lower orange trendline acting as a non-horizontal support.
📚 As per my trading style:
As #ETH approaches the blue arrow zone, I will be looking for bullish reversal setups (like a double bottom pattern, trendline break , and so on...)
📚 Always follow your trading plan regarding entry, risk management, and trade management.
Good luck!
All Strategies Are Good; If Managed Properly!
~Rich

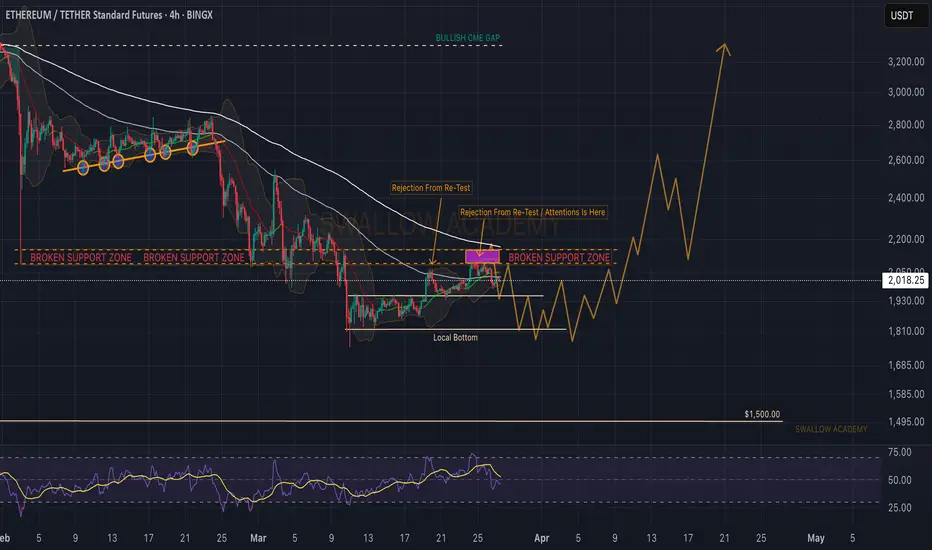
Ethereum (ETH): Successful Re-Test, Sellers Taking Over The ZoneEthereum is seeing a good rejection where buyers failed to break from the local resistance zone. We are currently looking for the price to fall more, where at one point we should see an order of buys to form a strong wall of support.
Once we see any signs of reversal, we will be looking for a buying entry.
Swallow Team
Is ETH going to retest local bottom at 2k?What do you think guys? Up or down? It would be nice to take out the low and the then to the moon.

Etherem impulse trade - coming soon BULLISHI think Ethereum is now really underrated and will make big move in the next weeks! Check this out.

ETH on the verge of falling to 1800ETHUSDT Still on the verge of falling lower creating a bearish flag

ETHUSDT DIVERGENCE Hi
This is a technical analysis chart of Ethereum (ETH/USDT) on a 1-month timeframe. Here’s a breakdown of what’s happening in the chart:
1. Triangle Pattern (Yellow Lines)
The price is forming a symmetrical triangle, with resistance around $4,000 and support near $1,500-$2,000.
A breakout above the upper trendline could signal a bullish move.
A breakdown below support may indicate further downside.
2. Divergences & Indicators
RSI (Relative Strength Index): Shows a potential bullish divergence (price making higher lows while RSI makes lower lows).
MACD (Moving Average Convergence Divergence): Indicates weakening bearish momentum, possibly setting up for a bullish reversal.
3. Possible Scenarios (Yellow Arrow & Question Marks)
The yellow arrow suggests a possible breakout toward the $4,000 level.
The question marks indicate uncertainty—whether ETH will break upwards or get rejected at resistance.
Conclusion
ETH is at a critical decision point.
If it breaks above the triangle resistance, it could rally toward new highs.
If it fails and gets rejected, it may test lower support levels.

ETH/USDT : BUY LIMITHello friends
Given the price growth, now that the price is correcting, you can buy in steps and be careful to ensure that capital management is followed.
*Trade safely with us*

ETH Chart - SECRET in the INVERTETH is losing ground quickly after a nasty bearish pattern formed in the weekly.
The bearish M-pattern we're currently observing in the macro timeframe:
We know this is a bearish patter, not only because we've seen it many times before but also because it is the opposite of the W-Bottom. (we can actually confirm this by flipping the chart):
In this case, the bullish confirmation would have been a support retest of the neckline:
And so, if we flip it again back to the original view - the opposite can be true. As we get rejected on the resistance line, an even lower price is likely:
____________________
BINANCE:ETHUSDT

ETH – do we dare?ltf looks constructive, but honestly it depends a lot on what BTC does here going forward, like most alts.
Problem is that we are sitting right below previous year-long range low (orange line), longing here makes no sense to me.
We can look for a ltf entry though, run the lows at 2035, tag the small imbalance we left there. If we manage to keep the uptrend intact, a reclaim could give us an entry where we can take first partials on the htf s/r and at 2200 imbalance fill. Then leave a runner for if we fill the entire imbalances towards 2500.


Bullish projection, 4H chart, Futures.On the 4H chart I am preparing to open long positions, the most optimal area to enter the operation $2,040 to $2,030 dollars

Ethereum ETH Will Crash After Small PumpHello, Skyrexians!
Recently we have already told that potentially BINANCE:ETHUSDT has been finished the correction and is ready to reach $7-10k, but today we recalculated waves and can tell that one more leg down will happen with the high probability.
Let's take a look at the daily chart. Minimum Awesome Oscillator wave tells us that recent dump was only wave 3. Now asset is in wave 4. When AO crosses zero line it means that the min requirement for the wave 4 has been complete. At this point price shall reach the target area at 0.38-0.5 Fibonacci approximately at $2600. There we have to be very careful and if will see the bearish divergent bar the wave 5 will come. The target is $1600.
Best regards,
Skyrexio Team
___________________________________________________________
Please, boost this article and subscribe our page if you like analysis!

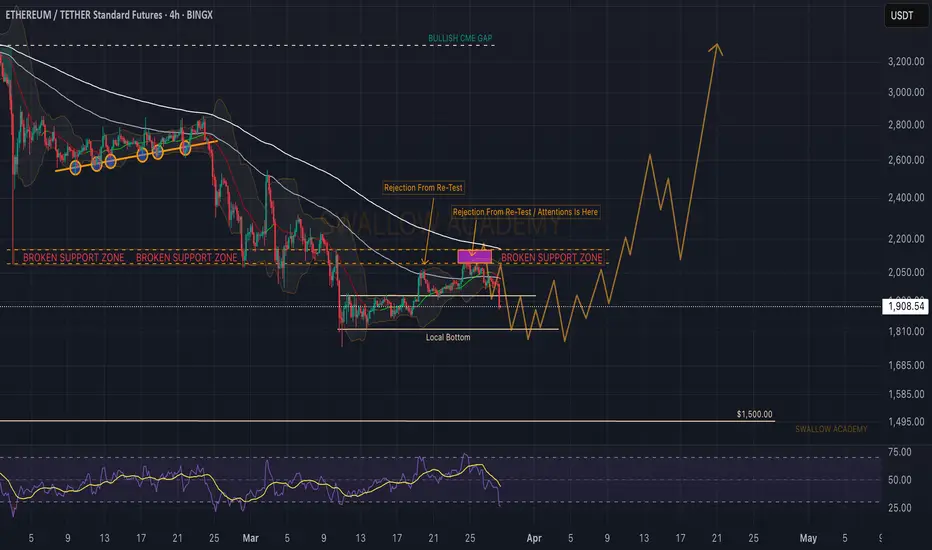
Ethereum (ETH): Sellers Are Still Dominating Current Resistance!Ethereum struggles to have a proper breakout from our re-test zone, which is good.
Upon seeing the price rejection there, we can consider it as a successful re-test of the broken zone, which then would send the price for another smaller correction, before a bigger upward movement, which we are waiting for!
Anything above $2000, in our opinion, is a good price for accumulating the ETH into spot.
Swallow Team
