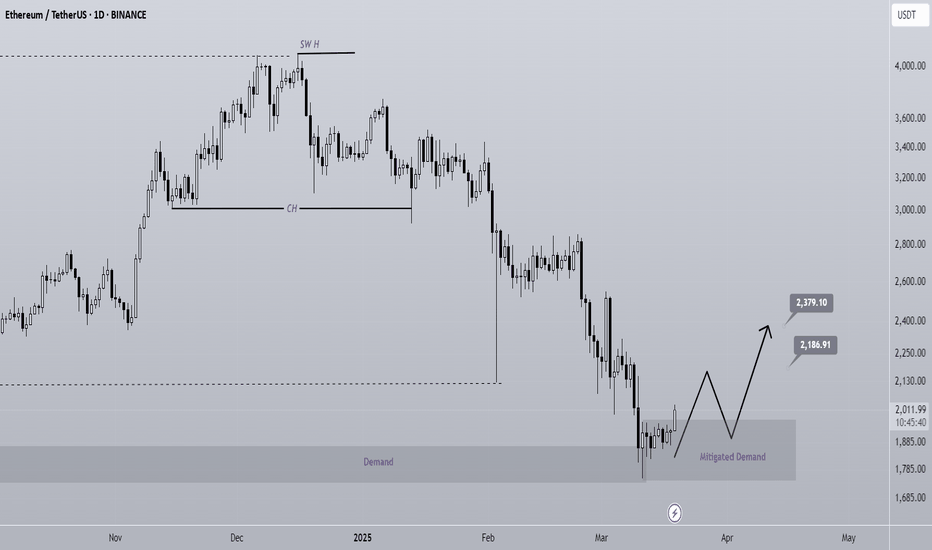
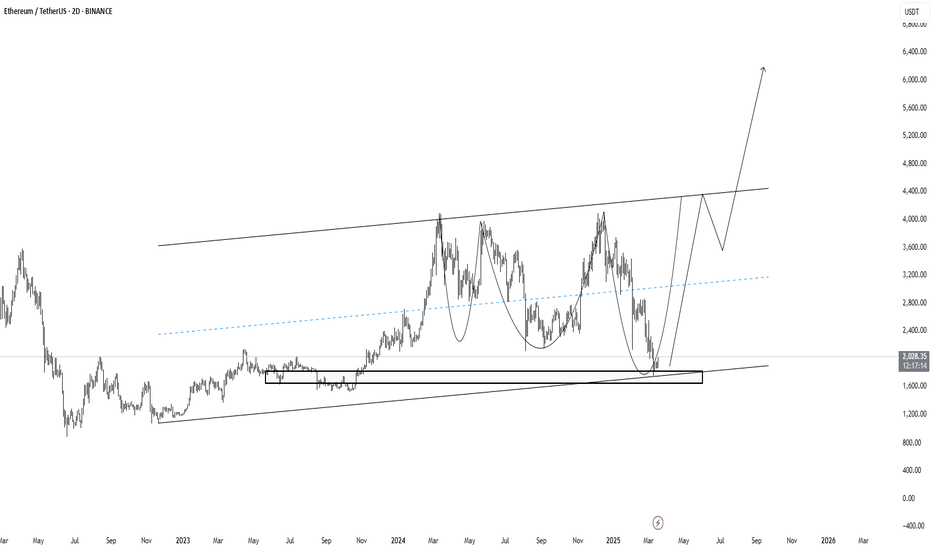
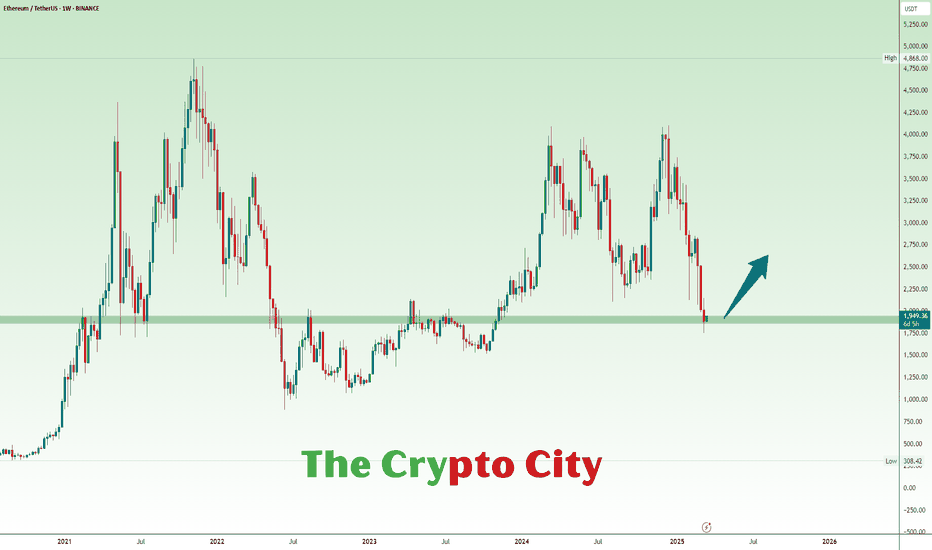
ETH is bullish (1D)Before anything else, you should know that Ethereum's structure in higher time frames is bearish. However, we currently expect an internal pullback to higher levels because the price has reached a significant zone.
The expectation is that the price will move from the mitigated demand zone toward the targets.
A daily candle closing below the invalidation level will invalidate this analysis.
Do not enter the position without capital management and stop setting
Comment if you have any questions
thank you
ETHBULLUSDT trade ideas
ETH Looks Bullish (1D)Before anything else, you should know that Ethereum's structure in higher time frames is bearish. However, we currently expect an internal pullback to higher levels because the price has reached a significant zone.
The expectation is that the price will move from the mitigated demand zone toward the targets.
A daily candle closing below the invalidation level will invalidate this analysis.
Do not enter the position without capital management and stop setting
Comment if you have any questions
thank you
ETH Analysis (1D)Ethereum is approaching a support level.
The risk-to-reward ratio is not very attractive since we are in a bearish trend, but we expect a reaction to the green zone.
There are two targets ahead of the price, which we have marked on the chart.
A daily candle closing below the invalidation level will invalidate this analysis
For risk management, please don't forget stop loss and capital management
Comment if you have any questions
Thank You
ETH : Don't get fooledETH has a lot of work to do. This ETH pump is a bearish pullback.
I'm still bearish on ETH and I'll be bearish until we break above the marked high. If we broke above the high significantly and sustained there at that moment I'll be a ETH bull again. Until then technically it is just a bearish retest.
I do not trade futures, I'm a spot trader so my plan is simple. If it breaks above the high then I'll look to buy the dip otherwise I'll not touch this thing.
Ethereum Breaks Key Resistance: Bullish Setup for ETH 🚨 **Ethereum Breaks Key Resistance – Bullish Signal!** 🚨
After weeks of consolidation, Ethereum ( CRYPTOCAP:ETH ) has finally broken through a crucial resistance level, triggering a massive short squeeze that liquidated **$46 million** worth of short positions! 💥 This is a strong sign that market sentiment could be shifting to the upside.
Here’s the breakdown:
🔑 **Resistance Breakout**: Ethereum has successfully closed a **4-hour candle above** the key resistance level, signaling a potential trend reversal and continuation to the upside. The market is now eyeing the next major target at **$2100**.
📈 **Trade Setup**:
- **Entry Point**: We are looking for a **retest of the $1960 level** as support (previous resistance), which is a strong entry zone for a long position.
- **Stop Loss**: Set your stop loss just below the previous support level at **$1920** to manage risk effectively.
- **Target**: The next major resistance is around **$2100**, where we expect some price action to unfold. A break above this could signal further upside potential.
This breakout presents a clear opportunity for traders looking to capitalize on potential bullish momentum in Ethereum. Keep your eyes on the charts and manage risk appropriately! 🔍
**Remember**: As always, trade responsibly and stay updated on market conditions.
Ethereum (ETH): Still Waiting For Perfect OpportunityOn the Ethereum, there is nothing much to talk about. We had a small touch to our line of potential BoS but we bounced off from there and now the price is rising, possibly for the upper zone to test it properly.
We are waiting for more confirmations, but the gameplan for both scenarios is still the same!
Swallow Team
ETH is preparing to get out of range and pull a face-melterETH might finally be getting ready to break out of that range we've been trading in since it broke down $2000 level.
If the selling pressure eases with the news coming in, and we don't see a massive whale shorting, putting downward pressure yet again, ETH might ultimately have a chance to break out to the upside and reclaim the psychological $2000 level. The rest will be better if we get some momentum afterwards.
Stay hard, stay alert.
Ethereum (ETH/USDT) Analysis – 4H Chart (OKX)Ethereum (ETH/USDT) Analysis – 4H Chart (OKX)
Support Levels:
First support: 1,912 USDT
Next support: 1,911 USDT – 1,909 USDT
Key support: 1,889 USDT
Resistance Levels:
First resistance: 1,933 USDT (Supply Zone)
Next resistance: 2,048 USDT
Major resistance: 2,244 USDT (Fibonacci 0.382 zone)
Entry Points:
If the price holds above 1,911 - 1,912 USDT, it could be a Long entry opportunity.
If the price breaks 1,933 USDT with strong buying volume, it may test 2,048 USDT.
If the price drops below 1,889 USDT, selling pressure may increase.
Risk Assessment:
If the price breaks 1,889 USDT, it may drop further to 1,876 - 1,753 USDT.
Stop-loss should be placed below 1,876 USDT.
Trade Conditions:
ETH is currently in a consolidation phase, with key resistance at 1,933 USDT.
A breakout above this level could lead to a test of 2,048 USDT and beyond.
A breakdown below 1,889 USDT may trigger further selling pressure.
📌 Summary:
ETH is in a potential rebound phase. If it holds above 1,911 - 1,912 USDT, there is a chance for an uptrend. However, if it falls below 1,889 USDT, it could decline further. Watch out for volume and price action before making a trade decision. 🚀
Possible AccumulationThere is no better Seller liquidity than U.S. Open on a Wednesday!
If I wasn't already in, my plan would be to Buy here with Tight SL under this supposed Spring or wait for a breakout of 2K.
The chances of going lower has decreased considerably.
Fear and Greed was under 10/100!
The target is 128K for BTC and 5.5K for ETH before a potential collapse.
For now, I believe we have 1 last hoorah!
I think DOGE, LTC ETF's are the top later this year.
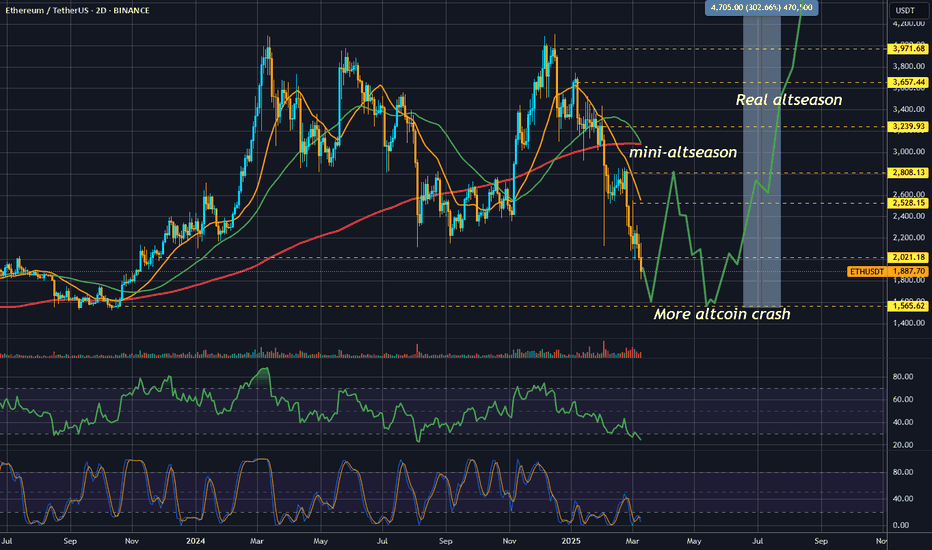
ETH nears 1500$. Be ready for volatility. Final ETH bottomFinally ETH is getting to 1500$ as i was writing back in nov-dec
For ETH 1500$ will be the bottom and in the next 3-5 weeks most likely we will see mini-altseason.
After that we should expect some more down side for most of altcoins but ETH likely to retest 1500$ and form double bottom.
As this move is complete, real altseason will begin and ETH goes to 5-6k maybe higher.
This is how i see it right now.
Ethereum (ETH): Ideally We Need To See a Re-TestEthereum is still in unstable zones where we did not have a proper re-test of the broken zone but we see chunks of weakness on the markets near current zones.
So we keep an eye on 2 zones: the upper re-test zone and that lower yellowish line.
Upon breaking the yellowish line, we will see an early selloff, and if we see a touch to the upper resistance zone, then we will be looking for a weakness and an entry for short from there!
Swallow Team
Lingrid | ETHUSDT October 2023 LEVELS ReachedBINANCE:ETHUSDT price continues to push lower, reaching the support level that was last tested in October 2023. Historically, we can observe similar price action from 2021, when the price fell from the 4300 level and subsequently bounced off the 1700 support zone, leading to all-time highs. On the current chart, we see that the price has broken above the downward trendline that has acted as a resistance zone for the month. I think the price will continue to move sideways for the next couple of weeks, potentially pushing higher if we see buying pressure from the support level. My goal is resistance zone around 2190
Traders, If you liked this educational post🎓, give it a boost 🚀 and drop a comment 📣
Ethereum Set to Drop 15%: $1,750 Target Ahead, Stay Alert!Hello and greetings to all the crypto enthusiasts, ✌
All previous targets were nailed ✅! Now, let’s dive into a full analysis of the upcoming price potential for Ethereum 🔍📈.
Ethereum is currently navigating within a downward channel, with the possibility of establishing a parallel channel. Based on technical indicators, there is a projected 15% decline toward the identified support level on the chart. This forecast aligns with prevailing market trends and resistance points. The primary target for Ethereum in this scenario is $1,750, and it’s crucial for investors to remain vigilant and adjust their strategies as market conditions evolve.📚🙌
🧨 Our team's main opinion is: 🧨
Ethereum is in a downward channel, and I’m expecting at least a 15% drop to the support level, with a target of $1,750, so investors should stay alert and adjust accordingly. 📚🎇
Give me some energy !!
✨We invest hours crafting valuable ideas, and your support means everything—feel free to ask questions in the comments! 😊💬
Cheers, Mad Whale. 🐋
ETH/USDT Weekly Chart Analysis. The Ethereum (ETH/USDT) weekly chart suggests a potential bullish reversal from a key support area. Here are the details of the analysis:
Support area: Around $1,750 – $1,830, where the price recently rebounded.
Resistance levels:
First target: $4,015
Key resistance: $4,663, which marks a key breakout level.
ETH has bounced off historical support levels, indicating potential accumulation.
If the price sustains above $1,800, the next target is $4,015, followed by $4,663 if the momentum continues.
A break below $1,747 – $1,700 could lead to further declines, with the next strong support near $1,053.
Look for a confirmation of a breakout above $2,000 to confirm a strong uptrend.
Keep an eye on volume and indicators (RSI, MACD) for further confirmation of momentum.
Risk management is important in volatile market conditions.
If you found this analysis helpful, hit the Like button and share your thoughts or questions in the comments below. Your feedback matters!
Thanks for your support!
DYOR. NFA
Bitcoin & Ethereum same time currently rejecting on their LTF re
Bitcoin still struggling to break above on LTF resistance at 84.5k which is our cyan box range. 📉
Ethereum still continue doing ranging since from the recent breakout above on trend resistance white line which indicates the first sign for possible leg up but as of now buyers volume is not enough to produce a mini impulse up.
Patiently waiting again for this two major coin to confirm while some alts is popping aggressively upwards panda fam, Trade what you see not what you feel ✨
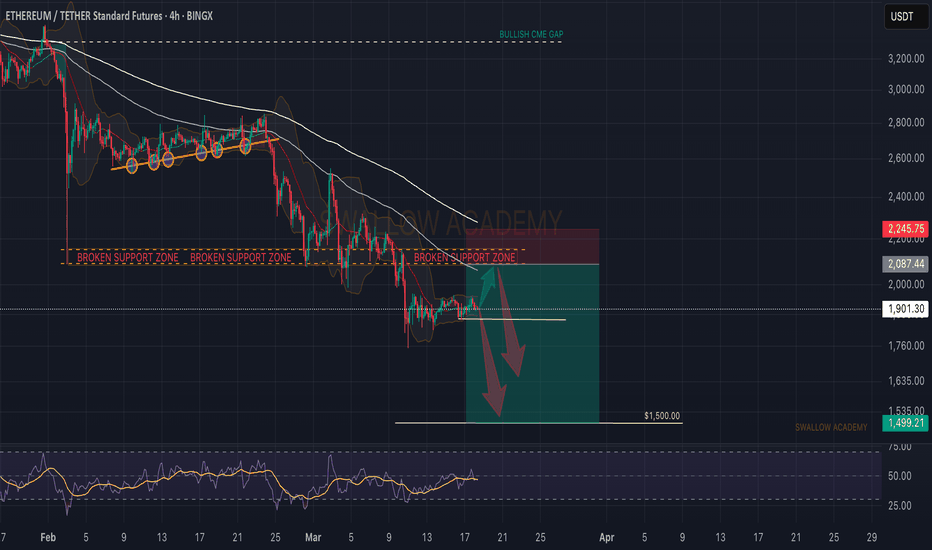
Ethereum (ETH): Hovering Near Support / Next Target $1,500.0Ethereum has been in the bloodpath for quite a while (since breaking down from a bullish trend), considering that we did not see a touch the ATH.
Now that price is below that bullish trend and we are still seeing no buying volume near the current support zone, we are expecting the $1,500.0 to be reached. Why that zone, you may ask? Well, big whales like round numbers and place their orders rather near round numbers, so this is the zone we are going to keep an eye on!
ETH still has potential, so let's keep an eye on, it. We expect the market dominance to flow into Ethereum soon!
Swallow Team
