ETHBULLUSDT trade ideas
"ETH/USDT 1H: Bullish Reversal in Play – Targeting $2,280?ETH/USDT 1H: Bullish Reversal in Play – Targeting $2,280?
🚀 Follow me on TradingView if you respect our charts! 📈 Daily updates!
Market Structure (Confidence Level: 8/10):
Bullish reversal forming after testing $1,800 support.
RSI confirms hidden bullish divergence, with higher lows on RSI while price made lower lows.
Smart Money Analysis:
Strong order block formed at $1,880, reinforcing demand.
Break of market structure at $1,950, confirming a shift in trend.
Institutional accumulation visible in the volume profile, suggesting Smart Money positioning.
Trade Setup:
Entry: $1,953 - $1,960 (current retest).
Targets:
T1: $2,120 (Fair Value Gap fill).
T2: $2,280 (high-timeframe resistance).
Stop Loss: $1,880 (below recent swing low).
Risk Score:
7/10 – Favorable risk-to-reward, but a stoprun below $1,900 remains a risk.
Market Maker Activity:
Currently engineering a stoprun below $1,900, likely before a continued move higher.
Volume increasing on bullish moves, confirming institutional buying interest.
Key Levels:
Support: $1,880, $1,800.
Resistance: $2,120, $2,280.
Recommendation:
Long positions remain favorable at the $1,953 - $1,960 entry zone.
Monitor for a stoprun below $1,900 as liquidity is being engineered before continuation.
Manage risk tightly, as Smart Money is accumulating ahead of a potential breakout.
🚀 Follow me on TradingView if you respect our charts! 📈 Daily updates!
Ethereum (ETH/USDT) Perpetual Futures – Monthly Chart Analysis Overview:
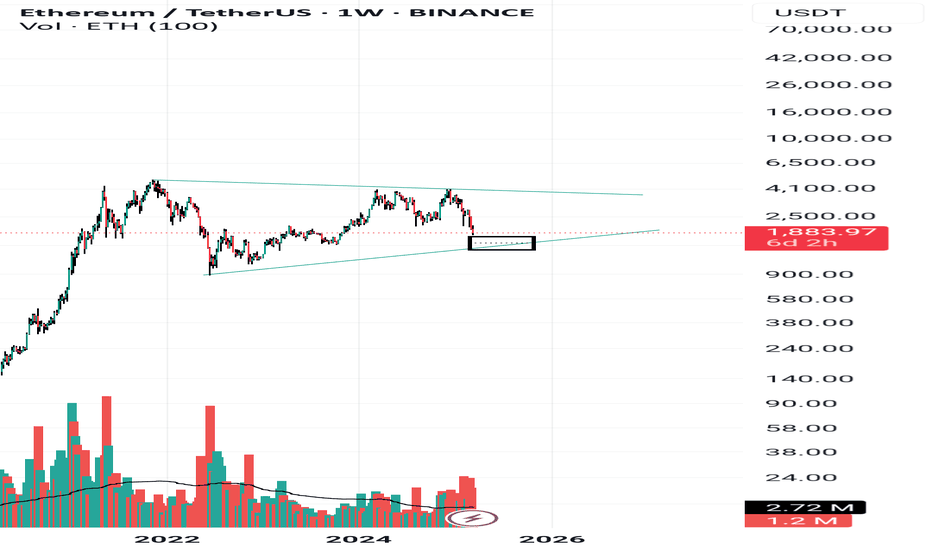
Ethereum is currently testing a significant price zone after breaking out of a long-term symmetrical triangle pattern on the monthly chart. The recent drop has brought ETH to a major support area, which could act as a strong demand zone before a potential reversal.
Key Observations:
Symmetrical Triangle Breakdown:
ETH/USDT formed a symmetrical triangle over multiple years, representing a period of consolidation.
The price recently broke below the lower boundary of this pattern, leading to a sharp decline.
Major Support Zone (Potential Bounce Area):
The black box highlights a key demand zone between $1,750 – $1,800.
This area previously acted as a support level in the past market cycles.
If buyers step in, ETH could see a strong rebound from this region.
Reversal Area Target ($6,000+):
The chart suggests a potential long-term rally if ETH holds the current support and reclaims key resistance levels.
The expected price trajectory follows a higher-high, higher-low pattern toward the $6,000 zone.
This target aligns with the previous all-time high zones and Fibonacci extension levels.
Bearish Scenario (Risk Consideration):
If ETH fails to hold the $1,750 support, the next significant support level is near $1,500 - $1,200.
A continued downtrend could invalidate the bullish recovery scenario.
Trading Strategy Considerations:
✅ Bullish Setup (Rebound from Support)
Entry: Near $1,750 - $1,800, looking for a bullish confirmation (e.g., daily/weekly green candle).
Target 1: $2,500 (prior support turned resistance).
Target 2: $3,500 (mid-range resistance).
Target 3: $6,000 (full breakout target).
Stop-loss: Below $1,700, in case of further breakdown.
❌ Bearish Setup (Breakdown Below Support)
If ETH closes below $1,750, the next downside targets are:
$1,500 (key psychological level).
$1,200 (historical support zone).
Conclusion:
Ethereum is at a make-or-break point after breaking its long-term triangle pattern.
Holding $1,750 could spark a massive bullish reversal, with potential upside toward $6,000+.
A failure to hold support may lead to deeper corrections.
Traders should monitor the $1,750 level closely for confirmation before entering positions.
🚀 What’s Next?
Watch for bullish price action signs (e.g., long wicks, strong green candles) around the $1,750-$1,800 area before making a move. If ETH reclaims $2,500, it could signal a strong recovery phase.
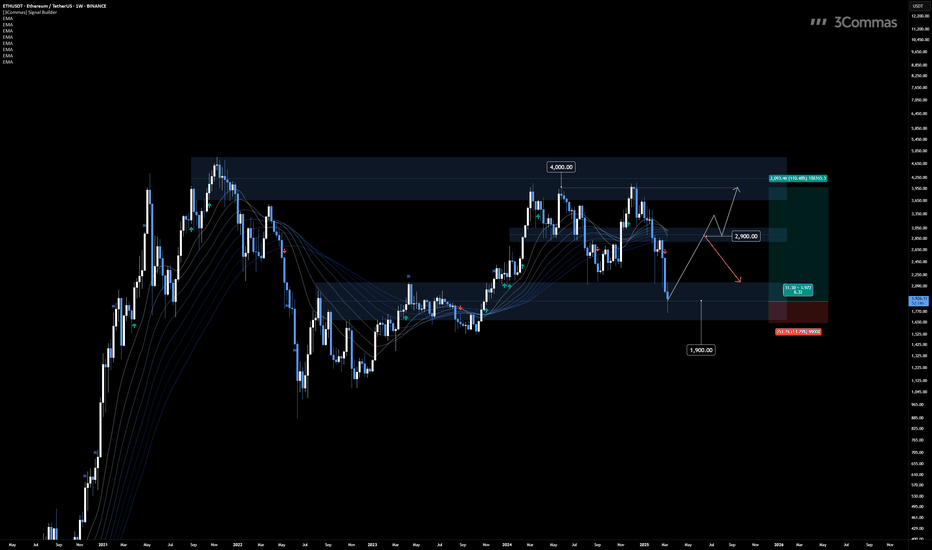
Ethereum Testing Key Support: Next Targets $2,900 and $4,000
The BINANCE:ETHUSDT BITSTAMP:ETHUSD chart on the 1W timeframe shows Ethereum testing a critical support level at $1,900, which aligns with the lower boundary of its ascending channel. This level has historically acted as a strong demand zone, making it a key area to watch for a potential bounce.
If ETH holds above $1,900, we could see a move toward the first resistance at $2,900, where price has previously faced rejection. A breakout above this zone would confirm further bullish momentum, with the next target at $4,000, aligning with the upper range of the channel.
However, if $1,900 fails to hold, Ethereum could continue forming lower lows, invalidating the bullish scenario. The next steps depend on confirmation signals from this key support level.
👨🏻💻💭 Will ETH bounce from $1,900 and push toward $4,000, or are lower prices ahead? Let’s discuss the potential next move!
__
The information and publications within the 3Commas TradingView account are not meant to be and do not constitute financial, investment, trading, or other types of advice or recommendations supplied or endorsed by 3Commas and any of the parties acting on behalf of 3Commas, including its employees, contractors, ambassadors, etc.
Ethereum (ETH): Possible Smaller Recovery - Next Target $1,500.0Ethereum had broken the major support zone at $2,000.0
Now that price has broken it and successfully re-tested, we are looking for $1,500.0 to be reached, where we expect to see some sort of fight to take place between buyers and sellers.
Currently we see a smaller recovery to take place so we might go for another retest here but overall our game plan is still the same—we should fall more!
Swallow Team
Idea No. 2 for the spotEthereum, in general, the formation of movements is not directly obvious, but still
The second cryptocurrency in history, consensus POS, a huge number of developers and projects are built on the Ethereum blockchain.
What about tokenomics ? Due to the shift to POS, more coins are being burned than created. So now coins are in circulation at the same level as during ATH. Deflationary model plus to the aura for the long term.
Also seeing accumulation by big capital, especially Trump's company.
On the downside, except for the recent hack of the exchange and the theft of coins worth a yard and a half of greenbacks, but of course it is unlikely that they will be able to sell it all at once and quickly. That's why I'm placing a stop at the $2,000 level.
Consider your risks.
DYOR
ETHUSD macroLogscale trendlines have broken down so back to linear scale
Last Bullish macro trendline since the 2017 charts at least
Covid down wick to the LUNA 3AC/FTX credit crunch wick
and and we just tested beneath and bounced a bit
Full Blood moon eclipse (which was the LUNA FTX crashes coincidentally) is in 2 days
so potential for another crunch type move there...
if we loose this trendline, previous bear market targets of the LUNA collapse and then 2017 cycle high is in range
The infrastructure built on ETH especially since then has been incredible and I personally cant see the network going to 0 any time soon, that being said the networks function at any price..
Not sure what catastrophic event could cause this complete breakdown, especially given cryptocurrencies fairly widespread adoption from companies to governments... BTC particularly
that being said eth is the peoples chain with much greater functionality than BTC and still has much greater decentralization than any other copycat chain, scaling has gone very well so the gas problem isn't really an issue like it was particularly utilizng the L2's
only chain that hasnt had downtime since it went offline..
how to accurately value these chains is difficult for the market broadly as they are so new..
only chain ive seen that could threaten eths viability is the new hypercore/hyperevm dual chain given how useful the hypercore is... long term ETH BTC thesis remains valid in my eyes..
If the bullish market structure is to remain in tact, it would have to bounce over the coming months otherwise we may have seen peak valuations for the time being.
The main thesis for crypto currencies being that a global reserve currency is impossoble to manage and hyperinflation will continue unchecked until people are forced to adopt something with actual scarcity and the netowrks continueing volatility forces greater decentralization.
Mostly i think quantitive easing will continue for now and bullish market structure holds due to this.
Ethereum at Critical Levels – Breakout or Breakdown for ETH?Ethereum (ETH) is looking heavily overextended right now 📊, with price action pressing into key support zones on the daily and weekly charts ⏳. The market is at a critical juncture, and a sharp pullback 📉 could be on the cards.
This could present a short-term counter-trend buying opportunity on the lower timeframes 💰, but if ETH pushes higher, it may offer a prime short setup 🎯.
⚠️ Not financial advice – trade smart and manage risk accordingly! 🚀
Ethereum Bear Market Scenario: $1,875 → $3K → $800 – Possible?Ethereum's volatility also makes this price movement scenario plausible. Similar to Bitcoin, Ethereum has experienced sharp corrections and rebounds in the past, and such a pattern could unfold again. A rise to $3K could occur after a period of consolidation or a market rally, fueled by renewed investor confidence or positive developments in the Ethereum network. However, broader market downturns, macroeconomic factors, or investor risk aversion could drive the price back down to $800, as seen in previous bear markets.
Technical analysis also plays a role, as breaking through key support and resistance levels can trigger large price moves. Additionally, unexpected events, such as regulatory crackdowns or network vulnerabilities, could accelerate these shifts. While speculative, this scenario highlights the importance of risk management and strategic planning. What do you think about this potential price path for Ethereum? Feel free to share your thoughts below! 🚀📉
ETH LONGETHERIUM IS LONG , now this is at its support of trendline and also in the same level of fib bounce as it had done in the past, from fib 0.618-0.786. there is adivergence on 4h also. so it is a right itme to long etherium with the sl of below the fib 0.786 level that is around 1400-1450 and we look for 1:4 tp to the price 4120... with a trailing sl you can hold the trade till the level 4800-4850 that is all time high. inshallha this trade will go accordindly.
GREAT LONG OPPORTUNITY HAS COME✅ PREVIOUSLY ON ETH
We thought that it could be the bottom at 870.
We were waiting for the long opportunity after 2030.
✅WHERE WE ARE
ETH is at the strong support line. We expect the strong bullish impulse at the moment.
💡The absolute principle for trading💡
LONG- as low as possible
SHORT - as high as possible
PLEASE DO NOT FORGET TO SMASH LIKE👍🏻 AND FOLLOW ME❤ IT MOTIVATES ME TO THE NEXT IDEA! THANK YOU 🎉
*As long as 1073 remains unbroken, this idea is valid.
Positive days coming? ETH Crypto MarketWill Ethereum end its downtrend? Ethereum has been quite weak for a long time and is currently at an important support level. If it breaks down further, a sharp decline may continue, but if it holds the support, the upcoming period could be more positive.
Many cryptocurrency dominance charts, as well as Nasdaq and stock charts too, showing the same pattern. Is the reversal starting?
We’ll see.
This is not investment advice. Please do your own research.
Wishing you best.
-YusufDeli


