$Ethereum Weekly Outlook Ethereum Weekly Outlook 🔥
CRYPTOCAP:ETH just bounced hard from the macro trendline key demand zone
- Now reclaiming the $2,350 level is a strong bullish signal.
- The next major resistance sits at $4,800.
- The path looks bullish if we hold this zone.
Accumulate smart.
ETHBULLUSDT trade ideas

ETHUSDT Daily : READY For Ethereum ATH Hi guys ,
So let's see if Ethereum finally gets its turn. The chart has heavy nodes for growth but I think we could see Ethereum at $4,000 again.
SecondChanceCrypto
⏰ 9/May/26
⛔️DYOR

possible target estimationPrice at the moment looks more bullish.
we should consider we are moving into downtrend channel in a bigger time charts yet.
so if the price could hold the base area at my chart has big chance to break out that channel.
at this scenario the closest target is around 2100$ for short term.
if price could manage to break up the channel we could consider our main trend changed to
bull trend.
Enjoy the market

ETH : BUY...Hello friends
Due to the entry of buyers and the breakdown of the trading range, we can buy in the direction of the trend and with capital and risk management within the specified limits and move to the specified targets.
*Trade safely with us*

Ethereum 6X Lev. Full PREMIUM Trade-Numbers —2nd Entry—PP: 1806%This is a second entry for a long-term leveraged chart setup for ETHUSDT (Ether).
This is truly the last chance to get Ethereum at low prices before a major bullish impulse, the biggest one in a long time.
The chart structure is perfect. The low conditions look very similar to June 2022, very similar.
We have long-term higher lows blah blah blah... By now, you already know all these things as I read this chart a million times.
I don't have much to say other than remain calm, whatever happens. Sleep easy because Crypto is going up. It is as simple as that. It will grow, soon.
Full trade-numbers below:
_____
LONG ETHUSDT
Leverage: 6X
Entry levels:
1) $1,900
2) $1,825
3) $1,630
Targets:
1) $2,125
2) $2,405
3) $3,347
4) $4,017
5) $4,871
6) $6,000
7) $7,337
Stop-loss:
Close weekly below $1,600
Potential profits: 1806%
Capital allocation: 3%
_____
I would like to thank you again for reading. Your support is appreciated.
I know it is a lot of content but this is meant for many different people all across the world.
If you like what you see make sure to follow.
If you want to see more, leave a comment and boost to show your support.
This is the big one.
Namaste.

#ETH reaches target zone 📊#ETH reaches target zone ✔️
🧠From a structural point of view, the long structure we built in the daily buy zone has been fully achieved and is about to touch the original upward trend support line (now turned into resistance line). Therefore, there is a possibility of a pullback, so please be cautious in chasing the rise.
➡️If we do not fall back from here and continue to rise, then the next heavy resistance level worth our attention is around 2500.
➡️Today I have sold all 20% of the purchases in March. I will look forward to a pullback. The best case scenario is that the price will return to the daily buy zone again and buy back the positions sold today.
Let's see if the market will give us such an opportunity👀
🤜If you like my analysis, please like💖 and share💬
BITGET:ETHUSDT

ETH is finally showing some sign of lifeETH after being bearish for so long is finally seen some inflow of money towards it, meaning ALT season is starting to show little glimpses here and there.
ETH Long term looks really good, if everything continues as smooth as it is currently then I will expect ETH to do great, the current targets I have going up 2.4k if the price hold those levels then 3.4k will be a walk to the park.
if it goes down to the 1900 even the 1700 area, I will just buy more.
Always put stop loses the current economy is showing no mercy, neither should we.

Buy ETH Today to Double TomorrowBuy ETH Today to Double Tomorrow - Mid term Investment Opportunity
Hello folks, it's Tradevietstock again!
Ethereum has been stuck in a flat trend for nearly a year, with no real bullish momentum. ETH holders have grown tired of the sideways action — and understandably so.
But I believe the right moment is finally approaching — and it could change everything.
This upcoming opportunity could allow you to double your investment, riding the next major ETH breakout for substantial profit.
1. ETH recent bear markets
Since late 2024, Ethereum has dropped by nearly 70%, with no significant bullish wave in sight.
This period stands out as one of the most stagnant and uninspiring phases in ETH’s history — a prolonged, grinding bear market that has tested the patience of even the most committed holders.
Yet despite the dullness and despair, I firmly believe the right time is approaching. Markets often move in cycles, and this kind of deep, extended consolidation can precede explosive upside.
Let’s dive into some historical patterns to see what might come next.
During 2024, Ethereum went through a prolonged bear market, dropping approximately 46% from its highs. Unlike sudden crashes, this decline was marked by a slow, persistent downtrend that drained confidence over time. The bearish candles weren’t extreme at first, but the steady erosion in price made it a painful phase for ETH holders. This drawn-out decline is what truly defines a bear market — not just the depth of the drop, but its duration and psychological toll. As is often the case, the final stage was the harshest: toward the end of 2024, ETH plummeted over 10% in a single day, a capitulation move that marked what many now recognize as its long-term bottom.
After enduring a long bear market and several extreme bearish candles, ETH has finally confirmed its bottom and rebounded by approximately 76%. This is a classic pattern: when most people are fearful, bored, or have given up — that’s when the real opportunity begins. This phase, often ignored by the majority, is exactly when smart investors position themselves for the next wave.
In 2022, Ethereum experienced one of its steepest declines ever, dropping by approximately 80% from its peak. After the initial crash of around 50%, ETH saw a short-lived rebound — rising by about 50% — before continuing its downward trajectory.
After any major decline, we typically look for a bullish breakout as the signal that an uptrend is beginning. Interestingly, strong buy opportunities can often be found near bearish breakouts — especially when extreme bearish candles appear, as they often mark the final stage of capitulation before a reversal.
Some examples of Extreme Bearish Candles:
2. Necessary Signals to buy ETH
Firstly, we absolutely need Bullish Breakout Candles to confirm the end of the bear market and the start of an uptrend.
Secondly, we can likely expect an extreme bearish candle to appear just before the bullish breakout.
This sharp move could even break the recent support near $1,378, triggering extreme fear across the market and within the ETH community.
Such capitulation events are common before major reversals — they flush out weak hands and set the stage for a strong upward breakout.
My signal:
Position: BUY
Entry: 1378-1675
Target: 4100
Disclaimer:
This is a mid-term investment strategy, not intended for short-term trading.
If you’re a short-term trader, please adapt this plan to suit your own risk profile and trading style.
Always prioritize proper risk management to protect your capital — don’t let one trade be the reason you blow up your account again.

BUY ETHbuy eth to the next liquidity area that shows good volume aand if closes below the support level sell it also to the next support liquidity area

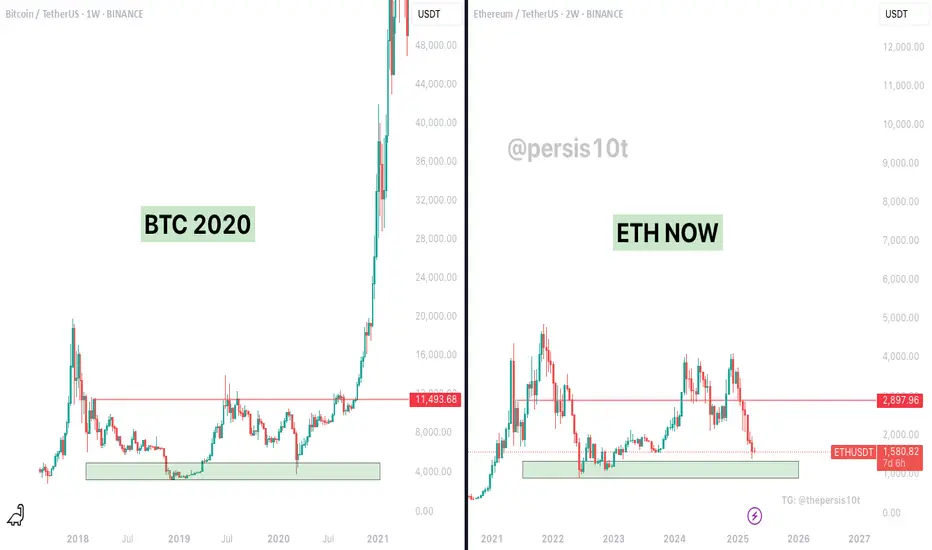
History Doesn’t Repeat, But It Often Rhymes – ETH = BTC 2020?On the left: BTC in 2020 before it exploded from ~$11K to $ 60 K+
On the right: ETH now, sitting on a similar macro support zone and showing a similar multi-year accumulation range.
This Chart Suggests:
BTC (2020) consolidated for years in a tight range between $3K and $ 12K before blasting off.
ETH has now spent over two years ranging between ~ $ 1K and $3K, forming a strong base at support just like BTC did.
The current ETH structure mirrors BTC's pre-bull breakout — clean support retest, fakeouts, and suppressed volatility.
If ETH follows a similar path, the next parabolic expansion could be approaching.
This isn't just about pattern recognition — it's about timing cycles, sentiment shifts, and institutional patience.
“The best trades often feel the most uncomfortable.”
While many are panicking, ETH is printing a macro setup that resembles the beginning of Bitcoin’s strongest run in history.
Are you prepared if ETH goes full BTC 2020 mode?
ETHEREUM New Update (1D)Price has approached a supply (flip) zone. It is not expected to break this zone on the first attempt, and bears are likely to regain control for now.
If Ethereum returns once again to the lower zones marked on the chart, it could present a low-risk opportunity for buy/long positions.
The main target can be the upper supply zone.
A daily candle closing below the invalidation level would invalidate this analysis.
Do not enter the position without capital management and stop setting
Comment if you have any questions
thank you

Ethereum Wave Analysis – 8 May 2025- Ethereum broke the resistance zone
- Likely to rise to resistance level 2100,00
Ethereum cryptocurrency recently broke the resistance area between the major resistance level 1935,00 (former monthly top from April) and the 50% Fibonacci correction of the downward impulse from March.
The breakout of this resistance zone accelerated the active short-term ABC correction ii from the start of April.
Given the strongly bullish sentiment seen across the cryptocurrency markets, Ethereum cryptocurrency can be expected to rise to the next resistance level 2100,00 (top of the previous correction iv).

Ethereum 6X Lev. Full PREMIUM Trade-Numbers (PP: 3,198%)Ether (Ethereum's token) just set a long-term higher low. The main low happened in June 2022 and the higher low now, April 2025.
Ok, let's make a pause. Before going into the chart details and technicals, let me say that this is a high probability trade setup. If you've been following for a year or more, you know what this means. This is a win.
Ethereum is set to grow and this growth will happen based on the long-term.
The numbers below can produce a huge reward with relatively low risk.
This is for advanced traders only. You need to be able to adapt to market conditions and have some experience before your decide to trade. If you are certain and you are a responsible adult; Welcome, I am wishing you tons of success.
The market gives and the market takes.
The market is set up now to give and it will give us big, big wins. These wins are here for you, if you have what it takes.
Full trade-numbers below:
____
LONG ETHUSDT
Leverage: 6X
Entry levels:
1) $1,650
2) $1,500
3) $1,450
Targets:
1) $2,125
2) $2,405
3) $3,347
4) $4,017
5) $4,871
6) $6,000
7) $7,337
8) $8,861
9) $9,947
Stop-loss:
Close monthly below $1,380
Potential profits: 3198%
Capital allocation: 5%
____
Thanks for reading and for your continued support.
I am wishing you health, wealth, success and love.
Thanks for the follow.
Thanks for the comments.
Thanks for all these years of sharing, discussions and personal growth.
Let's continue together long-term.
We are only getting started.
Namaste.

Ethereum - Take LONG with MEEthereum - Take LONG with ME
we have long from 1754 with our team
follow up trend untip it breaks

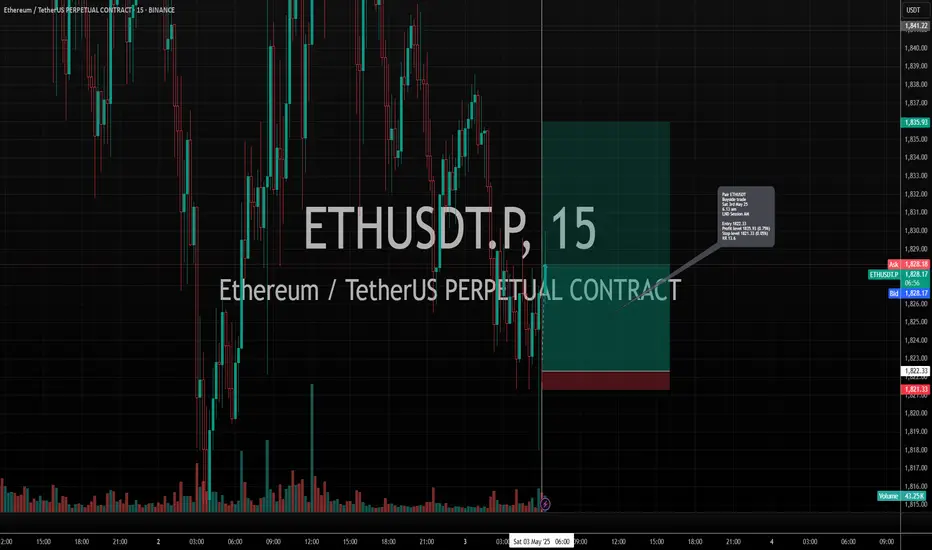
Long trade
1min TF entry
🗓 Date: Saturday, 3rd May 2025
⏰ Time: 6:13 AM
📍 Session: London AM
🪙 Pair: ETH/USDT
📈 Direction: Long (Buy Side)
🔹 Entry Details:
Entry Price: 1822.33
Take Profit: 1835.93 (+0.75%)
Stop Loss: 1821.33 (−0.05%)
Risk-Reward Ratio: 13.6
Trade Context:
Executed on the London session open, and I assume a high-probability window for momentum.
Price surged following a liquidity sweep and volume spike.
ETH LONG (Longer Timeframe)ETH is bullish, just like many other alts in the long term. Expected price drop to around $1690-$1720 range for entry long.
From my charts we can see that using PO3, manipulation happened the previous month, closing within range low. now price will seek to gather liquidity end from range high, closing above and around $2555.
Entry on fair value gap after bounce in $1690-$1720 range.

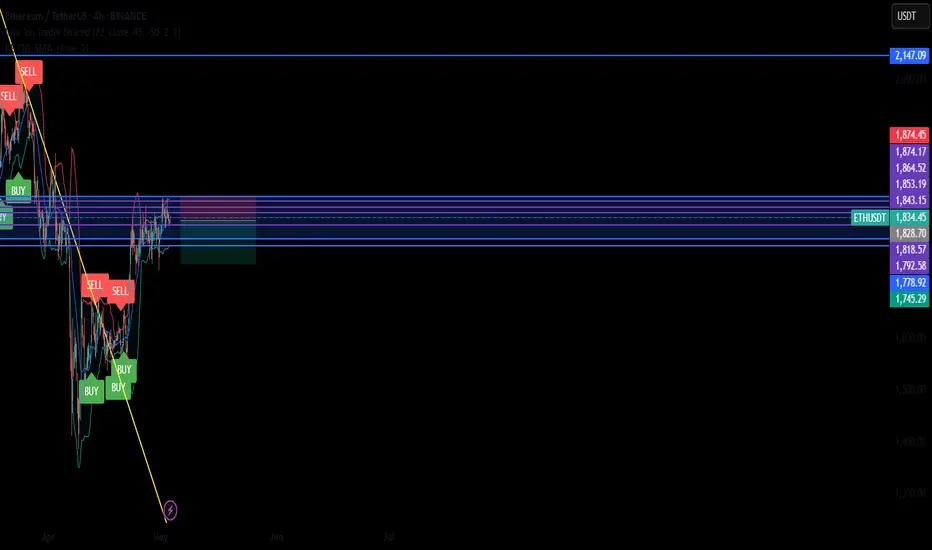
#ETH/USDT#ETH
The price is moving within a descending channel on the 1-hour frame, adhering well to it, and is heading for a strong breakout and retest.
We are seeing a rebound from the lower boundary of the descending channel, which is support at 1815.
We have a downtrend on the RSI indicator that is about to be broken and retested, supporting the upward trend.
We are looking for stability above the 100 Moving Average.
Entry price: 1840
First target: 1860
Second target: 1876
Third target: 1890

Ethereum (ETH): Rejection Inside Sideways Channel | Short SetupSellers showed strong dominance near the upper resistance zone, where, after multiple attempts to break out from this channel, buyers failed, and the price is declining now, leading it towards our supportive area and closer to our entry zone as well.
As we also recently broke the 200EMA line, we are now aiming to see the price drop at least to that lower sideways channel zone, where we expect to see some liquidation hunting and eventually a clean breakdown, which would then open us an opportunity to move even lower.
Swallow Academy

Ethereum Breakout After 64% Crash | Big Moves Ahead!After capturing a massive 60% fall in ETH, we are now spotting the first clear breakout sign on the daily chart!
ETH is currently trading around $1,794 and looks ready to rally towards the $2,100–$2,150 zone soon With a SL of $1,600 . 📈
Big institutional players have already started accumulating BTC and ETH heavily — the smart money is moving, and the impact will be visible very soon!
Stay tuned — the next few weeks could be a game changer for crypto!
🔹 #ETHUSDT #Ethereum #CryptoBreakout #iSparkIndicator #CryptoTrading #Bitcoin #CryptoAnalysis #TradingView

Be patient....Most investors are in big losses these days, and some are disappointed with the growth of this popular currency.
The area where it is now is considered a cheap area for this cryptocurrency, which personally attracts investors for a buying step.
You can have a buying step with your own decision and with your strategy, you can add the next buying step to it if it is confirmed for growth or at low prices.
In the end, you are the main decision maker.

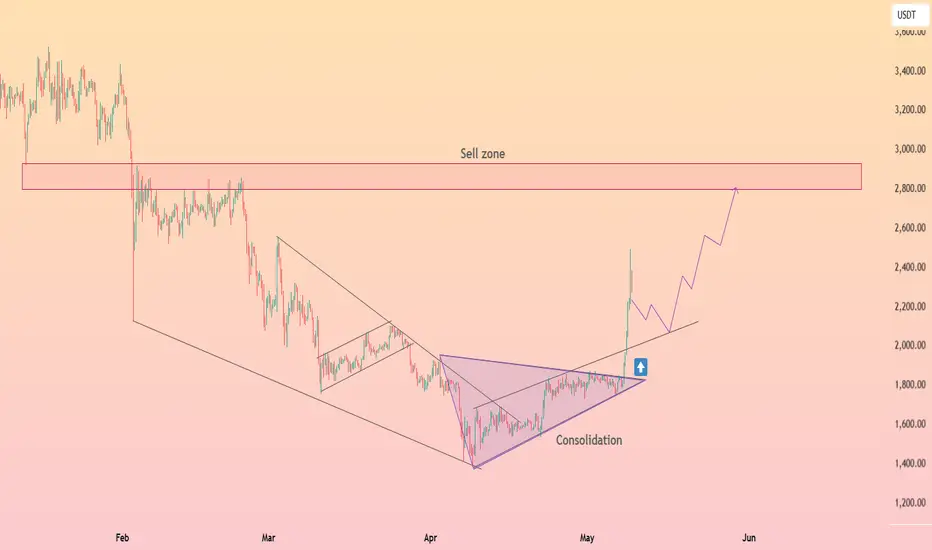
HolderStat┆ETHUSD breakout toward key resistanceAfter weeks of consolidation inside a symmetrical triangle, ETH has confirmed a bullish breakout with strong momentum. Price is now aiming for the $2800–$3000 sell zone, a key level from previous distribution. The breakout suggests increased buying pressure and a potential mid-term rally continuation.
💡 If ETH holds above the $1800 breakout zone, we could see a gradual climb toward $2800 in the coming weeks.
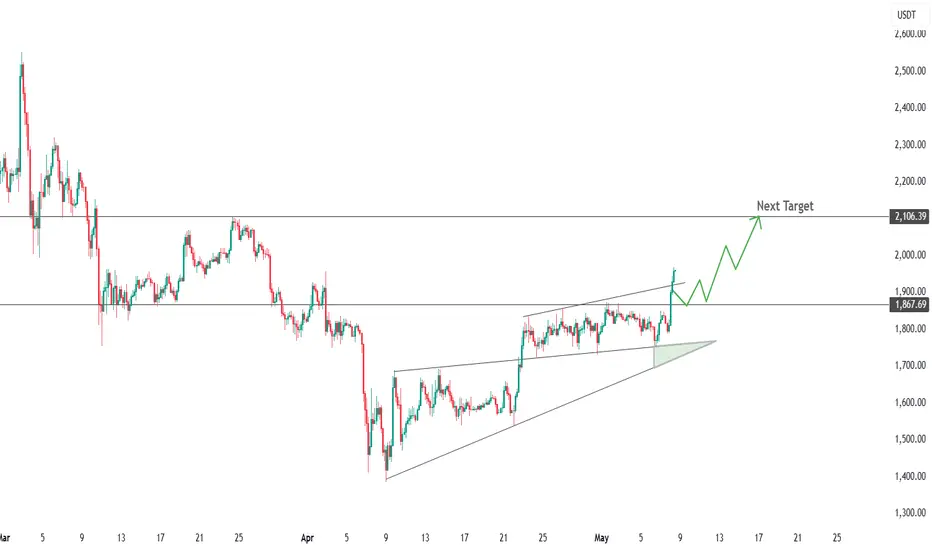
Broke the resistance levelCRYPTOCAP:ETH - wedge broken, target 2,100 USDT
After a three-week contraction, the price broke above the upper boundary of the ascending wedge and the 1,870 USDT horizontal, confirming a change of momentum in favor of the bulls.
📌 Levels
- S1 1 870 USDT - top of the wedge, retest zone
- S2 1,800-1,820 USDT - base of the formation
- R1 1 900-1 920 USDT - local obstacle near trend lines
- R2 2,106 USDT - calculated wedge height target and March supply area
📈 Scenario
Holding S1 opens the way to R1; a consolidation above 1,920 activates the march to 2,100 USDT. A run-up to 2,200 is not ruled out with strong volume.
⚠️ Risks
A failure ⇩ 1,870 would indicate a false breakout; a move below 1,800 would bring the price back to the wedge and increase the chance of a test of 1,740.