ETHUSD | Bullish breakoutprice has been trading in a bullish flag near resistance at 1,875 which has failed to take price lower on the bearish daily trend. If price breaks out of the flag, we may be looking for targets to 1950 and 2000.
ETHBULLUSDT trade ideas

Ethereum Future: Limited Upside Ahead?Ethereum price dropped roughly 25% since April 2 due to an overall market crash following Trump’s tariffs implementation.
Compared to the almost 40% drop back in February after the first tariff announcement, this time the correction wasn’t as harsh or brutal.
So what can we expect next from Ethereum in the coming weeks?
The main hope for ETH price remains the upcoming Pectra upgrade.
Historically, major Ethereum upgrades have acted as bullish catalysts — for example, ETH roughly doubled in price ahead of both the Merge and the Shanghai upgrade.
If history rhymes, we could see a similar pre-upgrade pump this time too.
However, even if that rally materializes, I expect it to be limited to the $3,000–$3,400 range. The market lacks the kind of momentum or macro tailwinds needed to push ETH beyond 4k in this cycle — unless there’s a major shift in sentiment.
Overall, I remain cautious. The broader crypto market seems to be rolling over, and Ethereum hasn't even reclaimed its ATH.
With the next bear cycle approaching, long-term bullish targets might need to be revised — at least for now.
Short-term bounce possible thanks to Pectra hype, but don’t expect miracles. ETH likely capped below 3.4k unless something big changes.

ETH (Ethereum)–High-Risk, High-Reward Setup Near Fair Value GapEthereum is showing early bullish signals within a broader downtrend, and a pullback toward the $1,700 zone—where it meets the underside fair value gap and 21-day moving average—may set the stage for a higher low and potential trend reversal.
🔹 Entry Zone:
$1,700
🎯 Take Profit Levels:
🥇 $2,000
🥈 $2,200
🥉 $2,400
🛑 Stop Loss:
$1,550 (below structure and invalidation point)

ETHUSDT Soon again Above 2K$The support zone hold price from falling as it was expected:
Now we are looking for more pump here and at least our first target which is 2200$ and if the price pump and get back above the green trendline then market is bullish once again and next Targets like 3K$ is also possible.
DISCLAIMER: ((trade based on your own decision))
<<press like👍 if you enjoy💚

Ethereum (ETH): Sellers Are More Aggressive Than BuyersLooking at candles on the 4-hour timeframe, we are noticing the strong momentums from sellers with big and strong red candles they form after some kind of upward movement (which comes with hard work from buyers).
This kind of dominance is giving us a possible sign of an upcoming bigger selloff so we need to monitor here the 200 EMA, which is acting currently as a support zone. Once we see a 4-hour candle close below that EMA, we will be looking for downside movement!
Swallow Academy

ETH ANALYSIS🔮 #ETH Analysis 🚀🚀
💲💲 #ETH is trading between support and resistance area. There is a potential rejection again from its resistance zone and pullback from trendline. If #ETH sustains above major resistance area then we will a bullish move till its major resistance area
💸Current Price -- $1,755
⁉️ What to do?
- We have marked crucial levels in the chart . We can trade according to the chart and make some profits. 🚀💸
#ETH #Cryptocurrency #DYOR

Long trade
15min TF overview
ETHUSDT (Buy Side)
🗓 Date: Monday, 5th May 2025
⏰ Time: 2:30 AM
📍 Session: Tokyo AM
Pair: ETH/USDT
📈 Direction: Long (Buy Side)
Entry Details:
Entry Price: 1816.49
Take Profit: 1834.51 (+0.99%)
Stop Loss: 1814.37 (−0.12%)
Risk-Reward Ratio: 8.5
🔹 Trade Reasoning:
📌 Observed consistent buyside pressure building
📌 Price respected FVG
📌 Upside target: Asian High liquidity anticipating a sweep or range expansion.


Ethereum Prepares for Major Pectra UpgradeEthereum—the second-largest cryptocurrency by market capitalization—is set to undergo a major upgrade in May 2025, known as “Pectra.” This update promises to significantly improve scalability, performance, and user experience. But what exactly does it entail?
Pectra follows the groundbreaking "Merge" event of 2022, which shifted Ethereum from proof-of-work to proof-of-stake consensus. With that transition complete, developers have now turned their focus to making the network faster, cheaper, and more user-friendly.
The upgrade includes several Ethereum Improvement Proposals (EIPs), targeting transaction processing, wallet functionality, and validator operations. Some key highlights are improvements in staking, partial withdrawals, adaptive fee structures, and better client compatibility.
Most notably, Pectra enhances staking mechanics, allowing validators to partially withdraw funds—something that was previously restricted. This change is expected to attract more participants to Ethereum’s staking ecosystem.
Transaction efficiency is also a central focus. The upgrade aims to reduce network congestion and lower gas fees, which have long been a pain point for users of decentralized finance (DeFi) platforms and NFT marketplaces.
Investor sentiment is cautiously optimistic. Though ETH price action remains relatively stable, trading volumes have increased as traders position themselves ahead of the upgrade. Analysts suggest that a successful implementation could trigger a rally in Ethereum’s price, especially if the changes deliver on promised performance gains.
Ethereum continues to dominate the smart contract space despite increasing competition from blockchains like Solana and Avalanche. Pectra could further solidify Ethereum’s lead, especially if it improves network speed and lowers costs without compromising decentralization.
This upgrade isn’t just a technical patch—it’s a strategic move to future-proof the Ethereum ecosystem in the Web3 era. With Pectra, Ethereum reinforces its role as the foundational infrastructure for decentralized applications.

#ETHUSDT: Price to Touch All Time High $4500 By End Of YearETHUSDT has hit lowest point and we might see a price reversal towards $4500, which would be an all-time high. There are three potential targets for the price to reach.
Good luck and trade safely!
Best regards,
Team Setupsfx_
We’d love for you to support and encourage us!
- Like our ideas
- Share your thoughts
- Share our work if it helps

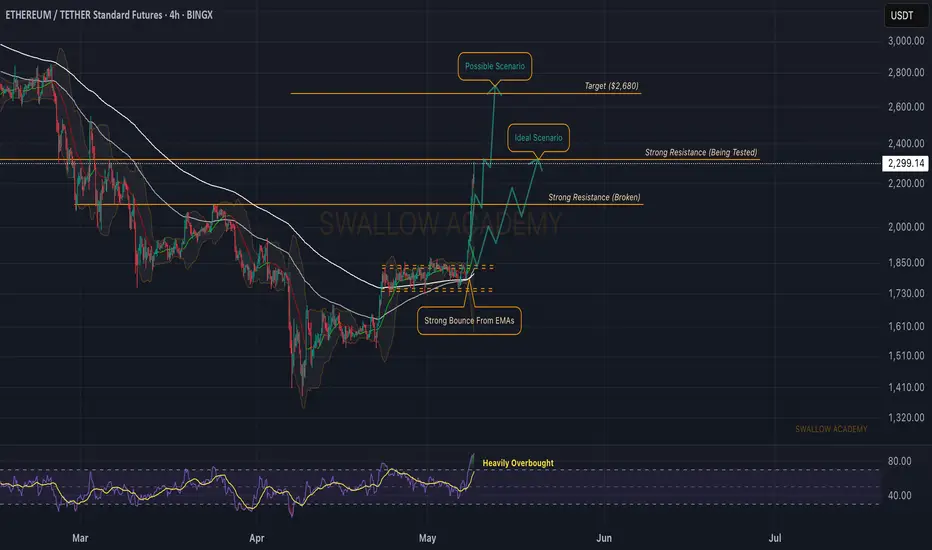
Ethereum (ETH): Targeting $2,700 | Strong Bull MovementEthereum is finally shining after such a hard time we had on it. The price is breaking new highs and is not showing any remorse to sellers.
Despite us looking for upward movement, we have to be careful of any quick downward correctional movement or candles so if you hold a long position on ETH, set your last targets to $2,700, while if you are looking to enter, do not enter with big leverage (due to big liquidity hunting that might happen).
RSI is overbought so that's what we will be looking at as well
Swallow Academy
ETH Bulls Waking Up – But Can They Break This One Last Barrier ?Hello Traders 🐺
As the old man said: "Those who survive the dump, deserve the pump." 😂😉
I hope you're doing well — and if you're still here after the last few weeks, you're already ahead of the crowd.
Let’s break down the current ETH situation and see why this could be the beginning of a major shift:
🔹 Daily Chart Overview :
ETH is testing the top of a descending channel. If we see a breakout here, the road toward $2100 is wide open — that’s a +23% move and could signal the start of a full trend reversal toward $4000.
But why am I so confident? Let's dive deeper:
🔹 Market Sentiment & On-Chain Signals
ETH is heavily oversold
Fear & Greed Index is at extreme fear
Altseason Index near historic lows
ETH/BTC is sitting on long-term support
🔹 ETH/BTC Monthly Chart:
ETH is at a key monthly demand zone against BTC. Historically, this area has triggered ETH dominance and massive altcoin rallies.
🔹 BTC.D vs ETH:
BTC Dominance (BTC.D) is showing signs of topping out at key resistance, while ETH/BTC is forming a bullish divergence — a classic setup for rotation from BTC to ETH and altcoins.
🟢 Weekly ETH Chart ETH is sitting right on a major support zone. This is where reversals begin. If it holds, this could be the last dip before a major breakout.
💬 Final Thought:
Let me know your thoughts in the comments. Are you loading ETH or still waiting for confirmation?
And as always:
🐺 Discipline is rarely enjoyable, but almost always profitable 🐺
🐺 KIU_COIN 🐺

possible short entry reversal point!Levels to keep an eye on for BOS for a high possibility short entry. In order to reach the higher levels a ABC structure is vital. looking for trendline break for confirmation.

$ETH Bullish!CRYPTOCAP:ETH continues to hold strong at support — a breakout is likely.
Target remains at $2,000.
This is the 6th attempt to break the same resistance zone — remember, every touch weakens it.
We still have higher lows plus bullish divergence forms on the oscillator. (bias - BULLISH!)
ETH Rejects from 0.618 Fibonacci — $1,540 in Sight?Ethereum has rejected from a key resistance cluster around the 0.618 Fibonacci level. With price slipping below the point of control, downside continuation toward $1,540 looks increasingly probable — unless bulls step in soon.
Key Highlights:
Confluence Resistance Zone: 0.618 Fib, daily resistance, and descending VWAP capped recent price action.
POC Lost: The local point of control has broken down, showing sellers are dominating the short-term range.
Lower Structure Forming: Ethereum is setting lower highs, with $1,540 as the next key support and potential draw for price.
Full Analysis:
ETH/USD has stalled under a strong resistance zone combining the 0.618 Fibonacci retracement, daily structure, and a descending VWAP from the prior lower high. After multiple failed attempts to break higher, price is rolling over — and has now lost the local volume point of control (POC).
This breakdown suggests that value is no longer being accepted at this level, and we may see a rotation lower. Ethereum is also forming a short-term bearish structure — with lower highs and weak attempts at reclaiming lost levels. The next key support sits at $1,540, which also aligns with unfilled inefficiencies and resting liquidity from previous upside moves.
If ETH loses the recent swing low, a move toward $1,540 becomes increasingly likely. However, a reclaim of the POC could indicate this is just a fakeout before buyers attempt another breakout.
What to Watch Next:
Hold above current swing low = potential bounce.
Break below = opens path to $1,540.
Reclaim of POC = short-term bullish invalidation.

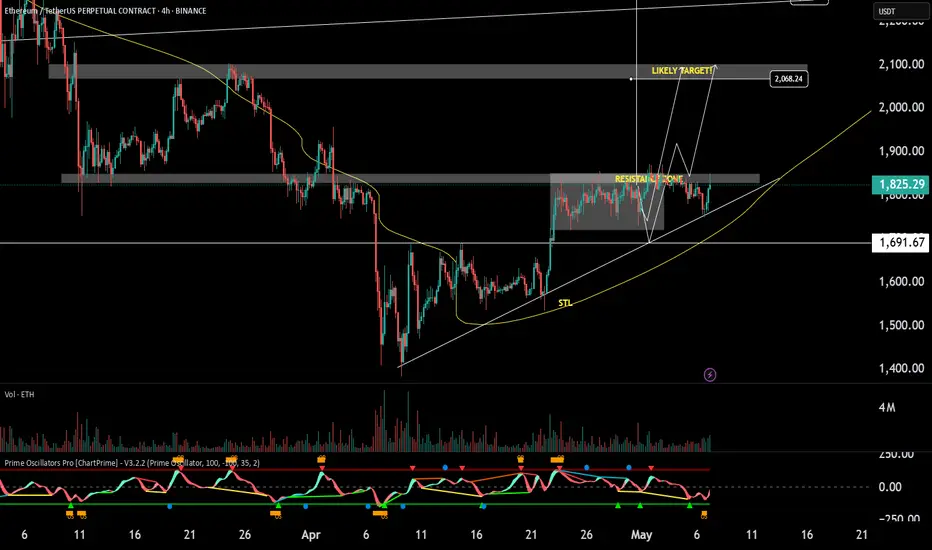
ETH/USDT ETH/USDT 4-hour chart
Price is currently just above the 200 EMA, which often acts as dynamic support.
ETH has been consolidating around this level neither showing strong bullish breakout nor bearish breakdown.
The price is ranging sideways in a relatively tight band, showing a lack of strong momentum either way.
There’s no clear higher high or lower low — a neutral/balanced market phase.
Recent candles show wicks on both ends, indicating indecision and equal pressure from buyers and sellers.
As long as price holds above the 200 EMA (~$1780), bulls maintain slight control.
If ETH breaks and closes below the 200 EMA, it may open a path toward lower support zones (~$1740, $1700).
To regain bullish momentum, ETH need to break and hold above ~$1840–$1860, the recent local highs.
Looking for breakout with strong momentum, watch for massive volume candle.
stay strong and take care.

Ethereum (ETH/USDT) Trading Analysis: Bullish Momentum AheadEthereum (ETH/USDT) Trading Analysis: Bullish Momentum Ahead
1. Trend Overview
ETH/USDT is displaying a strong bullish trend, with recent upward price action marked by consecutive green candlesticks. The current price of 1,833.02 USDT reinforces bullish momentum, suggesting sustained buying pressure.
2. Key Levels
Support: The 200-period moving average (green line) acts as dynamic support, offering a potential entry point on pullbacks.
Resistance: Immediate resistance lies near recent highs. A breakout above this zone could trigger further upside. Bollinger Bands highlight volatility, with the upper band signaling potential resistance.
3. Technical Indicators
MACD: Bullish momentum is confirmed, with the MACD histogram in positive territory.
RSI: At 45, the RSI indicates neutral conditions—no overbought or oversold signals—leaving room for upward movement.
4. Trade Setup
Entry: Enter long at 1,840 USDT (above current price) to confirm trend continuation.
Stop-Loss: Set at 1,800 USDT (below the 200 MA) to limit downside risk.
Take-Profit: Target 1,900 USDT (short-term) and 2,000 USDT (mid-term)**—a 3-9% return potential.
Final Summary
Asset: ETH/USDT
Bias: Strong Buy
Entry: 1,840 USDT
Stop-Loss: 1,800 USDT
Take-Profit: 1,900 / 2,000 USDT
Confidence: High
Pro Tips:
Monitor Bollinger Band width for volatility shifts.
Watch for reversal patterns (e.g., bearish engulfing candles) near resistance.
Why This Matters: Ethereum’s bullish structure, backed by technical confirmation, offers a high-probability trade. With clear risk-reward parameters and untapped upside, this setup is ideal for trend followers.
Ready to capitalize? Let me know if you need real-time updates or adjustments! 🚀

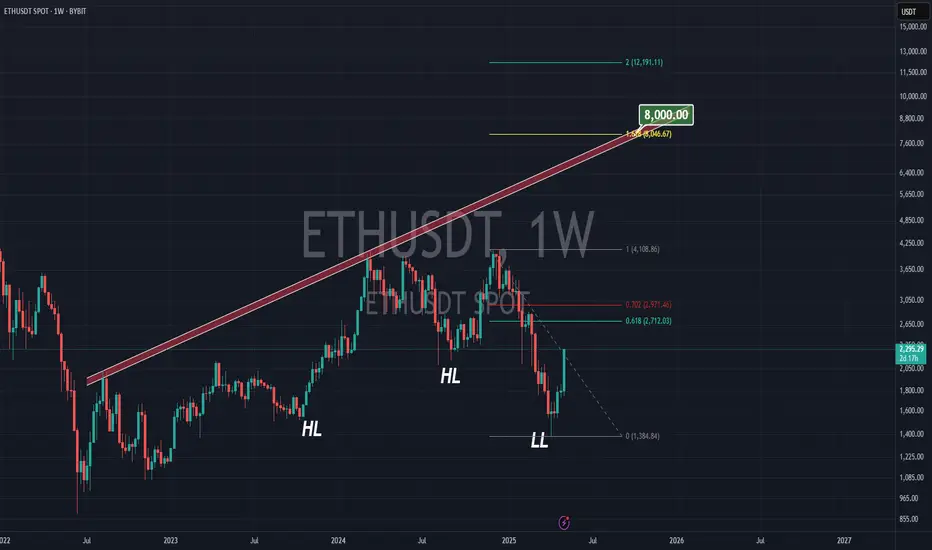
ETHEREUM TO $8000According to the previous tops we have for Ethereum on big time frames, we have a strong & long-term trend-line which gives us $7000 in summer and $8000 in October time.
On the other hand the 161.8% Fibonacci from the previous top the bottom we just saw (about $1500 ) is at $8000 .
Is this a coincident?! I don't think so
ETH TO OUTPERFORM?Ethereum printed a textbook bullish reversal candle on the monthly chart - a strong signal that buyers may finally be stepping in with conviction. After a prolonged downtrend and a brutal April close below the 50-month moving average, this kind of recovery is exactly what bulls were hoping for.
The candle itself is notable: a long lower wick and a solid body closing near the highs of the month, which indicates strong demand at lower prices and rejection of further downside. This type of price action at support often marks a key inflection point in market structure.
It’s still early in the month, but this bounce from the ~$1,600 zone, paired with the potential reclaim of the 50-month moving average, could set the stage for a sustained move higher - especially if macro tailwinds return or sentiment improves across the broader market.
Momentum has been weak for months, and ETH has severely underperformed BTC. But reversals don’t start with euphoria - they begin when few are paying attention, and this chart is quietly showing signs of life.

ETH Summer BearishA potential path for ETH before resuming a bullish major trend, is drawn with a purple arrow.
I don't think the FED will cut rates today. In fact, maybe in September. Maybe. If the FED cut rates, then the target scenario (green box in the chart) would not play out, we would shift to a bullish movement. I wish for that, but I don't think is near yet.
That being said, the current potential risk, I calculated it to -30% from current levels. Exact prices are impossible to predict, rather I focus on target areas.
DISCLAIMER:
Do Your Own Research, don't use mine to invest! This is not a financial advice, it is only a mere opinion of mine. I own several cryptocurrencies, including ETH.

ETH to $2100 Looks like the bulls are starting to dominate again, traders! Ethereum has started to rise, Lips crossed the Jaw on Alligator, and AO confirms the bullish sentiment. On top is the Order Block, which acts as a magnet for the price.
BINANCE:ETHUSDT

ETHEREUM is getting ready for a major breakout (12H)This analysis is an update of the analysis you see in the "Related publications" section
The red zone represents a supply area based on the Philip strategy. It’s possible that the price might not be able to break through this zone on the first attempt. If the price gets rejected, the lower green box will be a re-entry opportunity for those who missed the move.
Let’s closely monitor this chart and see how it plays out.
A daily candle closing below the invalidation level will invalidate this analysis. invalidation level : 1198$
For risk management, please don't forget stop loss and capital management
When we reach the first target, save some profit and then change the stop to entry
Comment if you have any questions
Thank You

