Ethereum: The biggest Opportunity in 2025!Ethereum is following Bitcoin—but with way worse performance. While BTC is still holding up relatively well, ETH has dropped all the way back to March 2023 levels, wiping out the entire rally. Since its top, Ethereum is down over 63%. 😮💨
Still—or maybe because of that—I’m beginning to slowly scale into spot positions here.
Yes, we could fall further. I’ve got limit orders set lower, specifically around $1,260, which aligns with the 88.2% Fibonacci retracement and the midpoint of the monthly order block. That’s a key zone I’ll be watching if price keeps dropping.
That said, this Wave (2) should be nearing its final stage. The sell-off has been steep, and if we lose $804, that would flip Ethereum’s entire monthly structure bearish—a scenario I’d consider extremely negative.
I don’t expect ETH to suddenly blast past $5,000 from here, but at these levels, I see a clear opportunity to build longer-term spot exposure—and that’s exactly what I’m starting to do now.
ETHBULLUSDT trade ideas

ETH / USDT supporting chart for the BTC pairNow this isnt meant to be a prediction of any kind, rather a supporting chart to the BTC pair i posted already. This is typically how these bottoms would unfold in the case of a broadening bottom, or inverted head and shoulders.
Looking for support above 1754, to reclaim this range, however it doesnt have to come back that far, and i wouldnt want to see it fall back into that deviation zone under1685.
The idea being, the breakdown lower got rejected, and traders are looking for confirmation of support, back inside of the range. If thats achieved, we're going to look for the range high, and the partial decline typically, which is your last sign of strength before the mark up phase.
None of this HAS to happen, just merely larping what ive seen in previous bottoms, including BTCs bear. If we see a change in character here, or a partial rise, with the inability to retest the range high / neckline, then of course, i will restrategize.

ETH Short - Sweep of 12 H HighsETH Short was planned 5 days prior to when it got triggered, main idea is a sweep of the 12 H highs, and a continuation of the bear trend on higher time frames.
We got the sweep, now we wait for the setup to play out.
Ethereum Up 30% — But Is This the Start of a Trend Reversal..?Ethereum Up 30% — But Is This the Start of a Trend Reversal..?
Ethereum has seen a notable bounce this month, climbing approximately 30% from its local bottom of $1,400 to its current level around $1,800. While this rally might appear promising at first glance, a deeper look at the daily timeframe reveals a more cautious picture.
Despite the recent price surge, Ethereum remains technically in a **downtrend**. A well-respected downtrend continues to hold as resistance, and ETH is currently **retesting this trendline**. This point of contact now sets the stage for two potential scenarios:
**Scenario 1: Rejection from the Trendline**
If Ethereum fails to break above the trendline, it’s likely to face **rejection**, which could send the price back toward the $1,400 level. A revisit to this support zone would form a **potential double bottom**, a classic reversal pattern. If that plays out, we could then start to look for signs of a genuine trend reversal.
**Scenario 2: Breakout Above the Trendline**
On the other hand, if ETH manages to **break through the trendline**, that alone shouldn't be a green light to go long just yet. There’s a significant resistance level sitting around **$2,100**, which has previously acted as a ceiling for price action. A true breakout would require Ethereum not only to cross this level but also to **sustain above it for 2–3 days**. Only then could a long position be considered relatively safer, with upside targets extending to **$2,800** and even **$4,000**.
**Final Thoughts**
While the recent rally is encouraging, it's essential to remain cautious. The downtrend isn't officially over until key technical levels are cleared and held. Until Ethereum breaks above both the downtrend and the $2,100 resistance zone — and proves its strength with sustained movement — the **best strategy may be to sit on the sidelines** and let the market play out.
Patience often pays in crypto — and right now, **watching closely** could be the smartest move.

Long trade
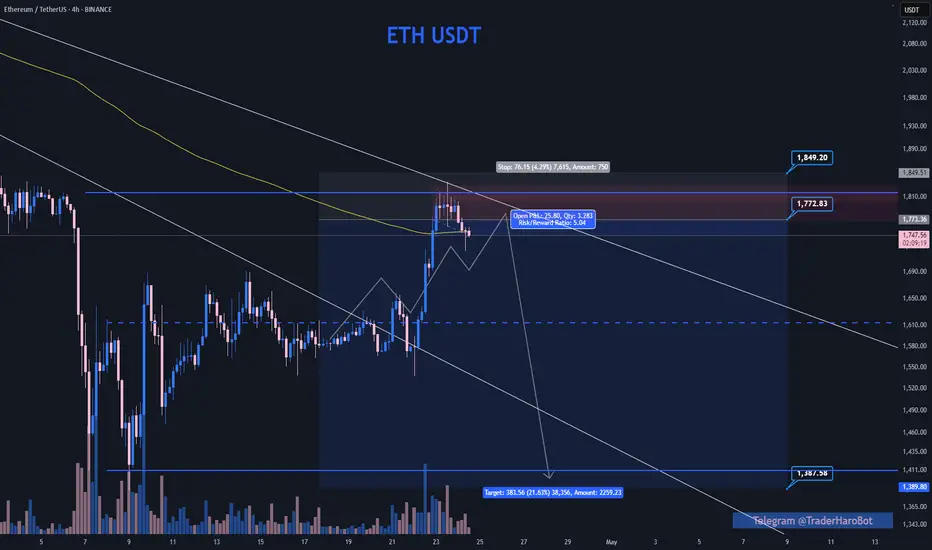
ETHUSDT Buyside Trade – Full Journal
Date/Time: Saturday, 25th April 2025, 7:55 AM NY Time
Pair: ETHUSDT
Session: London AM
Entry TF: 5min
🔹 Entry: 1789.52
🔹 Take Profit: 1826.93 (+2.88%)
🔹 Stop Loss: 1775.30 (–0.42%)
🔹 Risk-Reward Ratio: 5.40
Trade Reasoning
Price showed bullish structure with higher lows forming leading into the London open.

Long trade
Trade Overview: ETHUSD – Long Position
Entry Price: 1778.55
Take Profit (TP1): 1808.63 (+1.68%)
Stop Loss: 1774.44 (–0.23%)
Risk-Reward Ratio (RR): 7.52
🕖 Entry Time: 7:45 AM (New York Time)
📅 Date: Saturday, 26th April 2025
🌍 Session: NY AM
🧭 Entry Timeframe: 1-Hour TF (focused on FVG)
Reasoning Narrative
ETHUSD showed clear bullish intent on the 1-hour timeframe, with price forming a series of higher highs and lows. Leading into the entry, the market had recently filled a fair value gap (FVG) left behind from the prior bullish expansion, signalling a potential continuation setup.
5min TF Overview

Ethereum Eyes Bullish Momentum After Resistance BreakoutUpon a confirmed breakout above the resistance line, Ethereum will be well-positioned for a potential bullish move.

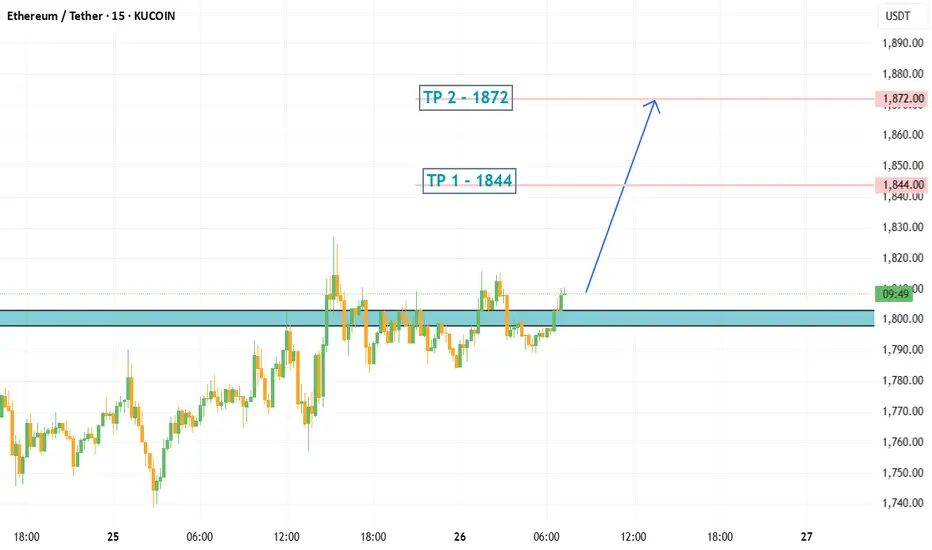
ETH/USDT LONG IDEAPosition opening range 1798~1803 USDT in batches
Total Position Recommendation Within 5% of total funds (or 1~2% of total account loss)
Stop Loss 1784 USDT, liquidate the position when triggered.
Take Profit First Target 1844, Second Target 1872
Cooling-off rule: 24 hours cooling-off after stop loss
Prohibition Prohibition of chasing high, prohibit the increase of positions, prohibit continuous trading
$ETH Breakout – High Probability Move Ethereum has been in a downtrend since December 16, showing consistent lower levels. However, we’re now seeing a confirmed breakout above the trendline, which signals a strong potential reversal.
This breakout suggests a high-probability move to the upside, with price targeting the $4,000 level in the coming period.
Keep watching — the momentum is building.
Follow me for updates and analysis as the setup plays out. BYBIT:ETHUSDT.P

ETH Short is a must DOUBLE TOP on the charteven if not for long, but there is an a double top , so i expect a -7/10%
fib. retracement show it where has to go for a sane going up, as you can see my previwed analysis i have an 88% of profitable trade.
Good luck guys and trade safe, max leverage x10/15

#ETH is hitting a major resistance next target $4000! Here's Why#ETH is back inside the legendary 1,883-day trendline, a massive bullish signal for altcoins.
Meanwhile, BTC Dominance is getting rejected from the top, adding fuel to the altcoin momentum.
But there's one key confirmation still needed before we talk about new ATHs for ETH, BTC, and the broader altcoin market:
The 200-Week EMA.
Currently sitting around $2,237, this level needs to be claimed with a strong weekly close. ETH is trading above it right now, but the next 2 days and 4 hours are crucial.
A confirmed breakout here would signal a major shift in ETH's 200-week momentum a structural change that could trigger the next big leg up.
I believe it’s only a matter of time before ETH closes above this level. Once that happens, the next target for CRYPTOCAP:ETH would be $2980, $3488 and $4000!
What do you think?
Drop your thoughts in the comments and hit the like button if you found this valuable.
#PEACE ✌️

ETH BreakoutDown‑trend break
A sharp, high‑volume candle has punched through the descending trend‑line, giving a clear bullish break of structure.
Resistance → Support flip
The 2 100‑2 150 USDT band that capped price earlier is now a potential support zone. A brief retest that holds would keep the bullish scenario intact.
First objective: 2 500‑2 550 USDT
Liquidity sits there (horizontal line on your chart). It’s a logical partial‑take‑profit area.
Expected pullback
The arrow sketches a throwback toward 2 350‑2 400 USDT to form a higher low after the breakout.
Second objective: 2 800‑3 000 USDT
3 000 is a psychological level and aligns with a higher supply zone. If that breaks, the broader 3 300‑3 600 USDT grey box comes into play.
Invalidation
A 4‑hour close back under ~2 100 USDT or a move below the broken trend‑line would kill the bullish thesis.
The arrow shows a classic breakout → retest → continuation roadmap. As long as ~2 100 USDT holds, it’s a reasonable bullish path—but keep tight risk management in case the retest fails.

$ETH just woke up. +30% in 2 days. Straight through resistance.Ethereum just woke up.
+30% in 2 days. Straight through resistance.
Reclaimed EMAs. Volume explosion.
Next stop? $2.6K+ if this momentum holds. Altcoin rotation may have just started.

ETHUSDT Breakout & Retrace: Watching the $2,200 Buy Zone!Hey Traders,
In today's session, we're keeping a close eye on ETHUSDT for a potential buying opportunity around the $2,200 zone. After trending downward, Ethereum has successfully broken out of its downtrend and is now undergoing a correction. It’s currently approaching a key support/resistance area at $2,200, which could act as a strong retracement level.
As always, trade safe.
Joe

Buy Trade Strategy for ETH: Powering the Future of Web3 and DeFiDescription:
This trading idea centers on ETH (Ethereum), the second-largest cryptocurrency by market cap and the backbone of the decentralized application (dApp) ecosystem. ETH is not just a digital currency, but a programmable blockchain supporting smart contracts, DeFi platforms, NFTs, DAOs, and much more. With the successful transition to Proof of Stake through the Ethereum 2.0 upgrade, the network has significantly improved its scalability and energy efficiency, reinforcing its long-term viability. Institutional interest, widespread developer activity, and real-world utility make ETH a cornerstone asset in the blockchain space, especially as Web3 adoption accelerates globally.
Despite its strong fundamentals, the crypto market remains highly volatile and susceptible to macroeconomic trends, technological developments, and regulatory changes. Therefore, even well-established assets like ETH carry risks that investors should carefully consider.
Disclaimer:
This trading idea is provided for educational purposes only and does not constitute financial advice. Trading or investing in cryptocurrencies like ETH involves substantial risk, including the potential for complete loss of capital. Always conduct your own research, evaluate your financial situation, and consult a licensed financial advisor before making investment decisions. Past performance is not indicative of future results.

After a 37% Surge, Is Ethereum Still a Buy...?Ethereum Breaks Key Resistance, Signaling Potential Trend Reversal
Ethereum has delivered two significant technical signals indicating a potential trend reversal. The first is a breakout above the longstanding downtrend line, and the second is the breach of the critical \$2,100 resistance level. These developments suggest growing bullish momentum in the market.
With both confirmation signals in place, Ethereum appears poised for further upside. Traders may now look for a potential pullback or retest around the \$2,100 level, which could serve as a strategic entry point for long positions.
If this level holds as new support, the next target to watch is the \$2,800 mark, aligning with broader market expectations and previous price structure zones.
As always, traders should monitor price action closely and manage risk accordingly in case of volatility around key levels.

ETHUSDT UPDATE I was shared the idea almost weeks ago, now im fullyout of this trade guys,
need your support guyes to share many ideas like that,
comment if you like it.

THE CLEAR SKY OF SHORTS POS by ETH As we considered "IF"
The air will go to the zone, then it will need to enter the zone of the previous range of the structure
Therefore, zone 2324 will be as a decision zone.
The zone's fixation and the impossibility of a disruption will give us the zone 2555-2822
Where would I consider the real work on altas?
That is, a reset...below 2k$.

ETH/USDT – Ascending channel. Breakdown below support?Ethereum - is a smart contract platform that allows developers to build decentralized applications (DApps) on its blockchain.
CoinMarketCap : #2
↗️ Ethereum is moving within an ascending channel, and the bullish trend remains intact.
Inside the channel, there are two triangles.
The first triangle, with a base of 88%, has played out—its third wave broke through the triangle.
Liquidity grabs and shakeouts before the growth in the inner channel zones are marked with yellow circles.
Currently, we see a mirrored situation with a new triangle, this time with a 156% base. However, if this pattern plays out, it will break the ascending channel.
At the moment, the price has been dragged below the channel support, and there is a lot of negative sentiment in the news and opinions. Few believe in an upward move, and many have been liquidated. To me, this looks like a strong trigger.
⤵️The bearish scenario implies a -61% drop. (A less likely scenario.)
I've marked everything on the chart—consider this in your trading strategy. Remember, there's a lot of negativity around Ethereum, just like with all altcoins...
I also believe that on the monthly chart, it will end up being just a wick of the candle.

ETHUSDT should be at the bottom for this cycle
I believe the price of ETH at the current zone is among the lowest and it should be the bottom for this cycle. DR1 structure is prominent here. (Mind you its on the monthly TF!!!! :D)
Can buy ETH now! But for me I prefer to trade - will TP around 23XX - 2400
I will not trade crypto on other coins for now.

ETH/USDT Trading Alert – May 6, 2025, 18:30 UTCKey Signals
Trend: Downtrend (4H chart) showing potential reversal signs.
RSI: 29 (Oversold) → Higher rebound probability.
MACD: Bullish crossover forming near zero line.
Critical Level: Resistance breakout at $1,781.77.
Action Plan
✅ Entry: $1,780.00
✋ Stop-Loss: $1,765.00 (0.8% risk)
🎯 Take-Profit:
TP1: $1,800.00 (1.1% gain)
TP2: $1,820.00 (2.2% gain)
Why Now?
Oversold Bounce: RSI divergence suggests selling exhaustion.
Volume Spike: 18% increase in buy orders at $1,775 support.
Macro Context: ETH futures open interest rising ahead of ETF decision.
Risk Warning
⚠️ Upcoming US CPI data (May 8) may increase volatility. Hedge with 2% portfolio max exposure.
Tools Used: TradingView (Bitget data) + AI pattern detection.

ETH 2025.05.06🔔 Follow SEOVEREIGN to get real-time alerts.
🚀 Your boosts empower SEOVEREIGN to analyze more assets.
📊 Our team regularly publishes detailed crypto market analysis reports.
📊 Ethereum (ETH) Technical Analysis Report
Date: May 5, 2025
■ Summary
Ethereum is currently in a corrective phase, but the broader outlook suggests a continuation of the mid-to-long-term uptrend. Based on wave analysis, the market appears to be in the midst of a Z wave, indicating that a rebound could follow the current short-term pullback.
■ Technical Analysis
The formation of the Z wave suggests we are in the final leg of a complex correction.
Notably, the Y wave has extended to 1.272 times the length of the W wave, which aligns with typical conditions for a technical rebound.
As a result, we may see some short-term downward pressure, but the overall structure still points to a likely upside move in the coming sessions.
■ Target Levels
Target 1: 1,746
Target 2: 1,706
⚠️ Note: Prices are subject to market conditions. Always use proper stop-loss and risk management strategies.

HolderStat | preparing for the May saleThis smart trader withdrew 2.965 CRYPTOCAP:ETH ~$4.9K to Crypto.com—proof this trader is primed to load up on alts. With a lifetime 1832% return over 9 trades this fresh deposit signals full force into the next altcoin rally 🌟
