Ethereum Breakout Targeting $3,705ETH/USD 1H Analysis:
Price broke out of the falling wedge pattern and is showing signs of bullish reversal. Key resistance levels are at $3,581 and $3,647, with a target set at $3,705. Support holds near $3,555. Potential for upward continuation if momentum sustains.
ETHEREUM trade ideas
MTF 2nd bearish macro outlook on Eth, final wave of (Y) coming?This is an idea I've had for a while (unpublished) but looking at local structure, I have to revive this..
It's a very rare expanding triangle idea as the Y wave of the macro WXY wave.
The December 2024 high took out the March 2024 high. And, it's not uncommon, especially in crypto, for B/W wave to take out the previous high (i.e. overshoot). But, considering that the pink a-b-c-d-e's April 2024 low (c) hit the exact 1.618 extension, and the high likelihood of (d) about to hit 4k+ and overshoot the December high of 2024, there is a likelihood that you're seeing an expanding triangle play out.
If you see a rejection at previous December 2024 high (i.e. a swing failure pattern), you must entertain the idea of expanding triangle at the very least.
The unfortunate part is, if this is true, the (e) wave has a huge range, from ~$1400 to $700. The minimum requirement of (e) is to take out the (c) low but can extend to 1.618 at $700.
Will have to see the local structure playout once we get close to (c) or below.
More evidence for expanding triangle is the volume and the open-interest. From March 2024, volume has been steadily increasing (not visible on Bitstamp chart here, but go look at Binance Ethereum chart, for example) and open-interest has been increasing since March 2024, all the while price has kept peaking at ~$4k. For bulls, this should be very concerning as it means the kettle's been boiling hotter and hotter and the pressure's been building up - and long-to-short ratio is still very much positive. A swing failure pattern at (d) and with late longs entering in the market at the peak, it's possible a cascade of liquidation could result in a quick move down to (e).
ETH BREAKOUT IMMINENT?Ethereum is currently trading around $3,726, holding just above key support levels, including the 50-day SMA and the psychological $3,700 zone. Despite a minor pullback, ETH continues to show signs of bullish strength and remains in a healthy uptrend.
Momentum indicators like RSI and volume show signs of recovery, and ETH is forming a bullish continuation pattern near resistance. If Ethereum can break above the $3,820–$3,850 zone, we are likely to see a quick push toward higher levels.
Ethereum is showing solid strength after consolidating above $3,700. The breakout attempt toward $3,850 will be critical. If bulls push through this level with volume confirmation, a move toward $3,900 and then $4000 becomes highly probable.
The market structure is constructive, and the presence of ETF-driven institutional demand adds further bullish pressure. While short-term volatility may create minor pullbacks, the medium-term setup favors upward continuation.
Ethereum - The moment of truth!🔬Ethereum ( CRYPTO:ETHUSD ) trades at a key breakout level:
🔎Analysis summary:
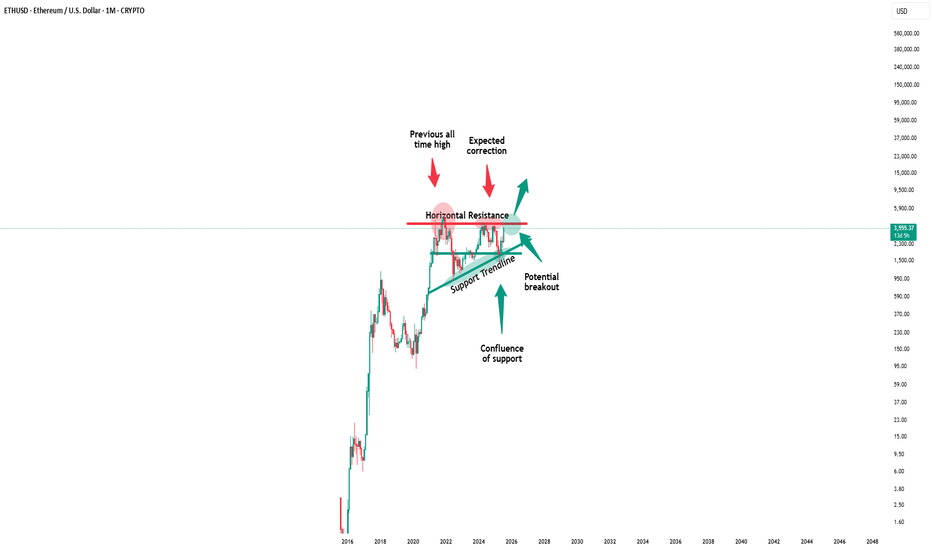
Ethereum - after consolidating for the past four years - is once again retesting the previous all time high. And before we will witness another bearish rejection, Ethereum has the chance to finally break out of the long term triangle pattern. It's time for us to start praying.
📝Levels to watch:
$4.000
SwingTraderPhil
SwingTrading.Simplified. | Investing.Simplified. | #LONGTERMVISION
ETHEREUM (ETHUSD): Strong Bullish SignalsI spotted 2 important price action confirmations on 📈ETHEREUM:
The price has surpassed a resistance line of a bullish flag and established a confirmed change of character (CHoCH) on the 4-hour chart.
I believe the market will maintain a bullish trend, with the next resistance at the 4000 level.
Ethereum - Finally new all time highs!🔬Ethereum ( CRYPTO:ETHUSD ) will break out now:
🔎Analysis summary:
For more than four years, Ethereum has overall been moving sideways. However now Ethereum is once again retesting previous all time highs and preparing a bullish breakout. Multiple retests are generally considered bullish so the breakout is very likely to happen any time soon.
📝Levels to watch:
$4.000
🙏🏻#LONGTERMVISION
SwingTraderPhil
ETH Tactical Long: Laddered Bounce from Absorption ZoneCOINBASE:ETHUSD has been in a steady 1H downtrend, but key support at $3,440 is showing signs of absorption. Volume is thinning on sell-offs, and we're seeing early reversion signals.
This is my over the weekend analysis, not a final recommendation.
Setup Type: Mean Reversion / Absorption Bounce
- Trend: Still bearish on 1H (below 50/100/150 MAs), but slope compression hints at weakening
momentum
- RVI: Below 50, but curling up → early bounce bias
- Volume: Sellers fading into $3,440 = buyer absorption zone
📊 1hr Quant Entry Levels & Laddered Plan
Zone Type Action
$3,440–3,435 Primary Entry Base long entry zone 🔄
$3,420–3,410 Add-on Entry Optional bid stack 🧱
$3,320 Soft Invalidation Trend continuation if lost 🚫
$3,150 Deep Value Wick Low-prob, high-juice trap 💎
🎯 Targets:
T1: $3,515 → EMA cluster rejection zone
T2: $3,600–3,638 → Range midpoint
T3: $3,800 → Trend reversal if reclaimed
⚖️ Risk/Reward: 1:2.5+ (depends on fill ladder)
We are starting entries here, but be cautious if we break through our support levels and you don't have the appetite for the deep value range it may be wiser to wait for a confirming trend or post.
Eth - An aticipated path of continued downward price actionThis is just a thought eperiment based on years of watching patterns repeat.
I like to anticipate price action so I know if/when my trading ideas are being invalidated.
Regardless of the actual path downward, I'm still holding out for $3K or less.
May the trends be with you.
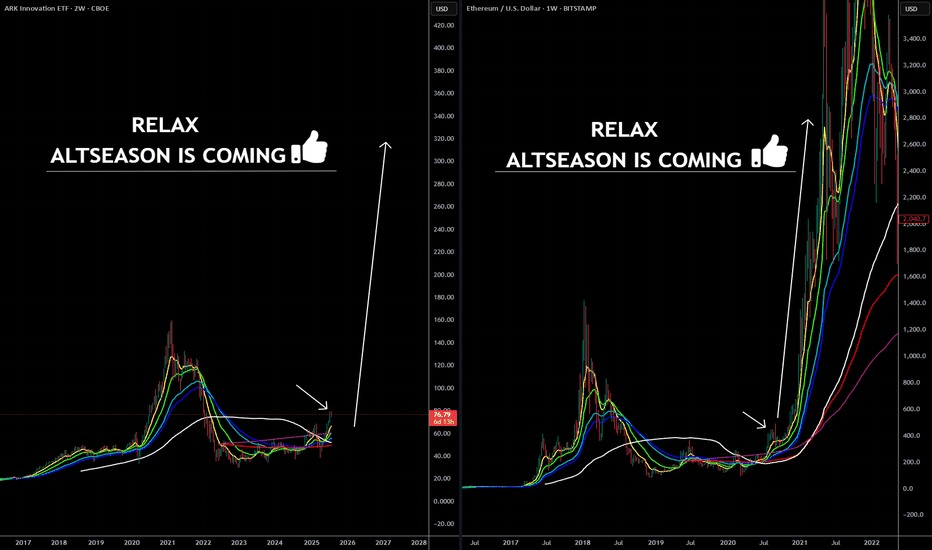
ARKK: The Calm Before the Innovation Storm -ALTSEASON Is COMING🚀 ARKK: The Calm Before the Innovation Storm 🌪️
The markets are shifting, and disruption is about to go vertical. ARK Innovation ETF (ARKK) is quietly positioning itself for what could be the most explosive move of this decade. With high-conviction bets in AI, Bitcoin, genomics, and next-gen tech, this isn’t just a fund—it’s a launchpad for exponential growth.
This post breaks down exactly why ARKK could go parabolic—and why the smart money is already moving in. 👇
Explosive upside in 2026
ARKK is already up over 24% YTD , showing strong momentum compared to broader markets and signaling early stages of a potential parabolic move .
High-conviction concentration in game-changers
Top 10 holdings include Tesla, Roku, Zoom, Coinbase, UiPath, Block, Crispr Therapeutics, DraftKings, Shopify, and Exact Sciences. These are leaders in innovation sectors with massive upside potential .
Deep exposure to Bitcoin and digital assets
Heavy allocation to Coinbase and Block gives indirect exposure to Bitcoin . If BTC breaks into a new cycle high , ARKK stands to benefit significantly.
Positioned in exponential growth sectors
Focus on AI, genomics, EVs, fintech, robotics, and blockchain , all of which are entering accelerating adoption phases globally.
Aggressive smart-money accumulation
Cathie Wood’s team continues buying aggressively during dips, reinforcing institutional confidence in the fund’s long-term trajectory.
Technical breakout structures forming
Ascending triangle and multi-month consolidation breakouts suggest a technical setup primed for explosive upside .
Innovation supercycle aligning
ARKK's themes are aligned with major global shifts like de-dollarization, decentralized finance, and AI convergence .
High beta = massive upside leverage
With a beta above 2 , ARKK tends to outperform in bull runs , offering leveraged exposure to innovation without the need for margin.
Resurgence of top holdings
Names like Coinbase, Tesla, Shopify, and Roku are up 50%–100% YTD , driving ARKK’s NAV growth and fueling bullish sentiment .
Long-term vision with short-term catalysts
The fund projects 5x returns over the next five years , while Bitcoin halving cycles, tech innovation, and regulatory clarity serve as short-term ignition points .
Marty Boots | 17-Year Trader — smash that 👍👍, hit LIKE & SUBSCRIBE, and share your views in the comments below so we can make better trades & grow together!
ETH Broadening Wedge Formation !BINANCE:ETHUSDT is forming a broadening wedge pattern on the weekly chart, a structure that often signals high volatility and strong momentum once the price breaks out. This setup is reminiscent of ETH’s 2019–2020 pattern, which also formed as a broadening wedge before breaking to the upside and triggering a historic rally to new all-time highs.
Currently, ETH is pressing against the upper resistance line of the wedge near the $3,900–$4100 zone, a level that has acted as major resistance multiple times in recent months. A decisive breakout above this barrier could ignite strong bullish momentum, opening the path toward the $6,000–$10,000 range.
Cheers
Hexa
ETH LongETH pulled back to .5 fib on daily which is also near the EMA20 and max pain for long (3,553). I'm expect price to move up from here or dip to the .618 level at the most (~3,500).
Trade: Using ETHU (2x lev ETF). Setting stop loss just below 3,500. Initial TP 3,825 and will use a trailing stop to lock profit in along the way. Ideally, I will let this trade run to $4-6k range if the momentum is strong.
Ethereum Ready for New All Time HighEthereum's protracted consolidation between $2,000 and $4,000 over the past four years appears to be reaching a critical juncture. This extended period of sideways movement has built significant potential energy, suggesting that the market is coiling for a substantial breakout. Technical indicators are hinting at an imminent end to this consolidation phase, with increasing bullish momentum. Should Ethereum decisively break through key resistance levels, a rapid ascent towards the $10,000 mark by the end of the year becomes a distinct possibility. The duration of this consolidation underscores the magnitude of the anticipated move, making Ethereum a key asset to watch for substantial gains.
Anticipation is building for a potential surge towards the $10,000 mark by the end of the year. Several factors underpin this bullish outlook, including increasing institutional interest, the ongoing development and adoption of Ethereum's Layer-2 scaling solutions, and the continued growth of the decentralized finance (DeFi) ecosystem. The upcoming Fusaka upgrade, expected in late 2025, which aims to significantly reduce Layer-2 costs through Peer Data Availability Sampling (PeerDAS), is also contributing to optimistic price predictions. If Ethereum can maintain its current momentum and break through key resistance levels, the $10,000 target remains a distinct possibility.
ETH Is Testing a 500+ Day Resistance Wall at $4,000Ethereum has now made its 4th attempt to break above the $4K level, a price ceiling that has held strong for over 518 days.
🔴 3 clear rejections in the past
🟠 Current price is knocking again
📈 Breakout Zone: ~$4,000–$4,200
⚠️ Rejection Zone: Keep an eye on close of weekly candle
This is a major technical level. If ETH can break and hold above, it could open the door to new price discovery. If rejected again, expect volatility and possibly a pullback into lower range support.
🧠 Chart is for educational use only. Not financial advice.
ETH is at a turning point — What would you do?Hey traders, how's everything going with you?!
The price has been increasing for days, but now it’s slowing down. From here, ETH can either:
🟢 Go higher and continue the uptrend
🔴 Or drop and start a pullback
This is a key moment. Some traders are preparing to buy the breakout, others are waiting to sell the drop, and some are watching for more clues.
👉 If this were your chart, would you do:
Buy?
Sell?
Wait?
Comment below and let’s learn from each other 👇. I would also appreciate it if you could hit the boost and follow!
Have a great day, everyone!
-Neo


