ETHUSD FORMED A BEARISH WEDGE. READY TO REVERSE?ETHUSD FORMED A BEARISH WEDGE. READY TO REVERSE?📉
ETHUSD has been moving bullish since July 9, forming the bearish wedge, supported by the bearish divergence. Today the price started to breakdown this pattern.
A bearish wedge is a bearish reversal pattern in an uptrend, where the price forms higher highs and higher lows within converging upward trendlines, signaling weakening bullish momentum and a potential downward reversal. To trade, identify the wedge with declining volume and confirm with RSI or divergence. Sell or short on a breakdown below the lower trendline with a volume spike. Set a stop-loss above the recent high or upper trendline. Target the wedge’s height projected downward from the breakdown or the next support level with a 1:2 risk-reward ratio.
The decline towards local support of 3,500.00 is highly expected. If the bearish impulse gets strong enough, we may see the decline towards 3,000.00 support level.
ETHEREUM trade ideas

Ethereum to $8000On the monthly chart, Ethereum has reached major resistance at $3,800 again and, in my opinion, can break through this time. This is the final leg to $8,000 soon.

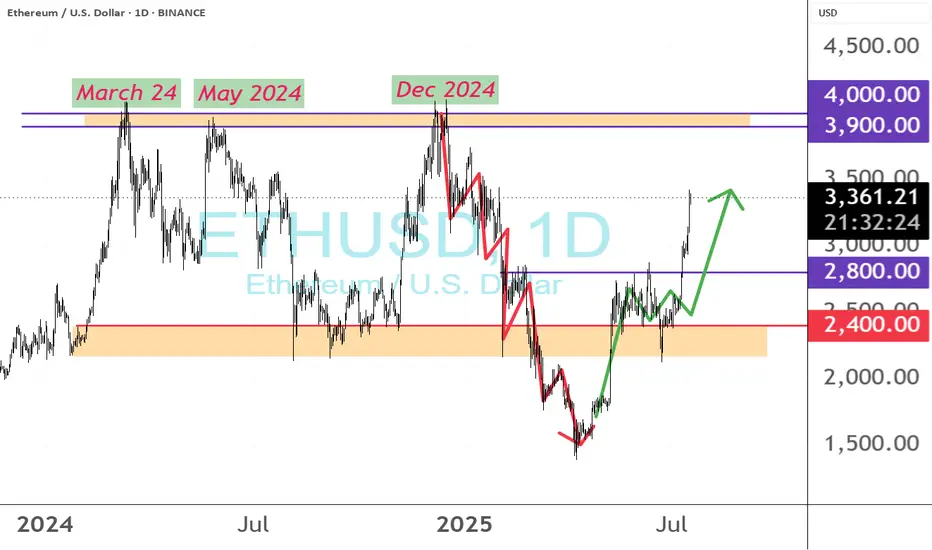
Ethereum Bullish Rally IncomingIf Ethereum can break above that point and clear $2,840, this level will turn into a major support, where fresh supply waits. However, a drop below the 200-EMA could lead the price to retest $2,400. A break below this level would shift momentum negative and risk a slide toward the April low near $1,500.
Read More at: www.cointrust.com

$Ethereum / USD 4H AnalysisMARKETSCOM:ETHEREUM / USD 4H Analysis
ETH has shown a massive rally of +82.5%, climbing from the $1,900 area to a local high of ~$3,670.
🔑 Key Levels & Zones:
🔹 Resistance Zone:
~$3,750–$3,800 Price is reacting here after a strong bullish move. Potential local top if no breakout follows.
🔹 First Demand Zone:
~$3,500 Nearest 4H demand zone. A possible area for a short-term bounce or continuation if price retraces.
🔹 Mid-Level Demand Zone:
~$2,950 Previous consolidation zone, now flipped into support. Stronger structure here.
🔹 Deep Support Zone:
~$2,530 Major support in case of a deep correction. Confluence with previous breakout zone and unfilled demand.
🧠 After an 82% run, ETH might enter a short-term distribution or pullback phase. Eyes on how it reacts around $3,500. If that level holds continuation possible. If not expect deeper retracement.

ETHUSD - Decision TimeWhat do make of the current situation?
What if you are long?
Here's what to expect:
a) support at the U-MLH, further advancing up to the WL
b) open & close within the Fork. If so, there's a 95% Chance of price dumping down to the Centerline.
Taking 50% off the table is never bad.
50% money in the pocket if price falls down to the Centerline.
Or if it advances up to the WL, you still have 50% that generates profits.
Either way, you have a winner on your hands.
Don't let it dig into a Looser!

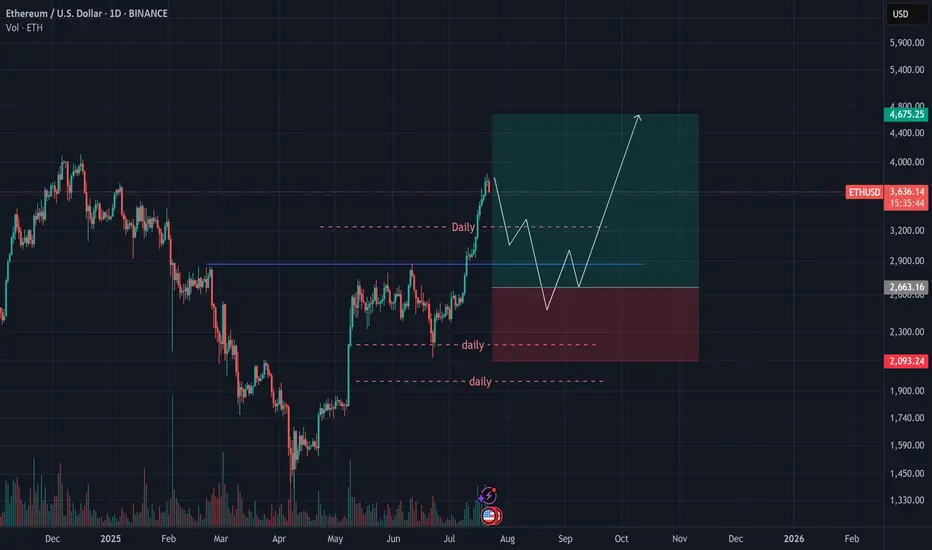
Ethereum (ETH) Analysis – July 21, 2025Ethereum has decisively broken through the key $3,000 level, pushing toward $4,000 with strong bullish momentum.
📉 While a short-term correction is likely in the coming weeks, ETH — much like Bitcoin — tends to attract increased investor interest with each dip.
As such, a continued rally toward $5,000 by the end of September remains well within reach, given the current structure and sentiment.
✅ Personally, I’m waiting for a pullback to around $2,700 as a more optimal re-entry point.
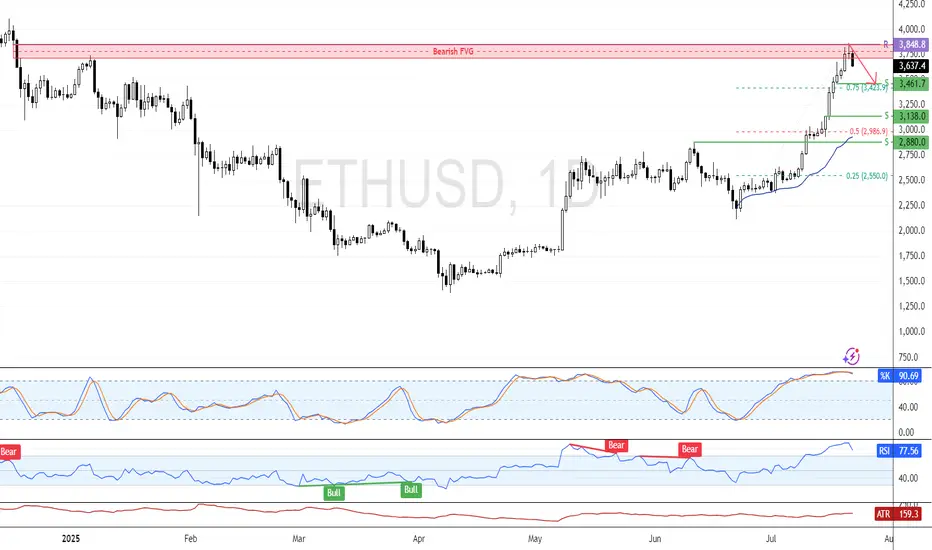
ETH Eyes Consolidation from Overbought ZoneFenzoFx—Ethereum pulled back from the daily bearish FVG. The recent candle closed with a long wick and flat body, reflecting market uncertainty. Momentum indicators remain in overbought territory, signaling a possible consolidation phase.
If resistance at $3,848.0 holds, the price may decline toward support at $3,461. However, the bullish outlook stays valid as long as ETH/USD holds above $3,848.0.

ETHUSD – Cracked at the TopETH broke sharply below $3,750 and sliced beneath the 200 SMA with strong volume. RSI slipped to ~41 and remains suppressed. Price tested the $3,655 demand zone and bounced slightly, but bulls are clearly losing grip. Any bounce below $3,730 is suspect for continuation shorts.
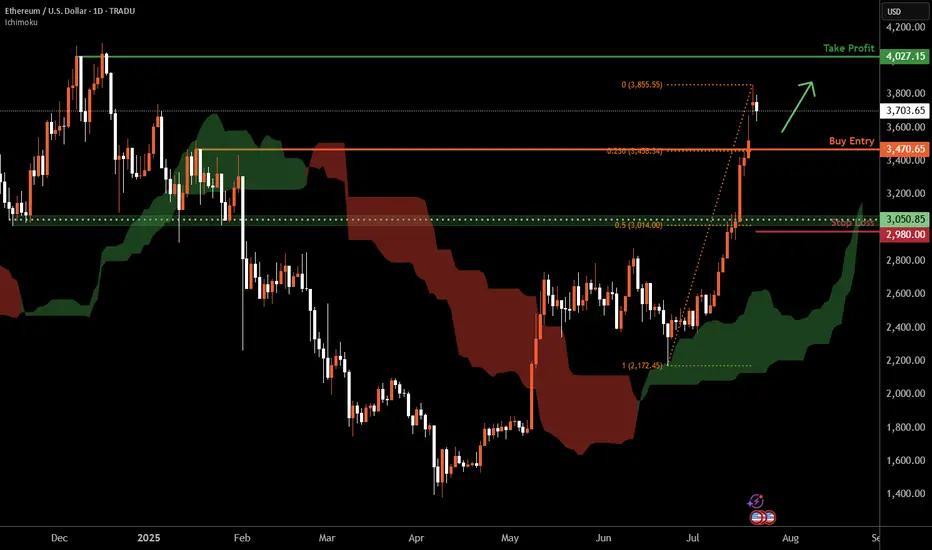
Ethereum D1 | Potential bullish bounceEthereum (ETH/USD) is falling towards a pullback support and could potentially bounce off this level to climb higher.
Buy entry is at 3,470.65 which is a pullback support that aligns with the 23.6% Fibonacci retracement.
Stop loss is at 2,980.00 which is a level that lies underneath a a pullback support and the 50% Fibonacci retracement.
Take profit is at 4,027.15 which is a multi-swing-high resistance.
High Risk Investment Warning
Trading Forex/CFDs on margin carries a high level of risk and may not be suitable for all investors. Leverage can work against you.
Stratos Markets Limited (tradu.com ):
CFDs are complex instruments and come with a high risk of losing money rapidly due to leverage. 66% of retail investor accounts lose money when trading CFDs with this provider. You should consider whether you understand how CFDs work and whether you can afford to take the high risk of losing your money.
Stratos Europe Ltd (tradu.com ):
CFDs are complex instruments and come with a high risk of losing money rapidly due to leverage. 66% of retail investor accounts lose money when trading CFDs with this provider. You should consider whether you understand how CFDs work and whether you can afford to take the high risk of losing your money.
Stratos Global LLC (tradu.com ):
Losses can exceed deposits.
Please be advised that the information presented on TradingView is provided to Tradu (‘Company’, ‘we’) by a third-party provider (‘TFA Global Pte Ltd’). Please be reminded that you are solely responsible for the trading decisions on your account. There is a very high degree of risk involved in trading. Any information and/or content is intended entirely for research, educational and informational purposes only and does not constitute investment or consultation advice or investment strategy. The information is not tailored to the investment needs of any specific person and therefore does not involve a consideration of any of the investment objectives, financial situation or needs of any viewer that may receive it. Kindly also note that past performance is not a reliable indicator of future results. Actual results may differ materially from those anticipated in forward-looking or past performance statements. We assume no liability as to the accuracy or completeness of any of the information and/or content provided herein and the Company cannot be held responsible for any omission, mistake nor for any loss or damage including without limitation to any loss of profit which may arise from reliance on any information supplied by TFA Global Pte Ltd.
The speaker(s) is neither an employee, agent nor representative of Tradu and is therefore acting independently. The opinions given are their own, constitute general market commentary, and do not constitute the opinion or advice of Tradu or any form of personal or investment advice. Tradu neither endorses nor guarantees offerings of third-party speakers, nor is Tradu responsible for the content, veracity or opinions of third-party speakers, presenters or participants.
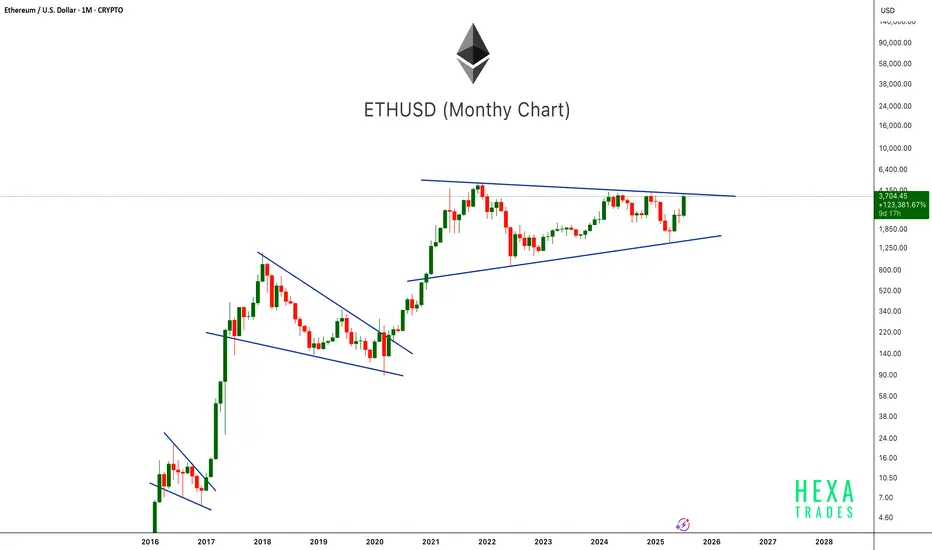
ETH Ready to Pop!ETHUSD is once again testing the upper boundary of a long-term symmetrical triangle on the monthly chart. This pattern has been forming since the 2021 peak, showing consistently higher lows and lower highs. Previous breakouts from similar consolidation patterns (2017 and 2020) led to massive rallies. With the current monthly candle showing strong bullish momentum, a confirmed breakout above this structure could mark the beginning of Ethereum's next major bull run. Keep an eye on the breakout level for confirmation.
Cheers
Hexa
ETHEREUM Resistance Ahead! Sell!
Hello,Traders!
ETHEREUM is trading in a strong
Uptrend and the coin has grown
By more than 70% since the last low
So the coin is locally overbought
And after it retest the horizontal
Resistance of 4100$ we will be
Expecting a local bearish correction
Sell!
Comment and subscribe to help us grow!
Check out other forecasts below too!
Disclosure: I am part of Trade Nation's Influencer program and receive a monthly fee for using their TradingView charts in my analysis.

ETH $3,900–$4,000 Major Resistance: Can This Rally CLEAR $4,000?#ETH $3,900–$4,000 is still a very major resistance for ETH, having been tested in March, June, and December 2024… all without success. Let’s see if this rally is able to CLEAR the $4,000 level?

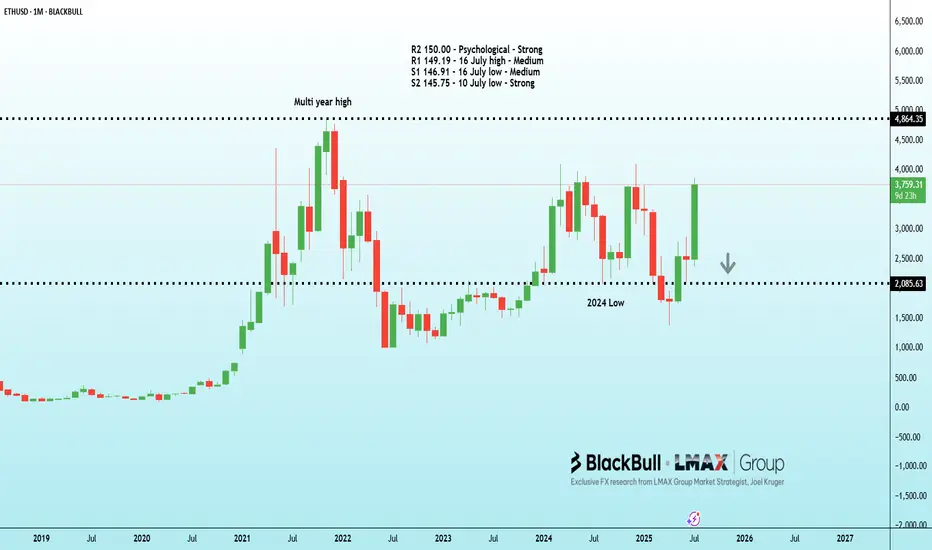
Dollar softens, Yen soars on BOJ normalization bets | FX ResearcThe US dollar got off to a soft start to the week, though thinner summer trading conditions have restrained activity across G10 and emerging markets. The Japanese yen stole the spotlight in G10 after the Ishiba coalition lost its upper house majority, fueling speculation about potential Bank of Japan policy normalization and political instability, which likely drove yen demand.
Meanwhile, positive market sentiment tied to a possible Trump–Putin meeting was overshadowed by skepticism about the sustainability of equity and Bitcoin rallies, given the sharp rise in US equity futures and bond market trends.
Political pressure on the Federal Reserve is intensifying, with Treasury Secretary Bessant questioning the Fed's credibility while also advocating for US–China trade talks and hinting at tougher terms for Europe. Despite calls from the administration and GOP figures for lower interest rates, the Fed anticipates price increases in August data.
In Canada, the Bank of Canada survey pointed to trade uncertainties and weak demand curbing inflation, with tariffs impacting corporate margins rather than consumers. On the fiscal side, the CBO estimates Trump’s tax cuts will add $3.44 trillion to the US deficit over the next decade—a significant but slightly reduced figure compared to earlier projections.
Exclusive FX research from LMAX Group Market Strategist, Joel Kruger
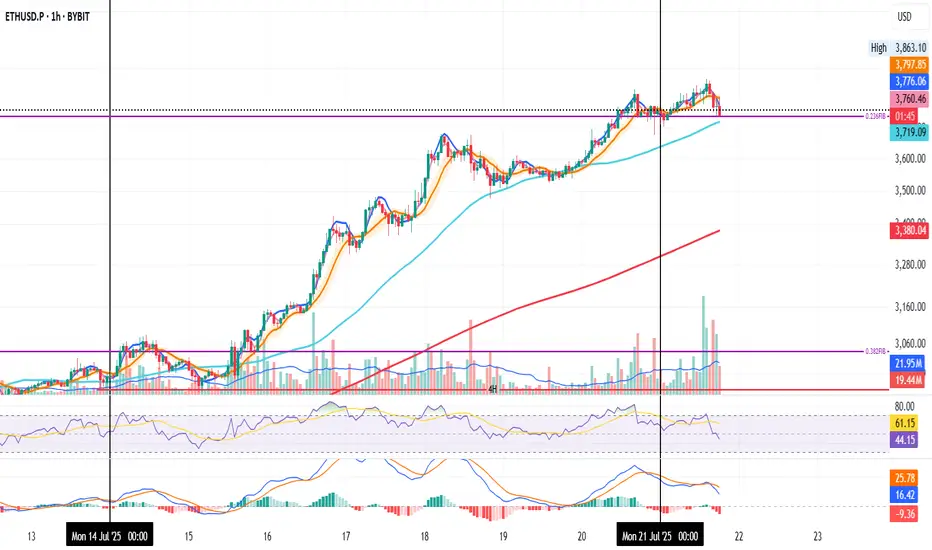
ETH on the 1H and the 0.236 Fib level
Could be a retest. Could be a fakeout. Could be the start of a move down.
RSI and MACD are both dropping.
SMA < MLR < BB Center confirms a downtrend.
50MA is sitting below the Fib level.
200MA is far below at $3,400, but rising quickly.
If tonight’s candles start closing under the Fib level, the warning gets louder.
If not, more upside remains likely.
Always take profits and manage risk.
Interaction is welcome.
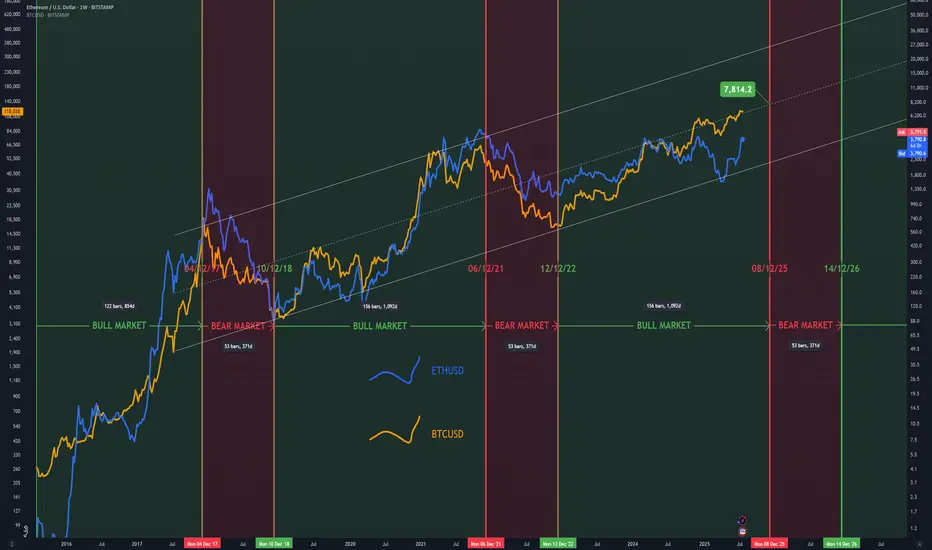
Realistic ProjectionThis is the more realistic approach for the Bull Cycle. Using both ETHUSD and BTCUSD and using their BEAR and BULL durations, this provides us with a December peak, with ETHUSD topping at the middle of the channel in the $7.5-8k range.
Ethereum: Breakout Holds Strong | Next Targets $4K, $7K+Last week, three major crypto bills cleared the U.S. House of Representatives—and Ethereum (ETH) is emerging as the biggest winner from this legislative momentum.
ETH recently broke out of a rounding bottom pattern and hasn’t looked back. Momentum continues to build, and it’s now outperforming most other major assets.
📈 Technical Highlights:
✅ Short-term target: $4,000
✅ Long-term potential: $7,000–$8,000
🛡️ Key support: $2,700–$2,800 (bullish as long as this holds)
📣 Takeaway:
Ethereum’s breakout remains intact. Pullbacks into support could offer high-probability setups for swing traders and long-term investors.
#Ethereum #ETHUSD #Crypto #Trading #TechnicalAnalysis #CryptoTrading #EthereumPrice #Altcoins #Bullish #Breakout

ETH/USD Short Setup – Bearish Opportunity Amid Bullish RSI DiverLooking to short Ethereum at current levels as price action shows bullish RSI divergence at the top, signaling potential exhaustion of the uptrend.
Trade Plan:
Sell Stop: 3,680
Stop Loss: 3,865
Take Profit 1: 3,495
Take Profit 2: 3,310
This setup aims to capitalize on a potential reversal as momentum weakens. Managing risk carefully with a well-placed SL above the recent high.
🔍 Watching closely for confirmation — a break below 3,680 would validate entry.
#ETHUSD #CryptoTrading #ShortSetup #TechnicalAnalysis #RSIDivergence

ETH - FULL top-to-bottem AnalysisHere is the full analysis for CRYPTOCAP:ETH as requested 🫡
Weekly Time-frame:
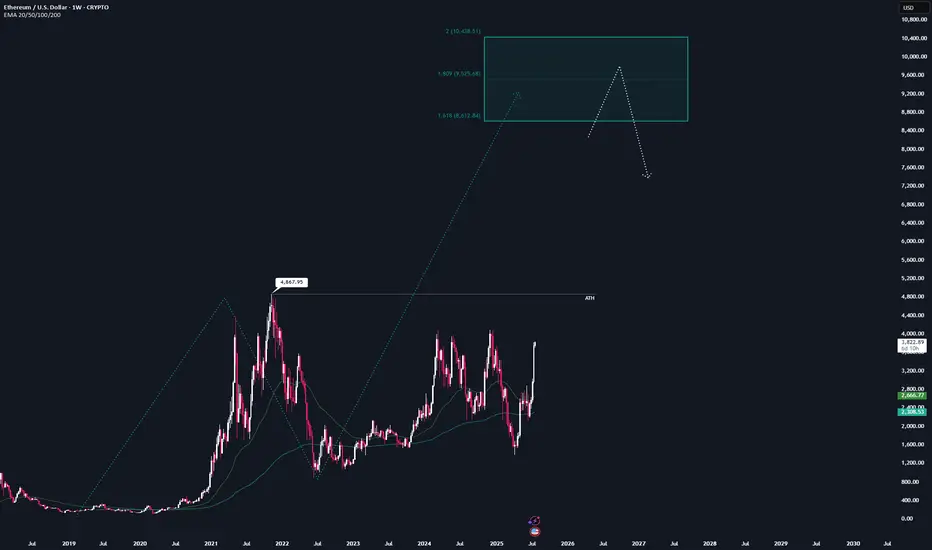
We currently have one potential bullish structure for this cycle, which could take ETH into the $8,600–$10,400 price range.
This sequence gets activated once we break the all-time high at $4,867.
That area also marks my maximum target for this cycle — anything beyond that is pure maga FOMO, and I’m not going to gamble on some “super cycle” narrative.
At the weekly level, I wouldn’t recommend making additional buys in the current price range.
If you're still sidelined at this point, you should honestly reflect on your positioning this cycle — we’ve been given plenty opportunities to enter at good prices.
Daily Chart:
Around 1.5 weeks ago, we finally broke through the major resistance at $2.8k, which has been the key level to watch for the past two years.
That breakout also activated a bullish structure, targeting the $4,500–$5,100 range — which aligns with new all-time highs.
However, a retracement before reaching the target zone is always possible, and any pullback should be viewed as a gift for long entries.
I’ll be placing 4 long orders at each Fib level within the orange B–C retracement zone, each with a stop-loss just before the next level.
The key resistance to watch now is around $4k — once we break above that, hitting the target zone becomes highly likely.
Local price action:
Currently, no valid structures can be identified on the lower timeframes.
However, if valid bearish structures appear on the 1H or 4H charts, I’ll consider them for hedge short opportunities.
Summary:
All in all, waiting is the best strategy right now.
I wouldn’t recommend buying in this region anymore — and it's still too early for valid short setups.
Hope this analysis was helpful for at least one person ❤️
Thanks for reading,
Cheers!
$Eth Ethereum nearing critical resistance....All Time High soon!This is a weekly candlestick chart of ETHUSD
Current price: 3800
CRYPTOCAP:ETH Ethereum recently broke out of a long-term downtrend, indicated by the red diagonal trendline. Price action has shifted from bearish to bullish. This is also a show of strong Momentum as recent candles are large and green, showing aggressive buying (strong bullish pressure).
If #eth continues in this uptrend then here are the resistance above to watch: 4000, 4800 and possibly new all time highs at 5600, 6400
Note worthy to know that the areas between 3800-4000 is very critical resistance.
Assuming a retracement from this resistance, Ethereum remain bullish above 2900
Invalidation of this idea is under 2900

ETH weekly turning positive too targeting $5000 sl $1500Weekly trend turning slowly turning positive with daily already in a positive channel, expecting 5000 with corrections along the way. Dipping below $1500 would invalidate

ETH turned bullish on the daily chart, great R:R hereTargeting mid to upper 3000s in the mid-term (2-3 months) and expecting 5k plus by year end. ETH will get it's turn, don't worry
