ETHUSD heading towards the top of the D1 frame✏️ CRYPTO:ETHUSD is in a strong uptrend towards the resistance zone of the 3800 daily frame. There are not many conditions for the sellers to jump in and reverse the current trend. Wait for the price reaction at the resistance of the D1 frame to consider the SELL strategy. Because currently if BUY is too Fomo.
📉 Key Levels
Sell trigger: Rejection from 3800
Target 3400, potentially 3,380
Leave your comments on the idea. I am happy to read your views.
ETHEREUM trade ideas

MTF bearish macro outlook on Ethereum, wave X finishedMini altcoin season over? I think we are about to see a record high amount of liquidation within the next few months.
This is not going to sit well with a lot of people I suspect.. Even if the count is technically correct, I suspect many will not see it as probable.
This is a bias based on not just Elliott waves, but internals of S&P and NQ looking week despite crawling higher this past few days. Ethereum and even Bitcoin having massive open interest (OI). Each time Ethereum has reached close to 4k area (2024 March, May, Dec, 2025 July), OI has increased significantly with high-ish positive funding rate. Almost all indicators for Bitcoin are red hot with bearish divergences. Momentum has stalled. Sentiment is ridiculously bullish.. after Bitcoin has had a 8x?
Having said that, from the last post, I was expecting somewhere around 3500-3600 region to finish the X wave. 1400 to 1800 run is impressive. But, so were the S&P, NQ, Bitcoin, and gold. I still see the recent April to July run as a 3-wave in Ethereum.
Invalidation is simple: it needs to break 4k. That would mean there are multiple 1-2's stacked in the April-to-July run..
I see 1900 as a very strong level. I suspect that's not the final destination but I expect to see a good reaction/bounce from that area. My primary target is just below 1400, the April 2025 low. Anywhere between around 1050 and 1400 should suffice, forming a massive running flat as a corrective wave 2 since 2022.

Ethereum at Crucial Resistance – Will the Bulls Hold or Fade?Ethereum at Crucial Resistance – Will the Bulls Hold or Fade?”
Ethereum is currently trading near a key resistance zone around $3,800, as marked on the chart. After a strong bullish rally with clear Break of Structures (BOS) along the way, ETH has now reached an extended point where price may face selling pressure.
The Bollinger Bands are stretched, showing overextension, and the marked arrow suggests a possible correction or pullback from this level. A retest of previous support zones (~$3,400–$3,200) could be expected if the resistance holds.
⸻
Key Levels:
• 🔼 Resistance: ~$3,800
• 🔽 Support: ~$3,400 / ~$3,000
• 🔄 Price Action: Watching for rejection or breakout confirmation
This is a textbook case of price approaching a strong resistance level after a bullish wave, where caution and confirmation are key for the next move.

Bullish continuation?The Ethereum (ETH/USD) is falling towards the pivot and could bounce to the 1st resistance.
Pivot: 3,471.00
1st Support: 3,039.91
1st Resistance: 4,094.93
Risk Warning:
Trading Forex and CFDs carries a high level of risk to your capital and you should only trade with money you can afford to lose. Trading Forex and CFDs may not be suitable for all investors, so please ensure that you fully understand the risks involved and seek independent advice if necessary.
Disclaimer:
The above opinions given constitute general market commentary, and do not constitute the opinion or advice of IC Markets or any form of personal or investment advice.
Any opinions, news, research, analyses, prices, other information, or links to third-party sites contained on this website are provided on an "as-is" basis, are intended only to be informative, is not an advice nor a recommendation, nor research, or a record of our trading prices, or an offer of, or solicitation for a transaction in any financial instrument and thus should not be treated as such. The information provided does not involve any specific investment objectives, financial situation and needs of any specific person who may receive it. Please be aware, that past performance is not a reliable indicator of future performance and/or results. Past Performance or Forward-looking scenarios based upon the reasonable beliefs of the third-party provider are not a guarantee of future performance. Actual results may differ materially from those anticipated in forward-looking or past performance statements. IC Markets makes no representation or warranty and assumes no liability as to the accuracy or completeness of the information provided, nor any loss arising from any investment based on a recommendation, forecast or any information supplied by any third-party.

ETHUSD-SELL strategy 12 hourly chart REG CHANNELAs always crypto movements are severe, and one can never judge the corrective timings. Overall the view remains the same, and when carefully scaling in, is always warrented and proper risk management strategies.
Strategy SELL @ $ 3,675-3,750 area and take profit @ $ 3,175 area. On previous shorts if applicable, scale down slowly.


ETHUSD: Multi-Scale LevelsResearch Notes
Price is getting close to connected tops (after which rejections happened).
If we scale out, there is larger narrative Giving vital points of reference.
The dynamics look like part of various progressions at the same time. For example, to answer why price grew from sub-2k levels in the first place, I would pay attention to how it had been falling. Even if price breaks above white line, the ongoings cycle still inherits the prolonged timing.
Interconnection of levels with structural significance:
⬩At smaller scale, fibonacci channel adjusted to the angle of the first small cycle
⬩Scaling out the structure from previous cycle to relate to the levels of local scope.
⬩The final frame of reference covers the case where price expands breaking domestic range.

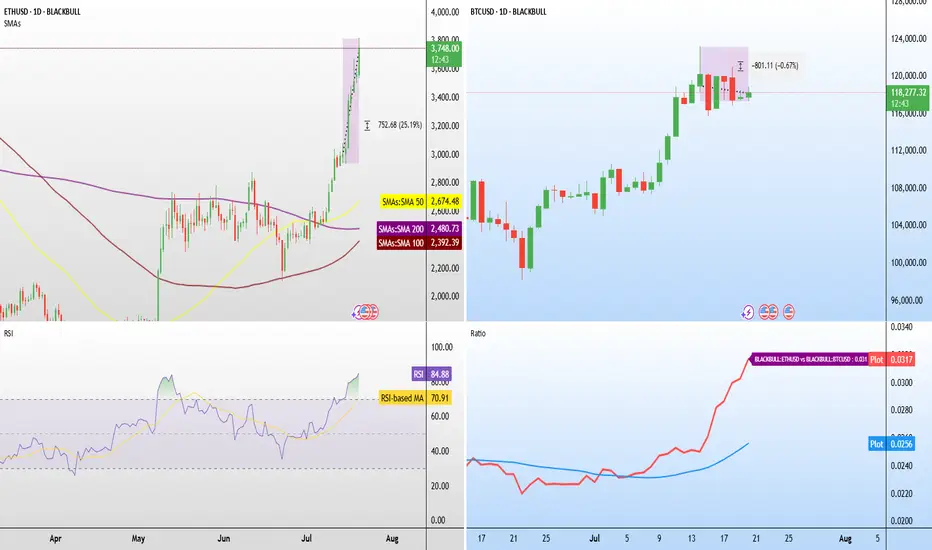
Will ETH stall at $3,800 like BTC did at $120K?Ethereum is firmly in breakout mode. The ETH/BTC ratio , a closely watched measure of altcoin strength, has surged close to a year-to-date high.
ETH has now gained over 25% in the past week, fueled by institutional flows into ETH ETFs and tech investor Peter Thiel reportedly taking a major stake in BitMine.
RSI is at 84.82 , showing extremely strong momentum, though short-term consolidation near the $3,800–$4,000 resistance zone is possible. This is a zone that capped previous rallies in 2024.
Bitcoin, in contrast, is holding flat near $118,000 , down slightly from its recent highs above $120,000 . Small-bodied candles and minor intraday sell-offs have formed a tight consolidation block, indicating profit-taking and indecision.
The question now is whether Ethereum will follow BTC’s recent behaviour and stall near local highs, or whether the breakout will carry it decisively through $4,000 .
Ethereum is going to 2000 then new ATH
Alright, let's talk about what I see coming for Ethereum. I’ve been deep-diving into these charts, especially that weekly one where I’ve highlighted the past moves and percentages. I'm using these patterns as a guide to try and anticipate where Ethereum is heading next. I'm going to set aside any kind of trading advice, and focus on what I see the market doing next.
Key Observations From Past Cycles
Looking at Ethereum's history, I’m seeing a pretty clear cycle of large price swings:
Massive Rallies: Ethereum has a history of powerful bull runs, where the price can surge by hundreds, or even thousands of percent. I need to be aware of these to understand the potential of the coin.
Substantial Corrections: These rallies are always followed by substantial corrections, which range from about 30%, to upwards of 80%. This is important to see as any retracement can be devastating to a trader.
My Prediction For The Next Move:
Based on those historical patterns, here’s what I see as the most probable outcome for Ethereum's next move:
Anticipated Retracement: I’m expecting a retracement, or a pullback following the recent gains. Ethereum tends to make large retracements after a period of growth, and I am anticipating this will happen again soon. I want to see the price find a solid level of support, as this will be important to the next move up. Based on historical price action, I expect the next support levels to be somewhere around $2000 to $2500.
The Next Upside Move: After that pullback, I anticipate a strong upside move.
The magnitude of this move is unclear, but the data on the chart shows we could be looking at a move upwards of 100%, and maybe even more. I want to be watching that very carefully when it happens.

Moon SoonThe Genius Act passing and other regulatory tailwinds pave the way for the US financial system and the rest of the world to slowly migrate over to blockchain infrastructure via Ethereum. The demand relative to supply imbalance will force ETH to re-rate aggressively over coming months and years

ETH 1H – Breakout or Bull Trap ?
ETH just broke above the 0.236 Fib with a strong push.
✅ Trend structure remains bullish:
MLR > SMA > BB Center.
But something feels off...
🔍 Volume surged late — likely short liquidations.
OBV didn’t confirm — it's still lagging.
RSI is extended. Structure looks tired.
Could be a liquidity grab above recent highs.
If price closes back below the Fib, momentum could fade fast.
📌 Key zones to watch on a pullback:
– 1H 50MA
– Previous support clusters
We’ll be here to watch it unfold.
Always take profits and manage risk.
Interaction is welcome.

ETHUSD (15m) – Precision Pullback Anticipated Before Final Expan📈 ETHUSD (15m) – Precision Pullback Anticipated Before Final Expansion
VolanX Protocol: Synthetic Capital Deployment Phase II
🗓️ July 20, 2025 | ETH @ $3,776
🚨 Market Intelligence Snapshot:
"Structure delivered. Liquidity engineered. Expansion phase in effect."
🔍 Current Readings:
🟥 Weak High tapped at $3,817
📈 Regression Line intact, favoring bullish continuation
📊 Premium zone reached – expect pullback to equilibrium before next leg up
💼 Protocol Alignment – VolanX:
Synthetic Block Order cluster from $3,701 to $3,629 (blue & yellow mitigation zones)
Reversal Potential Zone (RPZ) aligned with 0.618–0.786 retracement of latest impulse
Volume Surge at break of falling wedge confirms breakout strength
Choch → BOS Sequencing validated with structural integrity
📌 Projected Moves:
📉 Pullback into Equilibrium ($3,700–$3,629)
📈 Expansion targets:
$3,883 (1.236)
$3,989 (1.618)
Final: $4,210 (2.414) – profit booking zone
🧬 Status: Synthetic capital locked and deployed
🕒 Next Watch: Rejection or acceptance at 0.618–0.786 FIB zone
🛡️ “Discount fuels premium. Wait for precision, not permission.”
#ETHUSD #VolanX #SyntheticDeployment #SmartMoneyConcepts #LiquidityGrab #FVG #PriceAction #AlgoDrivenTrading #WaveAnalysis #ETH

ETH Season?Well, in all of its history Ethereum’s recent lows remind me the most of December 2019 while the recovery after reminds me the most of the bull rally after March 2020. Either way I think the time for ETH and crypto as a whole is very near. Here’s my charted roadmap. If BTC hit a new high and then some over a whole year already since it hit a new high, then how do we not expect ETH to do the same and probably amplified as well as certain alt coins too. Curious to see how this thesis plays out. Not financial advice

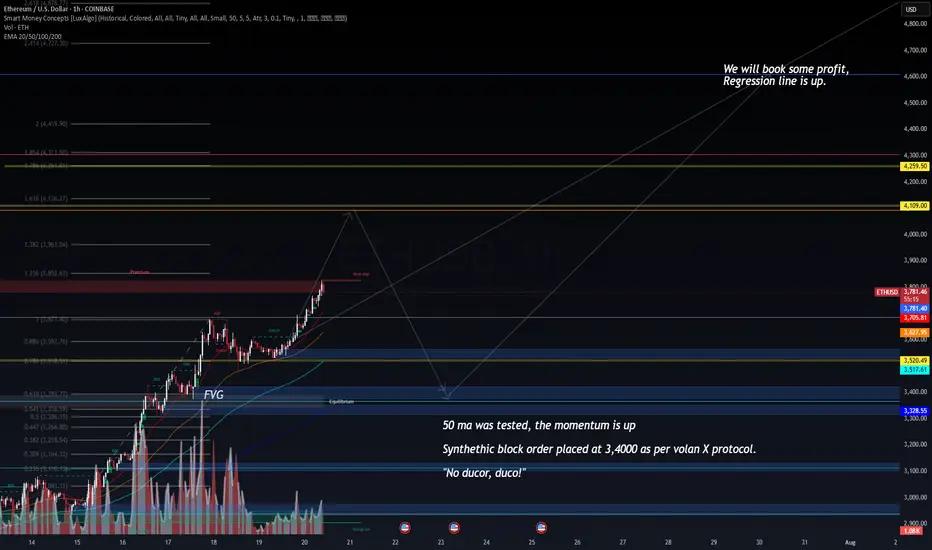
ETHUSD – Deploying Synthetic Capital as per VolanX Protocol📈 ETHUSD – Deploying Synthetic Capital as per VolanX Protocol
1H Chart | July 20, 2025
"No ducor, duco!"
(“I am not led, I lead.”)
🧠 Market Context:
Price is holding above the 50 MA, confirming upward momentum. Liquidity has been taken from prior internal highs, and price continues pushing into the premium zone above the 1.0 Fibonacci level.
🔧 VolanX Protocol Deployment Update:
✔️ Synthetic Block Order: Placed at $3,400, with precision according to Volan X synthetic injection model.
✔️ Regression Line: Sloping upward – momentum remains in favor of bulls.
✔️ Weak High Targeted: $3,850 zone approached with clear aggression.
✔️ Volume Uptick: Observed near FVG and mitigation zones – ideal for synthetic deployment timing.
📍 Key Zones:
🚩 Block Order Zone: $3,400
🎯 First Profit Target: $3,852 – $3,961 (Premium zone)
🟡 Ultimate Target: $4,259 – $4,419
🔵 Equilibrium Support: $3,328
💬 Narrative:
"We will book some profit, Regression line is up."
Price is behaving according to expectations. The 50 MA retest confirms the continuation bias, and we now monitor for the next volatility compression before expansion. Expect smart money to aim for the inefficiencies left near the $4,100–$4,250 level.
📊 Deployment Signal: LIVE
🧬 VolanX Engine: Active
📍 Next Review: Upon 1.382 fib reaction or volatility compression
#ETHUSD #VolanX #SyntheticCapital #SmartMoney #MomentumTrading #TradingStrategy #FVG #PriceAction #CryptoAnalysis

ETH BUY SETUP ,Bought From $3720ETH BUY SETUP
Currently $3720
Bought From $3720
(Trading plan If ETH go down
to $3630 will add more longs)
Expecting target $3830 OR ABOVE
In the event of an early exit,
this analysis will be updated.
Its not a Financial advice

ETH is up about 50% Since June 2025Relying on the absolute intraday low from June to claim that ETH is “up 70%” is a textbook data‑skewing mistake often found in AI‑generated headlines. A more robust approach is to average prices over several days (or even a full week). On that basis, ETH has risen roughly 50% since June— not 70%. Don’t let a distorted headline push you into adding leverage through perpetuals just because your strategy’s returns lag spot performance; that reaction only compounds impermanent‑loss risk.

Inspired my Benjamin CowenWhilst this is also high speculation and to not be used to predict the market, using Benjamin Cowen's idea of using the SPX Index's 1990's timeframes and extending them to match the potential ETHUSD cycle.
You'll see how the early parts to the moves are near 1/1 of each other. Looking into the future, you'll also see that the SPX's moves interact with the middle part of the channel multiple times, and begins to decline in the potential bear market (yellow dashing lines). This also looks pretty convincing. Charts are so fascinating.

High SpeculationThis is something I've come up with for a bit of fun, but looks pretty convincing, but should still to take with a massive grain of salt.
After comparing the ETHBTC and ETHUSD dates, this is what I've come up with, and so to get a better understanding, visit my other post showcasing the ETHBTC chart and put them side by side.
I've come up with a bull cycle endpoint by using ETHBTC's top and bottom durations which typically coincide with each other, and just used the channel it has been following as the potential price peak, given how much ETHUSD has moved from a far smaller move in ETHBTC makes this possible as ETHBTC has a long way to go still.

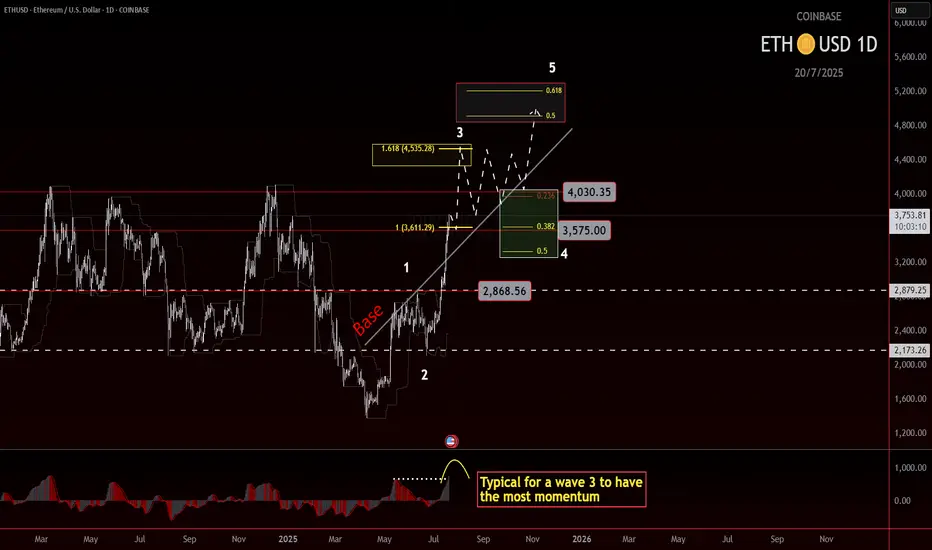
ETH roadmap to 5000!Ethereum Wave 3 in Play? Eyes on the $4500 Target
Ethereum may currently be progressing through a wave 3, which is often the strongest leg of an impulse. The structure so far supports that idea, and based on standard projections, the most likely target sits near $4500.
If price can break and hold above the 4k level, we could see a consolidation forming above the previous high. That would be a constructive sign and might set up the next leg higher.
But there’s still a chance ETH struggles to clear that level. If that happens, consolidation could form just underneath, which would still be acceptable within a wave 3 framework. What matters next is the shape and depth of the pullback.
Wave 4 will be the key. A shallow or sideways correction would keep bullish momentum intact. A deeper pullback doesn't ruin the structure, but it does mean we’ll need to watch support zones more closely.
If wave 4 behaves well and broader market conditions stay supportive, then a final wave 5 could bring ETH into the $5000 region. That’s the upper edge of this current roadmap, based on conservative assumptions.
Stay flexible. Let the structure guide the bias.
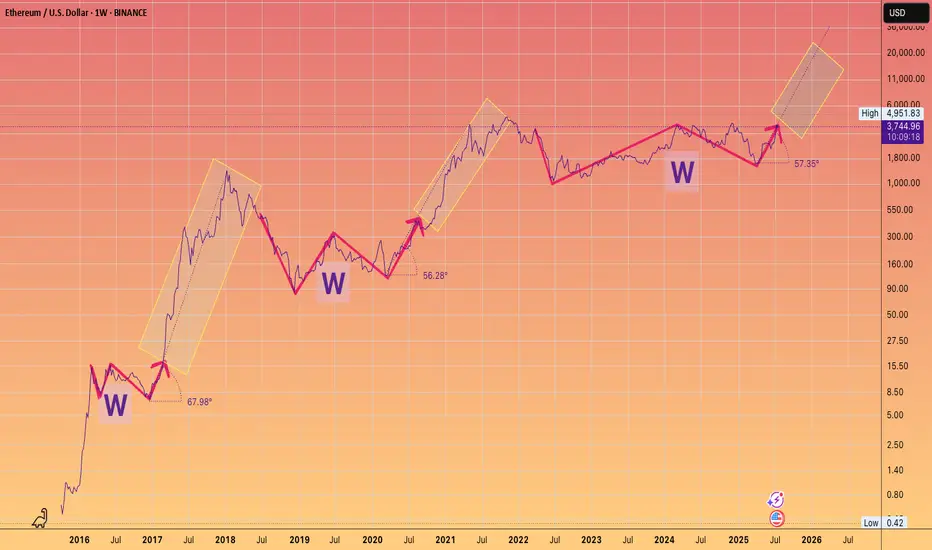
3 Wins to Glory.You guys know my long term Targets for ETH.
What I wanted to highlight is the angle of the Banana zone has been remarkably consistent on the Log chart.
Granted we only have 2 - 2.5 data points
But note how even in 2025 the run is adhering to the approx 60 degree angle of attack, after breaking out of their respective W's.
something to monitor.
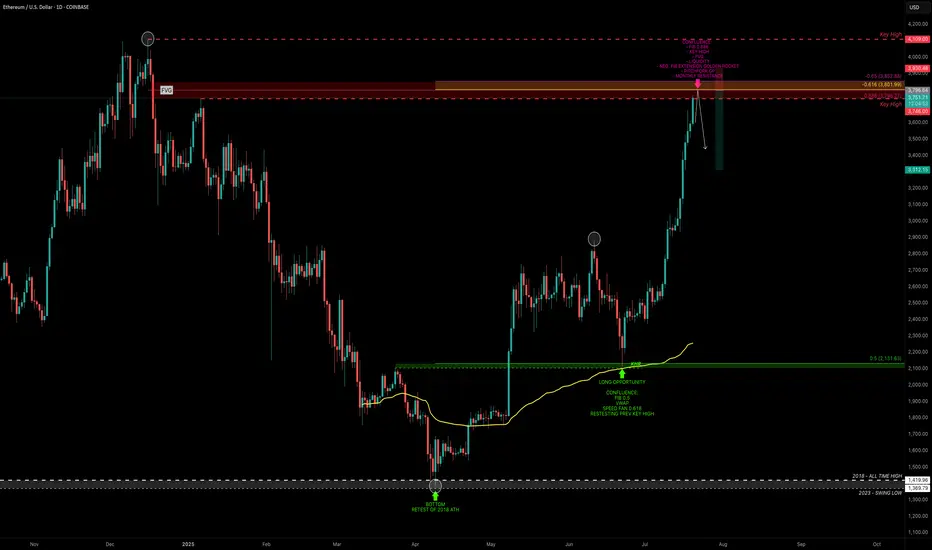
ETH — Rally Exhaustion or More Upside?ETH has been on an absolute tear. After retesting its old 2018 all-time high, it marked a bottom at $1383 — a brutal -66% correction over 114 days from the $4109 top.
From there, ETH ripped +100% in just one month, followed by 40 days of consolidation, and now, over the past 28 days, it’s surged another +76%, currently trading around $3715 — all without any major correction.
So the big question:
What’s next? Are we near a short setup, or is it time to long?
Let’s break it down.
🧩 Key Technicals
➡️ Bounce Zone:
On June 22, ETH retested the 0.5 fib ($2131.63) of the prior 5-wave Elliott impulse, with extra confluence from:
Anchored VWAP
Speed fan 0.618
➡️ Key Highs to Watch:
$3746 → recent local high
$4109 → 2021 all-time high
➡️ Fib Retracement Levels:
ETH has smashed through all major fibs, including the golden pocket (0.618–0.65) and 0.786 fib. The 0.886 fib at $3798.27 is the last major resistance, just above the $3746 key high.
At this zone, we also have:
Fair Value Gap (FVG)
Monthly Resistance
Negative Fib Extension Golden Pocket Target
➡️ Momentum Signal:
ETH is currently on its 8th consecutive bullish daily candle — historically, after 8–13 consecutive candles, price tends to cool off or correct. A sign to be cautious about longing here and consider profit-taking.
🔴 Short Trade Setup
Look for a potential SFP (swing failure pattern) at the key high $3746 to initiate a short trade.
This offers a low-risk setup with:
Entry: around $3746 (if SFP confirms)
Target (TP): ~$3300
Stop-loss: above SFP
R:R ≈ 1:4+
💡 Educational Insight: Why You Don’t Want to Long the Top
Markets often trap late longers near key highs or resistance zones — this is where smart money distributes while retail piles in emotionally.
Lesson: Look for zones of confluence (fib, VWAP, liquidity, FVG) and avoid chasing extended moves after multiple bullish candles.
Patience and confirmation at reversal points lead to higher-probability setups — you don’t need to catch every pump.
Final Thoughts
We’re approaching major highs, so this is a time for caution, not FOMO. Watch for reaction and potential reversals near $3750–$3850.
Stay sharp, manage risk — and remember, tops are where longs get trapped.
_________________________________
💬 If you found this helpful, drop a like and comment!
Want breakdowns of other charts? Leave your requests below.
the Inverse Golden BullrunJust a joke maybe but here some considerations...
each peak is reached in 1/0.606 * previous cycle length, which is oddly close to the inverse of the golden ratio. The Q1 peak in 2024 seems to have occurred oddly in advance.
Resistance of bear markets can be found at a common focal points and all have an angle of approx 20° on the linear scale.
this inverse golden bullrun will produce a very turbolent market with a new local top in 2025. This seems reasonable considering the whole global situation, crypto narrative, oversaturation and how we got rejection before breaking the past ATH.
the overall superstructure could break out or be confirmed after next "inverse golden bullrun"
oddly again, should the breakout occurr, it would happen around 1/3rd of the triangle, which is typical for those structures.
overall, not bullish nor bearish, don't hate.
most certainly mostly wrong ;)
not a financial advice, just for fun.
