Ethereum/US Dollar 1D Chart - BINANCEdaily price movement of Ethereum (ETH) against the US Dollar (USD) on the Binance exchange. The current price is $2,992.08, reflecting a +1.39% increase (+$41.10) as of 09:54 AM CEST, July 11, 2025. Key levels include a resistance zone around $3,500-$4,000 and support near $2,736. The chart highlights recent buy and sell signals, with a notable upward trend approaching the resistance zone.
ETHEREUM trade ideas

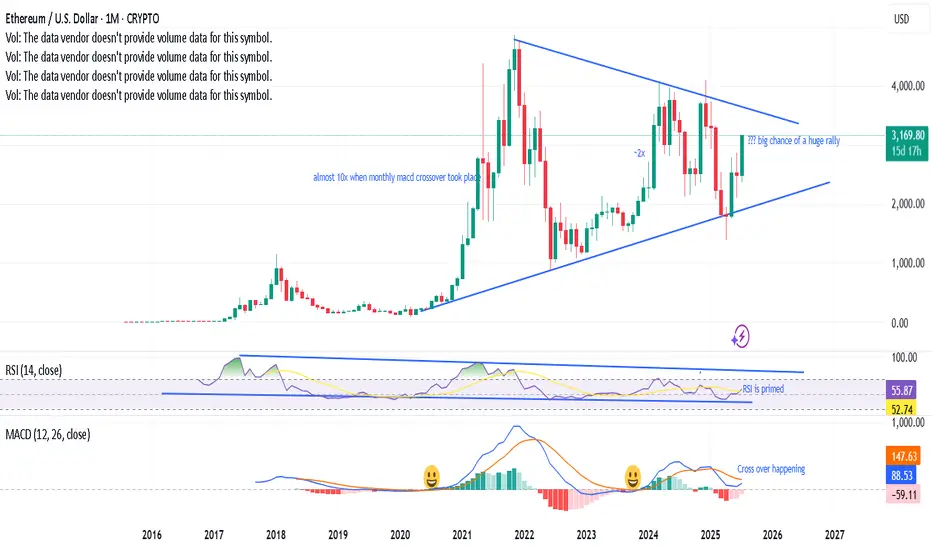
Monthly MACD crossover taking place, a prabolic rise?Last 2 times, when the monthly MACD cross over has happened, ETH has gone bonkers. A third one is on the verge of happening, RSI has enough room with a symmetrical triangle with bullish momentum - looks like a big rally is in the near horizon. Fingers cross.
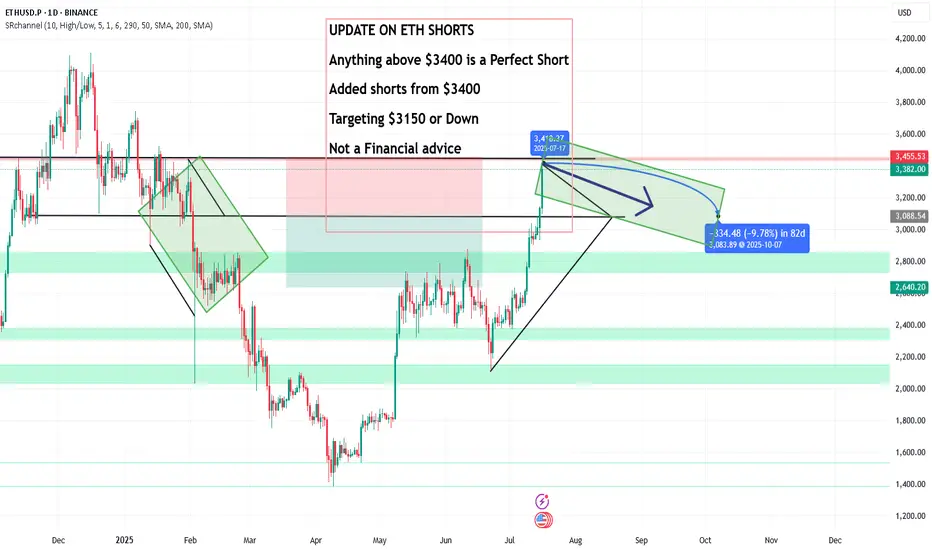
UPDATE ON ETH SHORTS, Anything above $3400 is a Perfect ShortUPDATE ON ETH SHORTS
Anything above $3400 is a Perfect Short
Added shorts from $3400
Targeting $3150 or Down
Not a Financial advice
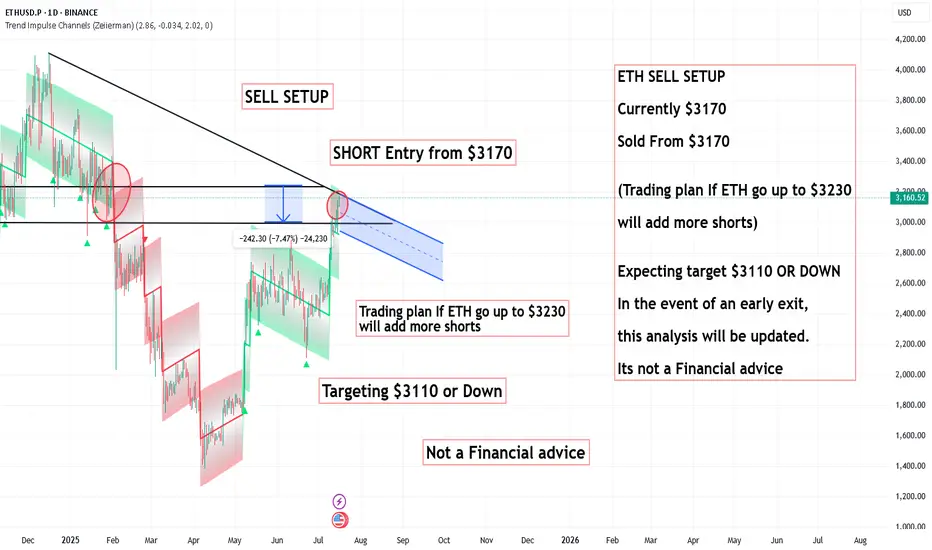
ETH SELL SETUP ,Sold From $3170ETH SELL SETUP
Currently $3170
Sold From $3170
(Trading plan If ETH go up to $3230
will add more shorts)
Expecting target $3110 OR DOWN
In the event of an early exit,
this analysis will be updated.
Its not a Financial advice
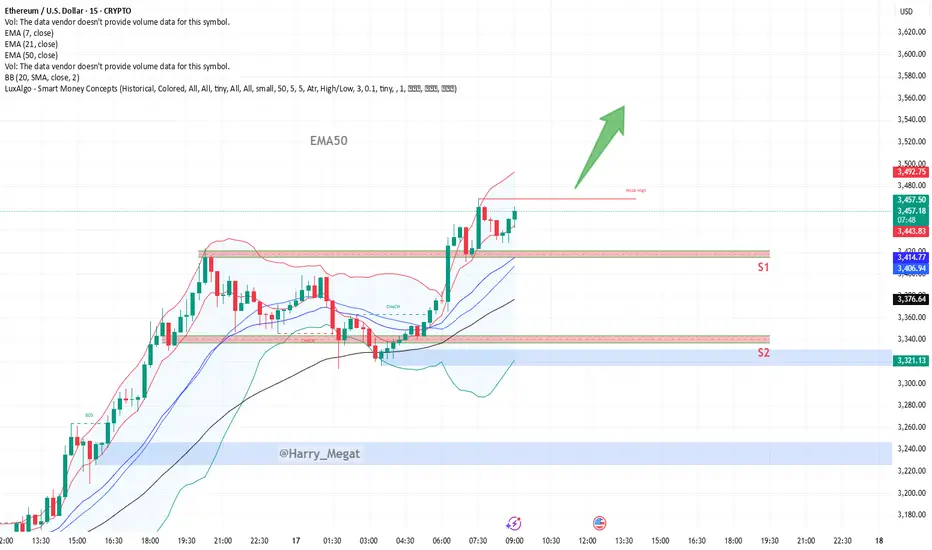
Technical **chart analysis** for ETH/USDTechnical **chart analysis** for **ETH/USD** based on (15-min timeframe) :
Bullish Outlook**
* **Price Action**: Ethereum is consolidating just above previous resistance (\~\$3,440) after a breakout from the range.
* **Current Price**: \~\$3,446
* **EMA Support**:
* EMA 7: \$3,441 (price holding above)
* EMA 21: \$3,413
* EMA 50: \$3,376 (strong dynamic support)
Key Levels**
* **Resistance Broken**: Former resistance zone (\~\$3,415–\$3,440) now acting as support.
* **S1 Support Zone**: \$3,415–\$3,440 (ideal retest zone for long entries)
* **S2 Support Zone**: \$3,335–\$3,350 (next demand zone if S1 fails)
Analysis Summary**
* **Trend**: Bullish momentum is intact above EMA cluster.
* **Setup**: Retest of breakout zone successful → price stabilizing above EMA7.
* **Target Area**: If momentum continues, next target zone could be \$3,500–\$3,560 (as shown by green arrow).
* **Invalidation**: Drop below \$3,413 (EMA21) and especially \$3,376 (EMA50) would weaken the bullish structure.
ETHUSD Is Going Up! Buy!
Please, check our technical outlook for ETHUSD.
Time Frame: 12h
Current Trend: Bullish
Sentiment: Oversold (based on 7-period RSI)
Forecast: Bullish
The market is approaching a key horizontal level 3,011.53.
Considering the today's price action, probabilities will be high to see a movement to 3,240.64.
P.S
The term oversold refers to a condition where an asset has traded lower in price and has the potential for a price bounce.
Overbought refers to market scenarios where the instrument is traded considerably higher than its fair value. Overvaluation is caused by market sentiments when there is positive news.
Disclosure: I am part of Trade Nation's Influencer program and receive a monthly fee for using their TradingView charts in my analysis.
Like and subscribe and comment my ideas if you enjoy them!

Ethereum Primed for Breakout as Institutional Interest SurgesBlackRock's aggressive ETH accumulation—$276M in February, $98M just this week—signals institutional conviction as Ethereum approaches a breakout towards $3,000. With real-world asset (RWA) tokenization exploding to $21B+ (Ethereum commanding 59% market share) and stablecoin volume hitting record $717B monthly highs, ETH is positioned as the backbone of traditional finance's blockchain migration.
The convergence of institutional buying, technical breakout signals, and Ethereum's dominance in the fastest-growing crypto sectors creates a perfect storm for the next major price surge 🚀
intel.arkm.com

Ethereum (ETH) – Strategic Trade PlanEthereum (ETH) continues to show resilience, currently trading around $1,790 after a strong bounce earlier this month. While the crypto market remains volatile, ETH is holding key technical levels that could fuel a major move in the coming weeks.
🎯 Entry Points:
Market Price: $1,790 — Ideal for an early position, as ETH holds above critical support zones.
$1,645 — Secondary strong support, aligning with the 20-day EMA; great for scaling in if market pulls back.
$1,400 — Deep value zone, offering a high-risk/high-reward setup if broader market correction occurs.
💰 Profit Targets:
$2,500 — First major resistance. A realistic mid-term target if bullish momentum sustains.
$3,000 — Psychological milestone and breakout confirmation level.
$3,800+ — Ambitious but achievable with broader crypto market recovery and strong ETH network metrics.
🛡️ Risk Management:
Set stop-losses dynamically below each entry support level.
Scale into positions progressively to manage volatility.
Monitor macroeconomic trends and Bitcoin's influence closely.
🔍 Key Observations:
Strong on-chain activity supports a bullish thesis.
Current resistance around $1,812 must be broken to confirm bullish continuation.
Be cautious of sudden market-wide corrections — always plan your exits and manage your risk accordingly.
📢 Disclaimer: This is not financial advice. Trading cryptocurrencies involves significant risk, and you should only invest what you can afford to lose. Always perform your own research before entering any position.

Eth Key Levels reached Possible retracement key levels reached . Reset before 10k? Ethereum is ready to burst to 5 figures in the matter of weeks!
ETH relative to AltcoinsI fee like at this current point as we see altcoin pairs bleed against ETH and BTC while putting in lower lows while Eth puts in higher highs we will not see the altseason we are hoping for until altcoin pairs hit here range lows which I can see happen end of Q3 into the start of Q4 but until then they can still rise as ETH.D continues its rally but I feel until altcoins reach its range lows being the .25 lvl on (TOTAL3-USDT)/BTC we will not see that face melting rally we are looking for.

New phase of ETH adoption? holding longLot of bills and adoption of ETH ecosystem, i do like the idea of another 2017 like breakout, CRYPTOCAP:ETH COINBASE:ETHUSD

ETHUSD - Stretched price. Pullback to CL likelyPrice tagged the U-MLH, the stretch level.
Think of it like the 2nd STDV.
Now think Mean Reversion.
With such a stretch, price has a high chance to revert to the mean - down to the Centerline (CL).
What is this information good for?
a) take profit (...or 50% partial)
b) short on intrady signs
But if it is open and close above the U-MLH, then there's a good chance that price is advancing to the Warning Line, the extension of the Center to U-MLH.
Let's observe what happens.

ETH - If You Know ...... You Know whats Coming
NYSE:BLK $BUIDL tokenized U.S.-Treasury fund launched on COINBASE:ETHUSD in Mar 2024—Wall Street is already settling real dollars on-chain.
NYSE:JPM JPMD stablecoin just went live on Base (an COINBASE:ETHUSD L2), piping wholesale payments from a $4 T balance-sheet straight through COINBASE:ETHUSD rails.
COINBASE:ETHUSD isn’t just riding the next crypto cycle—it’s becoming Wall Street’s settlement layer. From BlackRock’s on-chain Treasury fund to JPMorgan’s and soon Bank of America’s dollar tokens, a tidal wave of institutional stable-coin flows is lining up behind ETH. Fewer coins, more real-world volume—if you know, you know what’s coming.
NYSE:BAC CEO says they’ll issue a dollar-backed token the moment regulators nod—another tier-1 bank boarding the Ethereum train.
Stablecoin cap has blasted past $230 B , with 80 %+ of all on-chain transfers riding Ethereum (plus BSC) blocks.
Corporate settlements via stablecoins grew 25 % YoY in 2024 as multinationals replaced SWIFT with instant on-chain clearing.
Daily stablecoin throughput averages $7 B—each hop burning ETH and tightening supply.
BCG projects tokenized real-world assets to exceed $16 T by 2030 , with EVM chains as the default plumbing.
Over 500 M wallets already interact with stablecoins , a 30 % YoY surge led by emerging-market demand.
L2s like BINANCE:ARBUSDT & BINANCE:OPUSDT cut transaction fees 35 % yet still settle back to mainnet—meaning ETH captures the fee stream and the burn.
Bottom line: a tidal wave of bank-grade stablecoins + tokenized assets is lining up behind ETH; supply shrinks, demand soars—if you know, you know what’s coming.
quote] Marty Boots | 17-Year Trader — smash that , hit LIKE & SUBSCRIBE, and share your views in the comments below so we can make better trades & grow together!

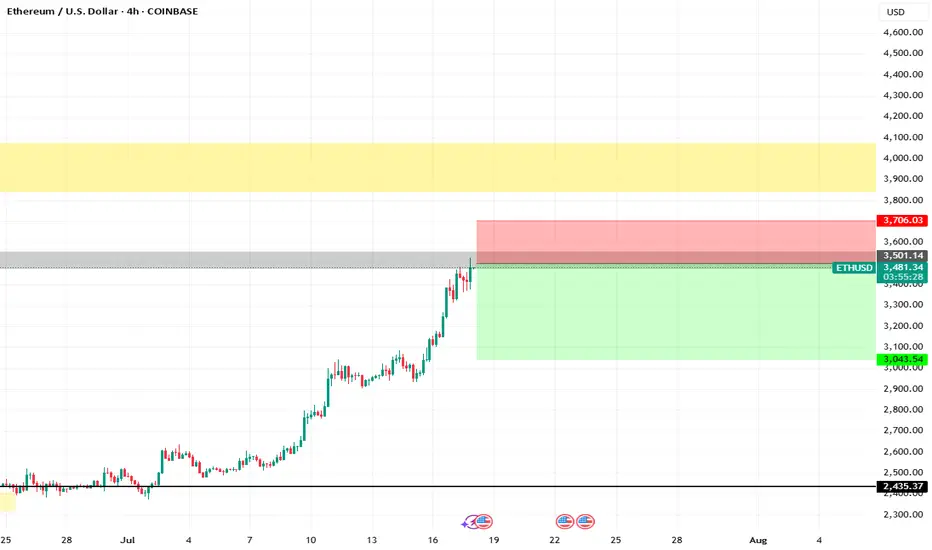
Ethereum: Overbought Conditions Persist Near $3,746ETH is testing the volume point of interest at $3,417.0, while strong resistance and an order block reside at $3,746.0. Indicators remain in overbought territory, signaling short-term overpricing.
With little resistance shown in the volume profile, ETH is expected to fall back and retest the $3,404.0 support level. Traders and investors should monitor this zone closely for a potential bullish setup.

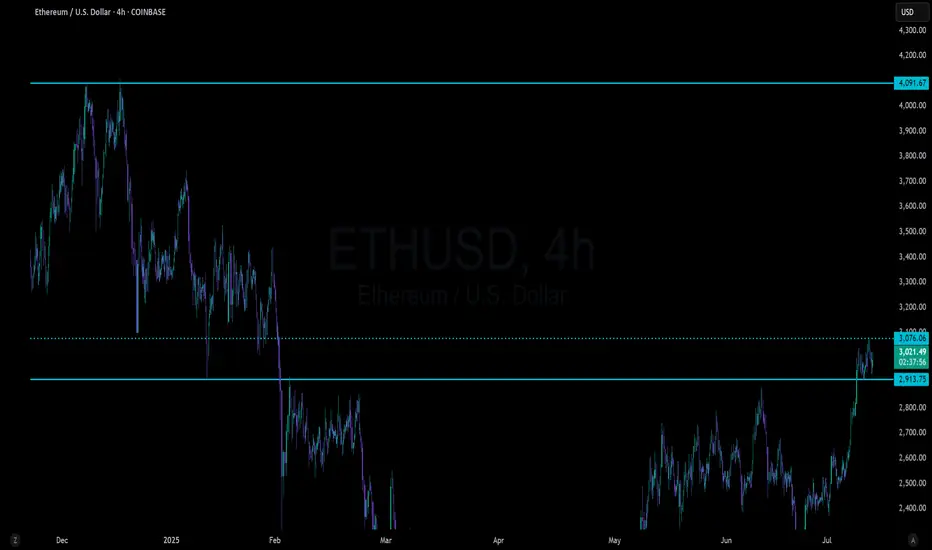
Ethereum – Calm Before the Next Leg Up?Ethereum had a disappointing start in 2025.
After pushing above $4,000 in mid-December 2024 — with headlines full of "$10K ETH coming!" — the new year began around $3,500, and what followed was a slow bleed.
By early April, Ethereum printed a shocking low at $1,380 — a level few believed was even possible.
But the bounce from there? ⚡
It was explosive — nearly +100% in just one month, with price topping around $2,700.
Since then, we’ve been consolidating — and that’s completely normal after such a vertical move.
🔍 So, what’s next?
Technically, ETH is forming a rectangle, a structure that often resolves as a continuation pattern.
The spike down to the $2,300 zone on May 19th was telling — buyers stepped in aggressively and pushed price back above $2,500, which now acts as a comfort zone for bulls.
📌 Conclusion
I’m looking to buy dips, ideally near $2,550, and my target is the $3,500 zone.
No need to reconsider the bullish outlook as long as price holds above $2,300.

eth,long trend is comingmaybe last from 2025 to 2026
key points:4000,4800
Big big guess, value around $1 trillion, price near $8000

Ethereum UP UP UPThe Perfect Storm: Multiple Technical Indicators Align for ETH's Next Leg Up
With Ethereum currently trading at $3,429, a comprehensive multi-faceted technical analysis reveals compelling evidence for continued bullish momentum through the remainder of 2025. Let's dive into the convergence of powerful technical signals pointing to ETH's next major move.
RSI: Hidden Strength Behind the Momentum
While Ethereum's daily RSI hovers around 72-73, typically considered overbought territory, this actually represents strength rather than exhaustion in a powerful bull trend. Historical analysis shows that during Ethereum's strongest rallies, RSI can maintain readings above 70 for extended periods, often reaching 80-85 before meaningful corrections.
The weekly RSI at 66 is particularly telling—showing robust momentum without reaching extreme levels. This creates the perfect scenario: strong enough to maintain upward pressure, yet not overheated enough to trigger immediate profit-taking. This "Goldilocks zone" for RSI often precedes the most explosive phases of bull markets.
Wyckoff Accumulation: The Smart Money Footprint
The recent price action perfectly aligns with Wyckoff's "Re-accumulation After Spring" pattern:
The May 2025 low represented a classic "Spring" that flushed out weak hands
The subsequent rally formed a textbook "Sign of Strength" (SOS)
We've completed the "Backup" phase with higher lows
Current price action suggests we're at the "Last Point of Support" (LPS)
According to Wyckoff methodology, this LPS typically precedes the most powerful "Mark-Up" phase—where institutional accumulation transitions to public participation and price discovery accelerates dramatically. The completion of this pattern projects a move to the $4,500-$5,000 range within the forecast period.
Order Blocks: Institutional Footprints Reveal the Path Forward
Order block analysis reveals significant institutional buying between $3,000-$3,200, creating a formidable support zone. More importantly, there's a notable absence of major selling order blocks above current levels until approximately $3,800-$4,000.
This "clean air" above current prices suggests minimal resistance and the potential for rapid price appreciation once momentum builds. The most significant buy-side order blocks have been forming during recent consolidations, indicating smart money accumulation before the next leg up.
Volume Profile: The Silent Confirmation
Volume analysis provides the confirmation needed to validate our bullish thesis:
Rising prices accompanied by increasing volume (particularly on up-days)
Volume Profile shows thin areas above $3,500, suggesting potential for rapid price discovery
The Volume-Weighted Average Price (VWAP) continues to slope upward, confirming the strength of the trend
The Volume Point of Control (VPOC) has shifted higher in recent weeks, indicating accumulation at higher prices—a classic sign of institutional confidence.
Fibonacci Projections: Mathematical Roadmap to Higher Targets
Using the recent swing low of $2,150 (May 2025) to the current level as our base measurement:
The 161.8% extension projects a target of approximately $4,200
The 200% extension suggests a move toward $4,700
The 261.8% extension (often reached in strong bull markets) points to $5,400+
What's particularly bullish is that these Fibonacci extensions align perfectly with key psychological price levels and unfilled liquidity pools above the market.
Elliott Wave Structure: The Roadmap to $5,000
The current Elliott Wave count suggests we're in the early stages of a powerful Wave 3 of 5 from the May lows:
Wave 1: $2,150 to $2,800
Wave 2: Pullback to $2,450
Wave 3: Currently underway, targeting $4,200-$4,500 (typical Wave 3 = 1.618 × Wave 1)
Wave 4: Future consolidation likely in the $3,800-$4,000 range
Wave 5: Final push potentially reaching $4,800-$5,200
Wave 3 is typically the longest and most powerful in the Elliott sequence, suggesting we're entering the most explosive phase of this bull cycle.
Price Projection Timeline
July-August 2025:
Initial push through the $3,600 resistance level, followed by accelerating momentum toward $3,800-$4,000. Any pullbacks will find strong support at $3,200, creating ideal entry opportunities for those who missed the initial breakout.
September 2025:
Breakthrough of the psychological $4,000 barrier, triggering increased media attention and retail participation. This phase could see rapid price discovery to $4,200-$4,400 as volume expands dramatically.
October-November 2025:
Final wave extension pushing ETH toward the $4,800-$5,200 range, potentially culminating in a blow-off top characteristic of Wave 5 completions. This represents a 40-50% appreciation from current levels.
The Confluence That Cannot Be Ignored
What makes this analysis particularly compelling is the rare confluence of multiple technical frameworks all pointing to the same conclusion. When Wyckoff accumulation patterns, Elliott Wave projections, Fibonacci extensions, RSI momentum, and order block analysis all align, the probability of the projected outcome increases exponentially.
Smart money is positioning for this move now, as evidenced by the order block formation and volume patterns. For the strategic investor, the current price level—despite being near recent highs—represents an attractive entry point before the next major leg up in Ethereum's journey.
The technical roadmap is clear: Ethereum is poised for a significant appreciation through the remainder of 2025, with multiple technical frameworks projecting targets in the $4,500-$5,200 range by year-end.

ETHUSD 4H TIME FRAME ETHUSD is showing bullish momentum on the 4-hour chart with a strong structure to support further upside. The setup targets a potential continuation to 3,718.8, with protective risk control below 3,250.4. Watch for a clean break above 3,540 to accelerate the bullish move.

Ethereum´s local and possibly even macro bottom is in!- first ever White Stripe present on the 3W which is a very high time-frame
- Eth has experienced a more than 60% drop ever since the highs with no real relief inbetween
- at the very least, a strong bounce to 2400, 2500 is expected
- there is also the possibility that this is THE bottom before eventually Eth makes new ATHs, possibly this but probably next year

$ETH Bullish Set up Ethereum just started bull move .Five wave move could take it to all time high of 17k .....

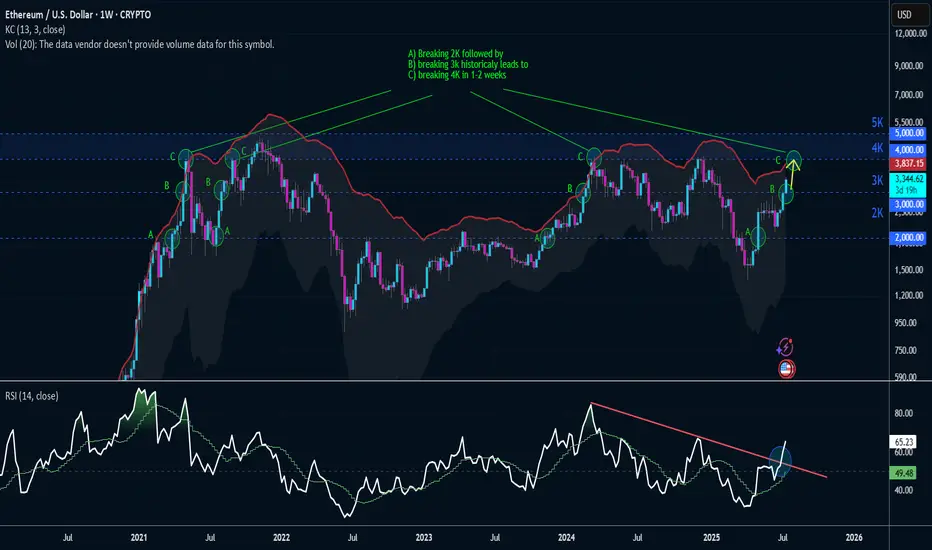
Next Stop -> 4K4 out of 4 historical times -> Ethereum has hit 4K in 1 to 2 weeks after breaking 2K and 3K sequentially.
ETHUSD-SELL strategy 9 hourly chart Reg.ChannelNo doubt Crypto is more volatile than other asset classes, and even when very overbought it can run higher. It does not change the over all picture, and recovery is required over time. The correction is like to bring us back towards $ 2,875 area overall, but in steps .
Strategy SELL @ $ 3,300-3,375 and take profit near $ 3,025 at first, and re-sell after for a profit near $ 2,875.
