Ethereum Outperforms Majors as Crypto Sentiment Shifts Again 🌐 Ethereum Outperforms Majors as Crypto Sentiment Shifts Again 🔄📊
Trump talks 401(k) crypto 🗞️, BTC reclaims the key $115,800 level 💪, but today we zoom into what the charts are screaming — and Ethereum is leading.
While headlines fly, structure never lies. Let’s compare ETH against other majors 👇
🔷 ETHUSD – The Breakout That Sparked It All
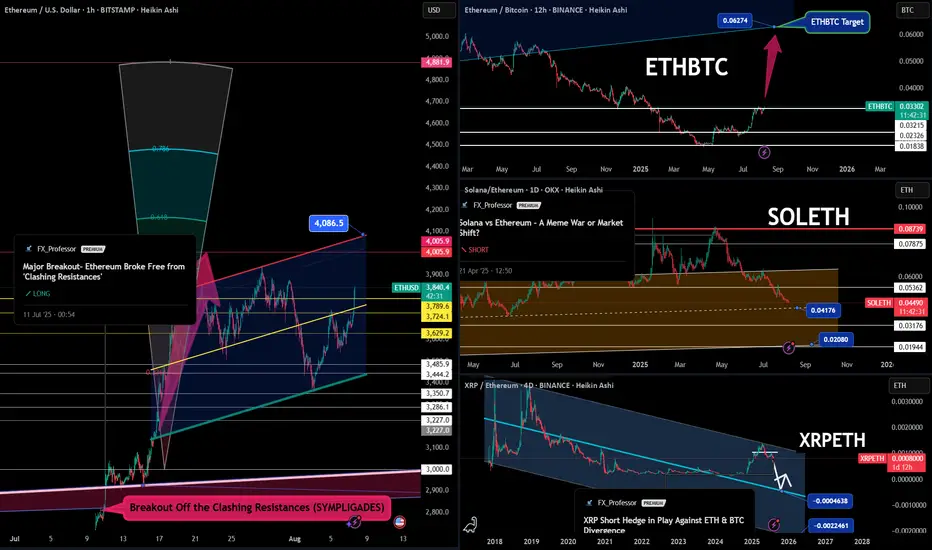
📈 ETH broke free from the "Clashing Resistances" zone (SYMPLIGADES).
It’s now targeting $4,086.5, with potential expansion toward $4,881.9 if momentum holds.
🟨 Key zones:
$3,744 = retest zone
$3,830 = resistance-turned-support
$4,005 = psychological milestone
The 1-2-3 model is alive and well.
And ETF news + BTC support is the fuel ETH needed. 🔥
📊 ETHBTC – The Hidden Strength Ratio
This is what most traders miss:
➡️ ETHBTC has been in stealth accumulation mode.
Now aiming for 0.06274 — a huge reclaim zone not seen since mid-2022.
This ratio matters because it signals altcoin rotation, not just price action.
💀 SOLETH – The Bleed Continues
We called it months ago:
Solana may have great tech (Rust, speed), but it’s paying the price for memecoin mania and diluted narrative.
SOLETH is in freefall — currently below 0.045, with support at 0.04176 and 0.02080 next if weakness continues.
ETH is eating market share back.
📉 XRPETH – Short Hedge in Play
XRPETH structure remains bearish.
Even after multiple divergence plays, XRP continues to underperform against both BTC and ETH.
Target zones:
🧊 0.00004638
🧊 0.00002246
XRP fans — this is not personal. This is chart-based reality.
🗞️ Don’t Forget the Macro Backdrop:
SEC just greenlit direct BTC/ETH usage in ETF flows
Trump hints at crypto-friendly 401(k) policies
China is brewing something (rumor or tumor — still unclear 😅)
BTC just reclaimed $115,800, setting sights on $122,795 → $132,595
This market isn’t waiting for confirmation — it’s moving based on structure.
🚫 What I Avoid in This Cycle:
❌ Memecoins (low trust, no ETF tailwind)
❌ GameFi (zero relevance right now)
❌ Ghost L1s (no users = no bids)
🧠 Final Take:
Ethereum is clearly leading the pack.
BTC is reclaiming its throne.
Solana is bleeding relative to ETH.
XRP is stuck in divergence hell.
So we trade the structure, not the hopium.
📈 Alt season won’t be a meme — it will be rotation-driven, narrative-backed, and ETF-aligned.
📽️ Full explanation in my previous video post — check it out if you want full breakdown on ETFs, ETH’s structural strength, and the geopolitical backdrop with China.
One Love,
The FXPROFESSOR 💙
Disclosure: I am happy to be part of the Trade Nation's Influencer program and receive a monthly fee for using their TradingView charts in my analysis. Awesome broker, where the trader really comes first! 🌟🤝📈
ETHEREUM trade ideas
might be going insanebasically ive been thinking way too much and i am trying to be in set and forget mode because i think this is what happens

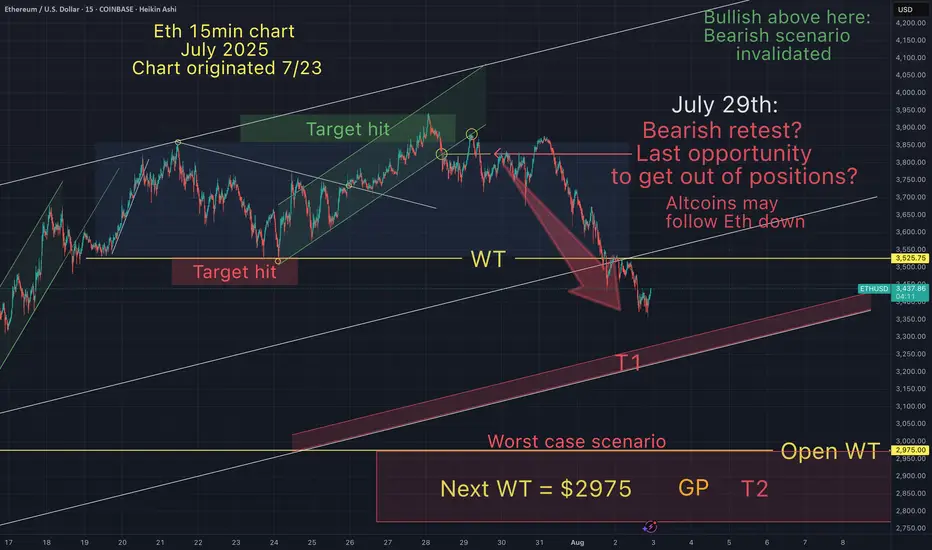
Is Eth still in a downward channel?On 7/23 I wrote:
"Eth will hit my red T1 target, bounce to the top of the current range (green T1)
then drop..."
So far these 2 targets were hit and target 3 (bearish T2) was off by 1%
7/24 Bearish T1 hit
7/28 Bullish T1 hit
8/3 Eth drops toward Bearish T2 (within 1%)
8/7 (Today) I will soon determine if this is a fakeout and my lower target gets hit, or if the bearish scenario will get invalidated and I will enter the remainder of my positions upon confirmation. Either way trading the initial range proved to be a success and I have a strategy moving forward.
I keep these stats for myself to track my accuracy. I also used to track influencer's predictions (when I first started many years ago). I would write notes on my charts, documenting each influencers predicitons and see how often they were correct. If not how do we really know if we should be following them?

ETH/USD – Critical Reversal Zone?
### 🚀 ETH/USD – Critical Reversal Zone?
**🔍 ETH Futures Multi-Model Signal | Consensus: LONG | Confidence: 77%**
---
**🧠 Key Highlights (DS + OA Model Consensus):**
* **Price:** \$3,375 → Trading *below* EMA9/SMA20 = short-term bearish, but hitting strong **support zone**
* **Support:** \$3,248 (Bollinger Lower) & \$2,987 (SMA50)
* **Resistance:** \$3,487 (EMA21), \$3,620 (SMA20)
* **Volume:** -10.3% (5D) → Selling **weakening**
* **RSI:** 49.5 → Neutral but oversold on short-term
* **MACD:** Bearish crossover, but showing **divergence**
* **Volatility:** Bollinger width 9.18% = **Breakout Setup**
---
### 📈 Trade Setup – Conditional LONG
| Entry | Stop Loss | Target | R/R | Confidence |
| ------- | --------- | ------- | ------ | ---------- |
| \$3,375 | \$3,229 | \$3,690 | 1:3.24 | 77% ✅ |
🪙 **Trade Type:** Scale-in (50% @ \$3,375, 50% @ \$3,275)
📊 **Take Profits:**
* TP1: \$3,485 (EMA21)
* TP2: \$3,590 (SMA20)
* TP3: \$3,690 (Weekly VWAP Anchor)
---
### ⚠️ Risk Dashboard
* 🚨 BTC < \$58K → Setup invalid
* 📉 No Open Interest Data – monitor liquidation triggers
* 🧠 Max Position Risk: **1.25%** | Use hard stop-loss
* ⏰ Entry Timing: **London Open (8:00 GMT)**
---
### 💬 TL;DR
ETH is sitting in a **high-confluence reversal zone**. Weak sell volume, macro bullish trend, and volatility contraction signal a potential bounce. 📊 **Risk-defined long** setup favored by both models.
🧠 “Smart money doesn’t chase — it positions early.”
---
📌 **#ETH #CryptoTrading #ETHUSDT #Futures #BreakoutSetup #BollingerBands #MACD #RSI #DeFi #Ethereum #CryptoSignals #TradingView**

Ethereum analysis by majidbabaeiasl I think Ethereum can correct to the $1,000 range due to the aggravations and reduced trading volume. The rise in a short time will save profits unless Ethereum reaches above $4,700, which I think is unlikely.

Ethereum (ETH/USD) Technical InsightsEthereum (ETH/USD) Technical Insights
**Chart Overview**
* **Current Price**: \~\$3,631
* **EMA 7 (Red Line)**: \$3,720.80
* **EMA 21 (Blue Line)**: \$3,522.96
* **Key Support Zone (Pink area)**: \~\$3,600–\$3,650
* **Support 1 (S1)**: \~\$2,950
* **Support 2 (S2)**: \~\$2,500
* **Uptrend Line**: Still intact, but under pressure
**Technical Insights**
* **Price Breakdown**: ETH has dropped below the **EMA 7**, and is now testing a **critical horizontal support zone** around **\$3,600–\$3,650**.
* **Trendline**: Still holds, but ETH is **hovering just above it**, signaling a potential bounce or breakdown.
* **EMA 21** near \$3,522 is the next short-term support if \$3,600 fails.
* **Momentum**: Recent candles show **strong selling**, indicating weakness, but no full breakdown yet.
**Bullish Scenario**
*Conditions**:
* Price **holds above** \$3,600–\$3,620 zone and the **trendline**
* **Bounce** with bullish daily candle from current zone or above \$3,650
**Buy Setup**:
* **Entry**: \$3,620–\$3,650 on confirmation
* **Stop-loss**: Below \$3,520 (just under EMA 21)
* **Targets**:
* TP1: \$3,720 (reclaim EMA 7)
* TP2: \$3,850–\$3,940
* TP3: \$4,100+
**Bearish Scenario**
**Conditions**:
* Price **breaks below** \$3,600 and **the trendline**
* EMA 21 is lost with strong bearish candle
**Sell Setup**:
* **Entry**: Below \$3,580 on breakdown
* **Stop-loss**: Above \$3,650
* **Targets**:
* TP1: \$3,520 (EMA 21)
* TP2: \$2,950 (S1)
* TP3: \$2,500 (S2)
**Bias: Neutral with Bearish Lean**
* **Decision Zone**: ETH is at a key inflection point
* Wait for **confirmation**: bounce or breakdown before entering

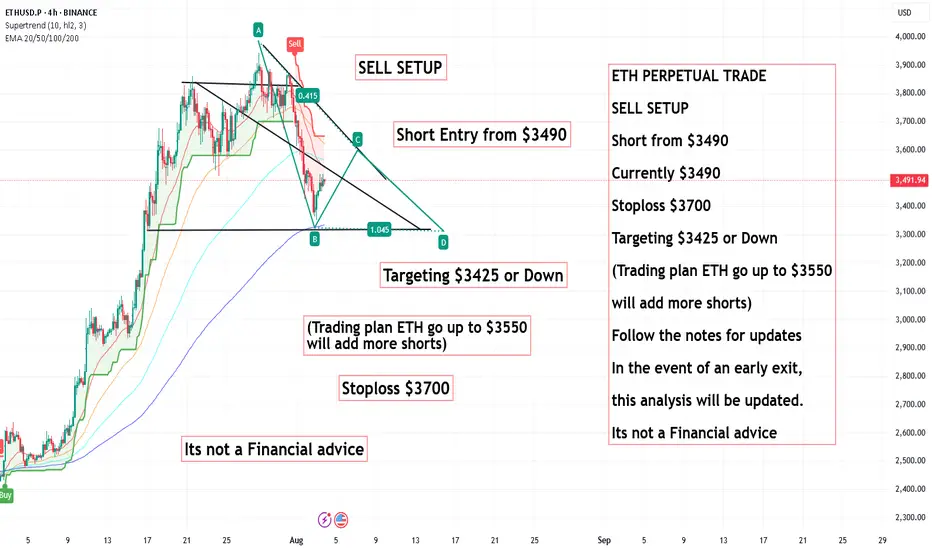
ETH PERPETUAL TRADE ,Short from $3490ETH PERPETUAL TRADE
SELL SETUP
Short from $3490
Currently $3490
Stoploss $3700
Targeting $3425 or Down
(Trading plan ETH go up to $3550
will add more shorts)
Follow the notes for updates
In the event of an early exit,
this analysis will be updated.
Its not a Financial advice
ETH eyes on $3431.83: Golden Genesis fib may END this SurgeETH finally got a surge after a long consolidation.
But has just hit a Golden Genesis fib at $3431.83
Like hitting a brick wall, it is now staggering back.
It is PROBABLE that we orbit this fib a few times.
It is POSSIBLE that we reject here to end the surge.
It is PLAUSIBLE that we Break-n-Retest to continue.
We were here at this EXACT spot 8 months ago:
=============================================
.

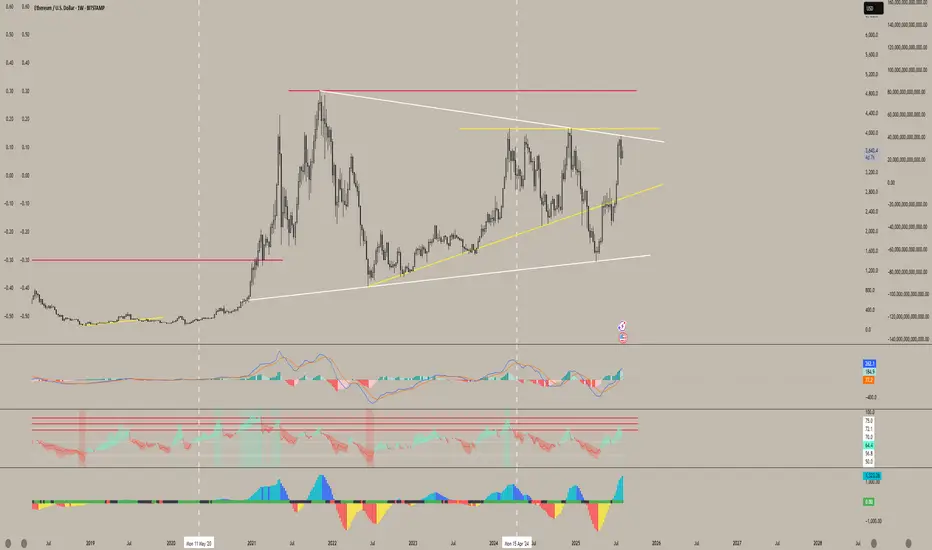
#ETH July Monthly Close: The Chart Everyone Should Watch#Ethereum just printed a very strong July candle.
We’re now flirting with the upper resistance of this multi-year triangle, and a monthly close above $3,800 would confirm the breakout.
That would unlock a measured move target > $8,000.
Momentum is already shifting, and the RSI broke out of its downtrend.
The setup is here.
Now let’s see the confirmation.
#crypto #trading #bitcoin

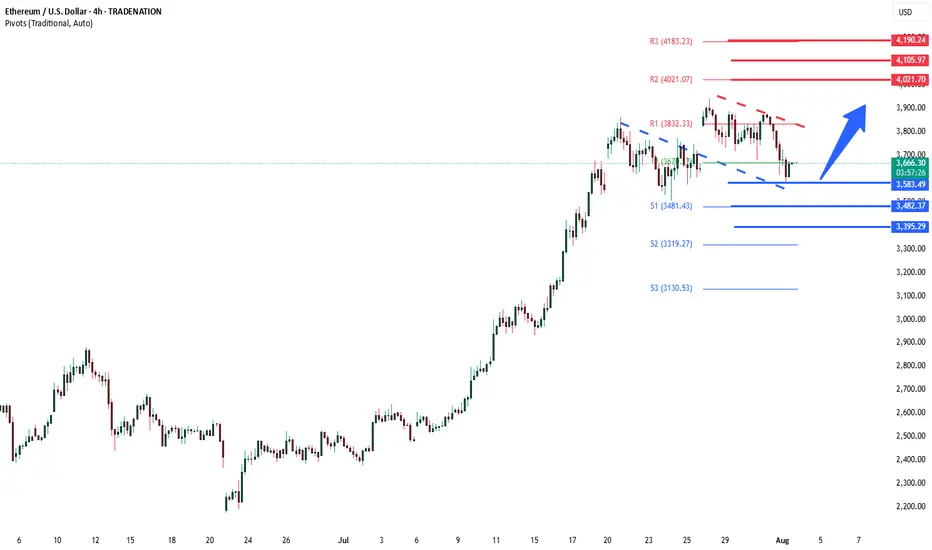
ETHUSD previous resistance new support The ETHSD remains in a bullish trend, with recent price action showing signs of a corrective pullback within the broader uptrend.
Support Zone: 3,667 – a key level from previous consolidation. Price is currently testing or approaching this level.
A bullish rebound from 3,667 would confirm ongoing upside momentum, with potential targets at:
4,020 – initial resistance
4,105 – psychological and structural level
4,190 – extended resistance on the longer-term chart
Bearish Scenario:
A confirmed break and daily close below 3,667 would weaken the bullish outlook and suggest deeper downside risk toward:
3,584 – minor support
3,482 – stronger support and potential demand zone
Outlook:
Bullish bias remains intact while the ETHUSD holds above 3,667. A sustained break below this level could shift momentum to the downside in the short term.
This communication is for informational purposes only and should not be viewed as any form of recommendation as to a particular course of action or as investment advice. It is not intended as an offer or solicitation for the purchase or sale of any financial instrument or as an official confirmation of any transaction. Opinions, estimates and assumptions expressed herein are made as of the date of this communication and are subject to change without notice. This communication has been prepared based upon information, including market prices, data and other information, believed to be reliable; however, Trade Nation does not warrant its completeness or accuracy. All market prices and market data contained in or attached to this communication are indicative and subject to change without notice.
ETHEREUM ELLIOTT WAVE: BULLISH MEGAPHONE BREAKOUT TO $10K? ETHUSD Analysis | Daily Timeframe
Current Price: $3,866
Bias: BULLISH 🟢 CONFIRMED
Pattern: Elliott Wave 5 + Bullish Megaphone
Status: 🔥 MOMENTUM BUILDING 🔥
THE SETUP - BULLISH CONFIRMATION
Elliott Wave Count:
✅ Wave 1: Completed at $4,100 (March 2024)
✅ Wave 2: Corrected to $1,600 (August 2024)
🔄 Wave 3: IN PROGRESS → Target $6,000-$6,200
⏳ Wave 4: Expected pullback to $2,800-$3,200
🎯 Wave 5: ULTIMATE TARGET $10,000+
Bullish Megaphone Pattern:
Expanding triangle since June 2022 low
Key breakout level: $4,100-$4,200 (APPROACHING)
Pattern height: $2,50
Measuring objective: $6,600
🎯 UPDATED PRICE TARGETS
T1: $4,700 (+21.6% gain) - 95% probability
T2: $5,290 (+36.8% gain) - 95% probability
T3: $6,245 (+61.5% gain) - 83.5% probability
🥈 SECONDARY TARGETS
T4: $7,200 (+86.2% gain) - 68% probability
T5: $8,745 (+126.2% gain) - 53% probability
🏆 MOONSHOT TARGET
T6: $10,000+ (+158.7% gain) - 16.8% probability
⚠️ UPDATED RISK MANAGEMENT
🛡️ SUPPORT LEVELS (Bull Market Invalidation)
S1: $3,737 (-3.3% from current) - 1st warning
S2: $3,648 (-5.6% from current) - 2nd warning
S3: $3,546 (-8.3% from current) - 3rd warning
S4: $3,356 (-13.2% from current) - MAJOR SUPPORT
🔴 STOP LOSS OPTIONS
Conservative: Below $3,356 (-13.2% risk)
Aggressive: Below $3,546 (-8.3% risk)
Tight: Below $3,737 (-3.3% risk)
🔥 UPDATED ENTRY STRATEGY
🟢 CURRENT ENTRY (RECOMMENDED)
Entry: $3,866 (current levels)
Stop: $3,356
Risk: -13.2%
R:R to T3: 1:4.7 (Excellent!)
🟡 BREAKOUT ENTRY
Entry: Above $4,200 (confirmation)
Stop: $3,737
Risk: -11.0%
R:R to T3: 1:4.4
🔵 PULLBACK ENTRY (If Available )
Entry: $3,450-$3,555 range
Stop: $3,356
Risk: -2.7%
R:R to T3: 1:18+ (Exceptional!)
🧠 ELLIOTT WAVE PSYCHOLOGY - ACCELERATION PHASE
Current Phase: Early Wave 3 🚀
Status: Momentum building toward breakout
Psychology: Growing recognition
Volume: Should expand on breakout
Participation: Institutional interest increasing
What's Happening NOW:
📈 Price approaching key resistance
📊 Volume building
🌊 Wave 3 characteristics emerging
💰 Smart money accumulating
🎪 MEGAPHONE PATTERN - BREAKOUT IMMINENT
Current Status:
📐 Price at 94% of breakout level
🔊 Volatility expanding as expected
⚡ Breakout catalyst building
🎯 $6,600 target on deck
Breakout Levels:
Resistance: $4,100-$4,200 (6.1-8.6% away)
Volume: Need 2x average on breakout
Target: $6,600 minimum (+70.7% gain)
🎲 UPDATED $10K PROBABILITY ANALYSIS
📊 SCENARIO BREAKDOWN (From $3,866)
🟢 Optimistic (40% probability)
Gain Required: +158.7%
Timeframe: 6-18 months
Catalyst: Parabolic Wave 5 + Major news
🟡 Moderate (25% probability)
Gain Required: +158.7%
Timeframe: 1-2 years
Catalyst: Institutional adoption wave
🔴 Conservative (15% probability)
Gain Required: +158.7%
Timeframe: 2-3 years
Catalyst: Extended crypto bull market
📈 WEIGHTED AVERAGE: 24%
🎯 RISK-ADJUSTED: 16.8%
🔍 IMMEDIATE CATALYSTS TO WATCH
🟢 BULLISH MOMENTUM DRIVERS
✅ Price approaching breakout zone
✅ Elliott Wave 3 acceleration
✅ Institutional accumulation
✅ DeFi TVL growth
✅ Layer 2 adoption
⚠️ NEAR-TERM RISKS
🔴 Rejection at $4,100-$4,200
🔴 Bitcoin correlation breakdown
🔴 Macro headwinds
🔴 Profit-taking pressure
📅 UPDATED TIMELINE EXPECTATIONS
📍 Next 2-4 weeks: Test $4,100-$4,200 breakout
📍 Q4 2025: Rally to $6,000-$6,200 (if breakout)
📍 Q1 2026: Potential Wave 4 correction
📍 Q2-Q4 2026: Wave 5 extension → $10,000+ potential
💡 UPDATED TRADING PLAN
🎯 POSITION SIZING (From $3,866)
Core Position: 60% at current levels (PRIORITY)
Breakout Add: 25% above $4,200
Pullback Add: 15% on any dip to $3,450-$3,555
💰 PROFIT TAKING STRATEGY
20% at $4,700 (lock in +21.6%)
25% at $5,290 (secure +36.8%)
25% at $6,245 (major target +61.5%)
30% HODL for $10K+ (moonshot +158.7%)
⏰ TIME MANAGEMENT
Immediate: Watch for $4,200 breakout
Short-term: Reassess if below $3,737
Long-term: Major review if below $3,356
🚨 URGENT UPDATE SUMMARY
🔥 WHAT CHANGED:
Price up +5.2% to $3,866 (bullish confirmation)
Now only 6.1% from key breakout at $4,100
Risk/reward ratios improved significantly
Momentum building toward critical resistance
⚡ IMMEDIATE ACTION:
BUY SIGNAL ACTIVE at current levels
Stop loss: $3,356 (-13.2% risk)
First target: $4,700 (+21.6% gain)
R:R = 1:4.7 (Excellent setup!)
🎯 KEY LEVEL TO WATCH:
$4,100-$4,200 = Make or break zone
Break above = Explosive move to $6,600+
Rejection = Pullback to $3,450-$3,555
🔮 BOTTOM LINE - UPDATED
The Setup: Even stronger! Price action confirming Elliott Wave count with momentum building toward the critical $4,100-$4,200 breakout zone.
The Opportunity: Now at $3,866, we're positioned perfectly for the next leg up. Risk/reward of 1:4.7 to major target is exceptional.
The Risk: Manageable at -13.2% to major support at $3,356.
The Play: BUY NOW - This is the sweet spot before the breakout. Scale in aggressively at current levels.
📊 UPDATED CHART FOCUS
🎯 CURRENT PRICE: $3,866 (+5.2% momentum)
📈 IMMEDIATE TARGET: $4,200 breakout (+8.6%)
🚀 HIGH PROBABILITY: $6,245 (+61.5%)
🌙 MOONSHOT: $10,000+ (+158.7%)
🛡️ STOP LOSS: $3,356 (-13.2%)
⚡ PATTERN: Bullish Megaphone + Elliott Wave 3
🚨 TRADE ALERT: BUY SIGNAL ACTIVE 🚨
Entry: $3,866 (NOW)
Stop: $3,356
Target 1: $4,700
Target 2: $6,245
Moonshot: $10,000+
⚠️ DISCLAIMER: This analysis is for educational purposes only. Cryptocurrency trading involves substantial risk. Always do your own research and never risk more than you can afford to lose.

ETHSimple chart :
- Don’t fight the trend, just stick to your strategy.
- follow the signs.
- Never go all in and always DCA.
Only this way we will learn to master our emotions.
Happy Tr4Ding !

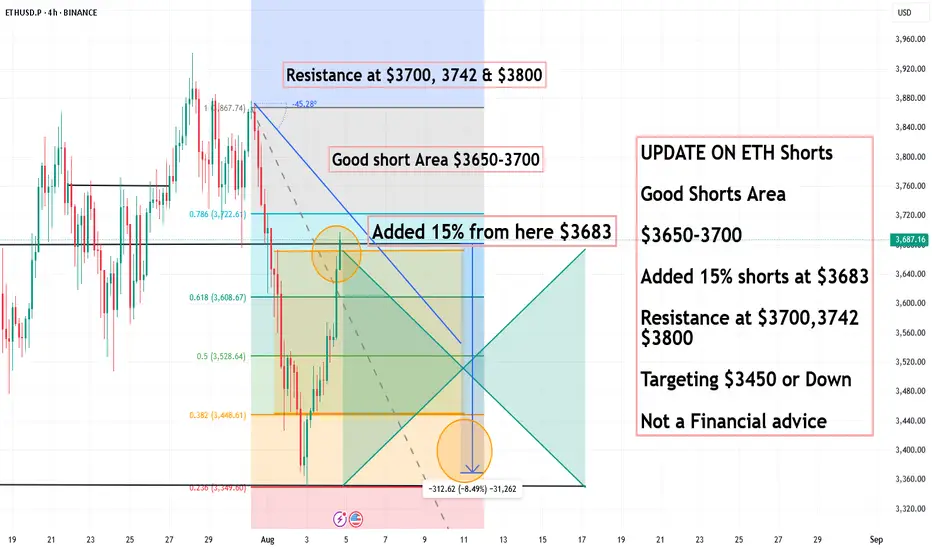
UPDATE ON ETH Shorts, Good Shorts Area $3650-3700UPDATE ON ETH Shorts
Good Shorts Area
$3650-3700
Added 15% shorts at $3683
Resistance at $3700,3742
$3800
Targeting $3450 or Down
Not a Financial advice
Bullish potential detected for EthereumEntry conditions:
(i) higher share price for COINBASE:ETHUSD along with MACD crossover on the 4 hour chart at the low end of the scale with histogram crossover zero,
(ii) bounce off potential support zones of 15 min / 1 hour and 4 hour intraday timeframes, and
(iii) observation of market reaction at these support zones.
Stop loss for the trade would be below the ultimate support level from the open of 22nd January (i.e.: below $3327.56).

Ethereum Not Dead- i know some peoples think ETH will go to 250$ or 500$, so wait for it...
- I've always maintained that I'm not a fan of ETH because of its scalability limitations and centralization, for that reason ETH needs some messy L1...L2...etc..
- That said, my opinion doesn’t matter much, ETH is here to stay. The Ethereum ecosystem hosts thousands of projects; I’d say it’s too big to fail.
- i used Bitstamp exchange to look further back in the chart's history.
- i simplified this monthly chart so much that even a 10 year old kid could understand it, just check the RSI low levels and compare it with previous years. Again, check the max RSI level for the previous ATHs.
- i won't discuss where to buy because, whether you get ETH at $1,800 or $1,500, the bull run for ETH and Altcoins hasn't started yet.
Happy Tr4Ding !

Ethereum – The Next Leg Up?🚀 Ethereum – The Next Leg Up? 🚀
At WaverVanir International LLC, our models are detecting a high-probability continuation pattern on ETH/USD.
Price has reclaimed the 0.886 Fibonacci zone (~$3,733) with conviction, aligning with our liquidity mapping protocol’s bullish bias.
Key Levels We’re Watching:
Immediate Support: $3,733 (0.886 Fib)
Primary Target Zone: $5,381 – $5,501 (1.618–1.786 Fib extension)
Invalidation: Sustained close below $3,399 (previous structural pivot)
Why This Matters:
Breakouts above 0.886 tend to trigger accelerated moves toward the 1.618 extension.
Macro liquidity conditions remain supportive, with capital rotation favoring high-beta assets like Ethereum.
This move aligns with VolanX’s projected momentum arc (see red trajectory).
📊 At WaverVanir, we don’t just chart—we engineer precision trading intelligence.
Our VolanX Engine continuously recalibrates targets based on institutional order flow, macro shifts, and probabilistic modeling.
🔗 Actionable Insight: If momentum holds above $3,733, the path toward $5.5K could materialize faster than consensus expects.
#Ethereum #ETHUSD #WaverVanir #VolanX #CryptoTrading #LiquidityIntelligence #Fibonacci #AITrading

ETH is knocking like Walter White on that $4K levelOnce we break past this point, there’s little to no resistance-we should all be expecting an all-time high. Altcoins are going to melt people’s faces off when we break past $4K. With rate cuts anticipated, don’t miss out on this move.
ETH is holding extremely strong right now in relation to BTC, while other altcoins are still seeking their lows for this cycle. With rate cuts expected in September, ETF flows, and growing institutional interest, I believe ETH will have a crazy rally.
Once we break past this resistance from the trendline dating back to the 2021 high and close above $4K, I think we’ll start to see ETH blow past Bitcoin-and altcoins will follow.
I still believe ETH will outperform others for now, but once we get those rate cuts, I feel the bleeding will stop-and by then, the ship will have sailed.
ETHUSD Is Going Up! Buy!
Here is our detailed technical review for ETHUSD.
Time Frame: 2h
Current Trend: Bullish
Sentiment: Oversold (based on 7-period RSI)
Forecast: Bullish
The market is on a crucial zone of demand 3,601.00.
The oversold market condition in a combination with key structure gives us a relatively strong bullish signal with goal 3,751.96 level.
P.S
Please, note that an oversold/overbought condition can last for a long time, and therefore being oversold/overbought doesn't mean a price rally will come soon, or at all.
Disclosure: I am part of Trade Nation's Influencer program and receive a monthly fee for using their TradingView charts in my analysis.
Like and subscribe and comment my ideas if you enjoy them!

Bull Idea for ETHUSD Repeating dip before price launch along this imaginary drawn channel
Possible for a third wave up after this 'dip' phase?
Weekly timeframe

ETH Derivatives Indicate Bearish Sentiment
A closer look at Ethereum's derivatives landscape reveals growing caution in the market. The 25-delta risk reversals on ETH options for August and September are trading between -2% and -7%, signaling a rising demand for downside protection. In comparison, BTC's risk reversals sit at a milder -1% to -2.5%.
Futures data adds to the picture: ETH open interest is at $47.5B, but key exchanges like Bitget and Hyperliquid show significant drops in long/short ratios (-9.08% and -9.35%). Meanwhile, Binance maintains a relatively low long/short ratio at 0.39, reflecting increasing short interest.
Despite ETH’s impressive 48% rally in July, recent price action has weakened, down 6% in 24h. This divergence between spot price behavior and derivatives sentiment may point to an upcoming correction.
⚠️ Worth watching closely: A break below $3,500 could trigger a sharper unwind of bullish positioning.

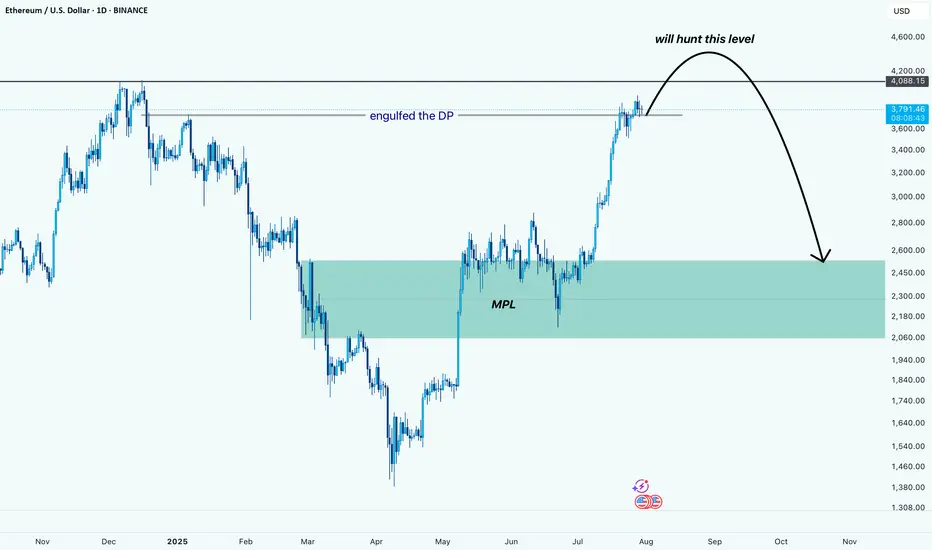
ETH (just a perspective): Potential Liquidity Grab Before DeeperPrice has engulfed the DP and is now pushing higher. Based on the current structure, it looks like ETH wants to hunt the liquidity resting above the $4,080 level.
After grabbing that liquidity, we might see a sharp reversal back down toward the MPL, which sits in the $2,100–$2,500 zone. This area is a strong demand zone and also where the most pain would be felt for late buyers, making it a key level to watch.
⚠️ This is not a prediction, just a perspective based on price behavior and structure.
Eth - The descent confirmed. Next target is lower.Recap
-------
On my July 23rd chart I wrote:
"In a bull market the average retrace is between .2 -.4 Fib from the bottom of that run.
Several factors of confluence lead me to believe Eth will hit my red T1 target, bounce to the top of current range (green T1) then drop to a minimum of .35 Fib = $2990".
On July 28th I wrote:
"As anticipated, my bearish T1 target (red) was hit soon after I first posted this chart on July 23rd 2025.
As the arrow indicated, Eth would bounce from my bearish T1 (red) to my bullish T1 (green). This has been confirmed in both price and in the timeframe indicated by my boxes.
There was also a downward arrow from my green T1 pointing towards my bearish T2 (red). Eth is already retracing from my top target, and I belive it will now continue down the red channel towards T2 and possibly T3 (between $2990 - $3200)".
On July 29th on the chart titled "Has Eth begun it's descent?", I wrote:
"On July 23rd, I anticipated that Eth would dump once it took out the range high.
Now that we have witnessed that, along with a bearish retest (as indicated on chart),
I believe the descent has begun. I hope I'm wrong.
But if I'm right, it will provide me with an amazing entry point around $2900-3200"
Aug 2nd:
Eth has crashed 15%. The descent has begun.
ETHUSDT BUYING SETUP !Ethereum (ETHUSDT) is showing a bullish setup as price holds above key support. The market is indicating buyer interest, and a push upward could be expected if momentum continues.
Look for confirmation like bullish candlesticks or a breakout from consolidation before entering. This setup offers a good risk-to-reward opportunity for buyers.
Stay focused, trade with confirmation, and manage your risk properly! 📈🔥
