Bearish on ETH! Price has tested and retested the daily sellers order blocking creating a triple top bearish reversal pattern, which was then swept of liquidity. From there, Price broke below the neckline of the triple top and retested the now formed resistance at the 2,450 level. Also in this move we can see a daily bearish trendline that is being respected. This screams bearish sentiments to me, so I will be selling!
ETHEREUM trade ideas

Has BTC.D Topped?All... based on the trend structure, it looks like bitcoin dominance may have topped. If so, we should see some fun price action start to happen over the next 2 weeks. ETH/BTC ratio should start to increase, USDT.D should start to drop, and TOTAL should start to increase as well.
Stand fast. Keep faith. Remain vigilant.

Ethereum monthly cup and handleSoooo, this is my first post, and I'm not really too sure if I'm seeing this correctly, can somebody please explain to me why I'm wrong or if I'm right. Cuzzzzz this seems extremely bullish to me.
This is on the monthly timeframe, so this projection is for closer to November - February, IMO...
AM I SEEING THIS CORRECTLY, or is this my bullish personality shining through.


Chart Pattern Analysis Of ETH.
K2 verified a potential fake down of K1.
And,the supply pressure near the neck line keep decreasing.
It seems that K6 will choose to break up or fall down.
If the following candles close upon the neck line,
I will try to buy in.
If the following candles close below K3,
The risk will sharply increase.
Long-2388/Stop-2345/Target-2800
Long-2420/Stop-2345/Target-2800
Long-2488/Stop-2345/Target-2800

IS Ethereum AWAITING A MAJOR CRASH? CRASH TO USD 660 ? THE GREAT EARTHQUAKE OF THE CRYPTO WORLD IS COMING, WINTER IS COMING, JUNE 28, 2025... THE BIG SHORT !
Technical analysis of Ethereum, which is introduced as the silver of the crypto world, shows that a serious crash infrastructure has formed.
1. The most important technical data is the formation of a double top formation in monthly-weekly charts.
2. The low performance it has shown against the rise of Bitcoin is remarkable.
3. Again, it is the gartley pattern that is operated insidiously in long-term charts.
1. Target: 660 USD (I expect a reactive buying reaction that will then extend to 1200 dollars)
2. Target: 66 USD (It's embarrassing to say this, but the crypto world is a soap bubble. However, I personally do not see Ethereum as an investment vehicle in the long term.)
I AM AWARE THAT MAKING A 66 DOLLAR ETHEREUM ANALYSIS ON JUNE 28, 2025 IS A CRAZY THING, BUT I THINK THIS DOWN FORMATION HAS BEEN FORMED.
IT SEEMS THAT SIX IS A LUCKY NUMBER FOR MR. Vitalik . WHAT ABOUT YOU?
THIS IS NOT AN INVESTMENT ADVICE. IT IS ONLY A FINANCIAL PERSONAL STUDY FOR EDUCATIONAL PURPOSES. IT IS A PERSONAL ESTIMATE. THERE IS ABSOLUTELY NO GUARANTEED ACCURACY. ALL INVESTORS MUST MAKE THEIR OWN ANALYSIS.


ETHUSD is moving within the 2110.00 - 2550.00 range 👀 Possible scenario:
Ethereum is holding above the key $2,400 level, trading at $2,450, despite a 7.45% drop over the past 30 days and a 5% weekly loss. Staying above this support keeps ETH within the range it’s held since early May.
On-chain data shows strong accumulation: whales bought 1 million ETH on June 16 — the biggest daily purchase since 2018. Spot ETFs also saw $232.4M in inflows over three days, signaling rising retail interest. While Q3 is typically weak for ETH, current momentum suggests bullish potential. A firm move above $2,400 could set the stage for a test of the range highs.
✅ Support and Resistance Levels
Support levels are now located at 2,110.00 and 2,400.00.
Now, the resistance level is located at 2,550.00.

ETH 4H – Testing the 200W MA
ETH is trying to reclaim the 200-week MA on the 4H chart.
The last 4H candle closed right on top of it.
The first 4H bar from June 26 closed above the 0.5 Fib, but that level was eventually lost.
If the 200W MA holds as support, price may attempt to flip the 0.5 Fib into support again.
Always take profits and manage risk.
Interaction is welcome.

Ethereum H4 | Resistance at 78.6% Fibonacci retracementEthereum (ETH/USD) is rising towards a pullback resistance and could potentially reverse off this level to drop lower.
Sell entry is at 2,551.80 which is a pullback resistance that aligns closely with the 78.6% Fibonacci retracement.
Stop loss is at 2,700.00 which is a level that sits above the 127.2% Fibonacci extension and an overlap resistance.
Take profit is at 2,364.35 which is a pullback support.
High Risk Investment Warning
Trading Forex/CFDs on margin carries a high level of risk and may not be suitable for all investors. Leverage can work against you.
Stratos Markets Limited (tradu.com ):
CFDs are complex instruments and come with a high risk of losing money rapidly due to leverage. 63% of retail investor accounts lose money when trading CFDs with this provider. You should consider whether you understand how CFDs work and whether you can afford to take the high risk of losing your money.
Stratos Europe Ltd (tradu.com ):
CFDs are complex instruments and come with a high risk of losing money rapidly due to leverage. 63% of retail investor accounts lose money when trading CFDs with this provider. You should consider whether you understand how CFDs work and whether you can afford to take the high risk of losing your money.
Stratos Global LLC (tradu.com ):
Losses can exceed deposits.
Please be advised that the information presented on TradingView is provided to Tradu (‘Company’, ‘we’) by a third-party provider (‘TFA Global Pte Ltd’). Please be reminded that you are solely responsible for the trading decisions on your account. There is a very high degree of risk involved in trading. Any information and/or content is intended entirely for research, educational and informational purposes only and does not constitute investment or consultation advice or investment strategy. The information is not tailored to the investment needs of any specific person and therefore does not involve a consideration of any of the investment objectives, financial situation or needs of any viewer that may receive it. Kindly also note that past performance is not a reliable indicator of future results. Actual results may differ materially from those anticipated in forward-looking or past performance statements. We assume no liability as to the accuracy or completeness of any of the information and/or content provided herein and the Company cannot be held responsible for any omission, mistake nor for any loss or damage including without limitation to any loss of profit which may arise from reliance on any information supplied by TFA Global Pte Ltd.
The speaker(s) is neither an employee, agent nor representative of Tradu and is therefore acting independently. The opinions given are their own, constitute general market commentary, and do not constitute the opinion or advice of Tradu or any form of personal or investment advice. Tradu neither endorses nor guarantees offerings of third-party speakers, nor is Tradu responsible for the content, veracity or opinions of third-party speakers, presenters or participants.

bearish reversal off pullback resistance?The Ethereum (ETH/USD) has rejected off the pivot and could drop to the 1st support that aligns with the 61.8% Fibonacci retracement.
Pivot: 2,483.49
1st Support: 2,289.88
1st Resistance: 2,587.09
Risk Warning:
Trading Forex and CFDs carries a high level of risk to your capital and you should only trade with money you can afford to lose. Trading Forex and CFDs may not be suitable for all investors, so please ensure that you fully understand the risks involved and seek independent advice if necessary.
Disclaimer:
The above opinions given constitute general market commentary, and do not constitute the opinion or advice of IC Markets or any form of personal or investment advice.
Any opinions, news, research, analyses, prices, other information, or links to third-party sites contained on this website are provided on an "as-is" basis, are intended only to be informative, is not an advice nor a recommendation, nor research, or a record of our trading prices, or an offer of, or solicitation for a transaction in any financial instrument and thus should not be treated as such. The information provided does not involve any specific investment objectives, financial situation and needs of any specific person who may receive it. Please be aware, that past performance is not a reliable indicator of future performance and/or results. Past Performance or Forward-looking scenarios based upon the reasonable beliefs of the third-party provider are not a guarantee of future performance. Actual results may differ materially from those anticipated in forward-looking or past performance statements. IC Markets makes no representation or warranty and assumes no liability as to the accuracy or completeness of the information provided, nor any loss arising from any investment based on a recommendation, forecast or any information supplied by any third-party.

$ETH – Three Possible Scenarios in the Near FutureCRYPTOCAP:ETH – Three Possible Scenarios in the Near Future:
🔹 Optimistic: Rally towards $4,400
🔹 Conservative: Growth to $2,800
🔹 Pessimistic: Drop to $2,000
🚨 Key Levels to Watch:
▪️ $2,675 — breakout above this level could open the path to $2,800 – $2,900
▪️ $2,900 — breakout here may lead ETH toward $4,000
▪️ $4,150 — breakout of this level may push ETH to $4,400
▪️ $2,100 — if this level breaks downward, it may lead ETH to $1,400 – $1,500

15 R:R setup for EthereumWe assume that this marks the beginning of a new uptrend for BTC. This setup offers an easy 15:1 risk-to-reward ratio.
Entry: 2534
Stop Loss: 2373.33
Target: 5000
This is for educational purposes only.

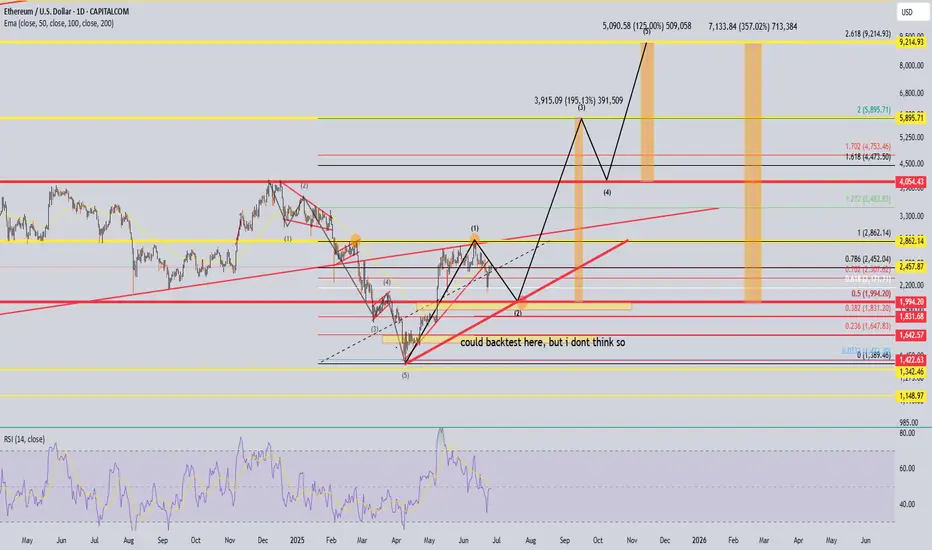
Eth 357% tradeI see a cup and handle forming. Hopefully we get some triangle and it breaks out. I put my bets at the 0.5 fib (level 1994.20) Nice 357% mamacitas!!
A Week Ahead: 23.06.2025 – 29.06.2025 | Key Events to WatchMonday, June 23
EU PMI Index – key for EUR
US PMI Index – key for USD
Tuesday, June 24
Canada CPI – important for CAD
Fed Chair Powell Testimony – high-impact event for USD and US stock markets
Wednesday, June 25
Fed Chair Powell Testimony continues – markets will look for monetary policy clues
Thursday, June 26
US GDP Q1 – key for USD
Friday, June 27
UK GDP Q1 – important for GBP
Japan Retail Sales, Unemployment, CPI – important for JPY
Canada GDP – important for CAD
US Personal Income and Spending – key for USD and US stock market
Summary: This week is packed with macroeconomic data and Powell’s testimony, which could shake the USD, CAD, JPY, GBP, and US stocks.

ETH on resistance.Ethereum 2 possible probabilities. 1 shows back demand level around 2100$ the other is a break of 2500$ and retest.

Ethereum is still bullish!#ETH
The price is moving within a descending channel on the 30-minute frame and is expected to break and continue upward.
We have a trend to stabilize above the 100 moving average once again.
We have a downtrend on the RSI indicator that supports the upward move with a breakout.
We have a support area at the lower boundary of the channel at 2450, acting as strong support from which the price can rebound.
We have a major support area in green that pushed the price upward at 2400.
Entry price: 2460.
First target: 2485.
Second target: 2510.
Third target: 2543.
To manage risk, don't forget stop loss and capital management.
When you reach the first target, save some profits and then change your stop order to an entry order.
For inquiries, please comment.
Thank you.

#ETH/USDT#ETH
The price is moving within a descending channel on the 1-hour frame, adhering well to it, and is on its way to breaking it strongly upwards and retesting it.
We are seeing a rebound from the lower boundary of the descending channel, which is support at 2427.
We have a downtrend on the RSI indicator that is about to break and retest, which supports the upward trend.
We are looking for stability above the 100 moving average.
Entry price: 2447
First target: 2476
Second target: 2500
Third target: 2533

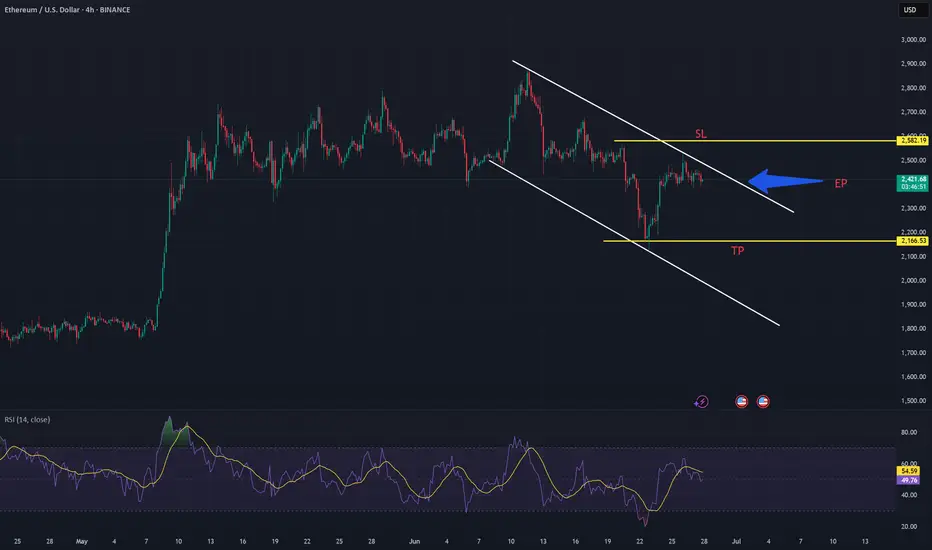
ETH/USDT 4H – Bearish Breakout OpportunityA symmetrical triangle pattern has formed and recently broke out to the downside, indicating a potential short-selling opportunity. We've marked the Sell Entry Point and the Target Point at $2,174.07 based on the pattern projection. Price action confirms the move,
Risk management is key – trade responsibly!
👥 Share your thoughts in the comments below – I’d love to hear your opinion on this setup.
❤️ If you found this idea useful, don’t forget to like and support!

ETH$USDTAs per trend made on ETH of 16 bar of range 01 jun23 to 1 oct 23 it will be follows 01 mar 25 to 01 July 25 at touch level around 3334.66

ETH one more Dump Before Parabolic Move!We see the 200 EMA crossing the 50 EMA which is a bearish sign, also eth is respecting the descending broadening wedge formation that has played out. I see eth doing one more dive to collect the vector zones mapped out below our current price action, and bouncing around 1900 before going absolutely insane this will be one last scary drop to shake out the weak hands and trap all the late longs from the runup from 1800 to about 2600. This will wreck all the people who bought between 2400-2800 and cause them to sell, allowing big players to buy more Eth at low prices before the altseason kicks in full gear by late summer.

Significant level in play on ETH/USDI intend to keep the following post concise and to the point.
As exhibited on the daily timeframe of ETH/USD (Ethereum versus the US dollar), price recently shook hands with support from US$2,332. Not only does this base serve as a historically significant barrier, but it also coincides with the 50-day simple moving average at US$2,305 and a trendline support, extended from the low of US$1,381.
Given the current support in play, I am closely monitoring the overhead decision point zone at US$2,571 – US$2,450. It was within this area that a ‘decision’ was made to whipsaw through the noted support area. Consequently, if price engulfs the said decision point, this could unearth a short-term bullish scenario towards resistance at US$2,813.
Written by FP Markets Chief Market Analyst Aaron Hill
