ETHUSD Is Very Bullish! Buy!
Take a look at our analysis for ETHUSD.
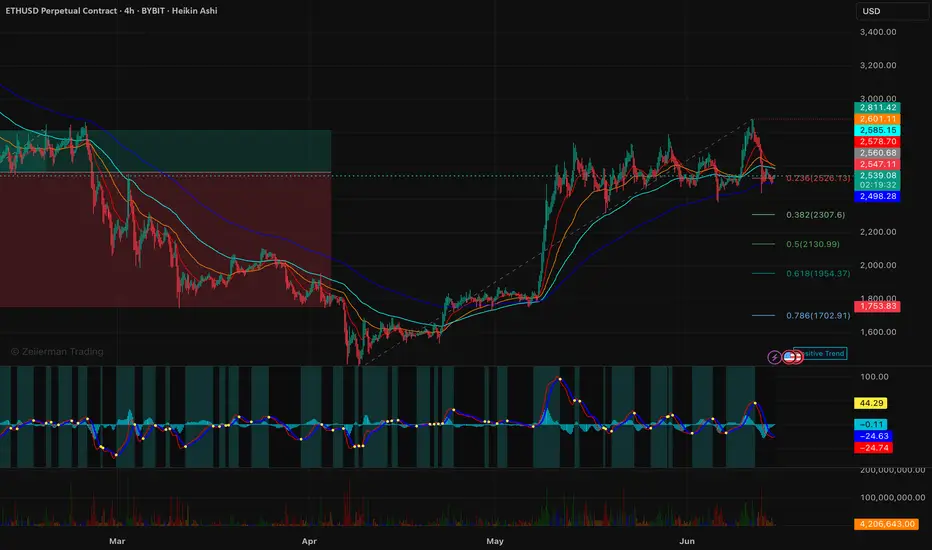
Time Frame: 10h
Current Trend: Bullish
Sentiment: Oversold (based on 7-period RSI)
Forecast: Bullish
The market is on a crucial zone of demand 2,508.60.
The oversold market condition in a combination with key structure gives us a relatively strong bullish signal with goal 2,717.66 level.
P.S
Please, note that an oversold/overbought condition can last for a long time, and therefore being oversold/overbought doesn't mean a price rally will come soon, or at all.
Disclosure: I am part of Trade Nation's Influencer program and receive a monthly fee for using their TradingView charts in my analysis.
Like and subscribe and comment my ideas if you enjoy them!
ETHEREUM trade ideas

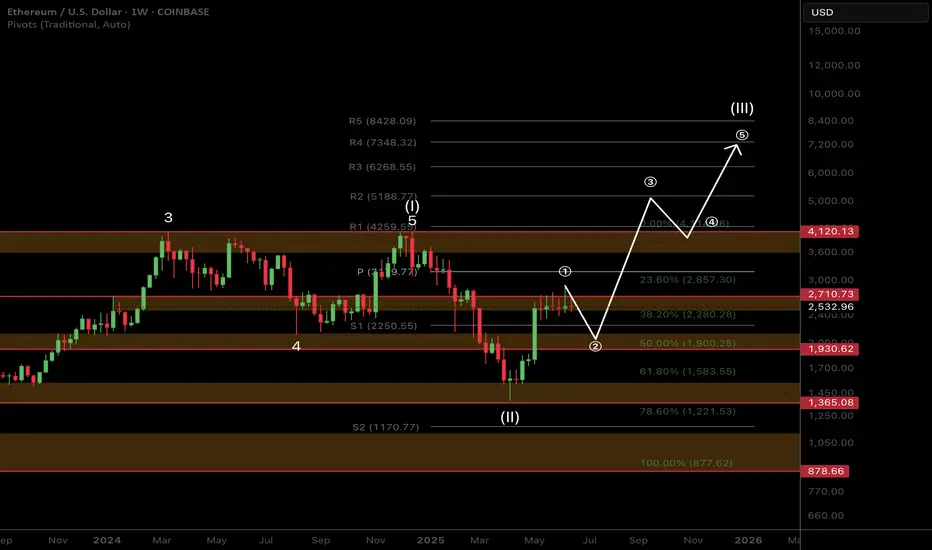
ETH Macro Analysis☕ 𝙂𝙈. CRYPTOCAP:ETH Macro analysis update...
📈 𝙇𝙤𝙣𝙜 𝙩𝙚𝙧𝙢 outlook remains unchanged and recent price action printing a doji. Target is still $7k for this cycle.
📉 𝙎𝙝𝙤𝙧𝙩 𝙩𝙚𝙧𝙢 outlook has investors looking lower towards the $1900 target but this isn't guaranteed to be reached and price action may front tat $2200.
War escalation's and retail selling are keeping price suppressed. ETF inflows and staking continue to grow!
The time for patience continues. Money is made in the sitting, weathering volatility, not flipping in and out of trades on every bit of news and price movement
𝙏𝙚𝙘𝙝𝙣𝙞𝙘𝙖𝙡 𝘼𝙣𝙖𝙡𝙮𝙨𝙞𝙨
Price is consolidating at its recent highs. Consolidation under resistance has high probability of breaking out, the longer it remains the higher the probability.
Elliot Wave (EW) analysis suggests a motif wave ended at the $2700 resistance, with a wave 2 retracement underway, likely a shallow one.
Safe trading
#ETH/USDT#ETH
The price is moving within a descending channel on the 1-hour frame, adhering well to it, and is heading toward a strong breakout and retest.
We are experiencing a rebound from the lower boundary of the descending channel, which is support at 2460.
We are experiencing a downtrend on the RSI indicator, which is about to break and retest, supporting the upward trend.
We are heading toward stability above the 100 moving average.
Entry price: 2540
First target: 2582
Second target: 2646
Third target: 2717

Potential bearish drop?Ethereum (ETH/USD) is rising towards the pivot and could reverse to the pullback support.
Pivot: 2,590.30
1st Support: 2,455.59
1st Resistance: 2,650.86
Risk Warning:
Trading Forex and CFDs carries a high level of risk to your capital and you should only trade with money you can afford to lose. Trading Forex and CFDs may not be suitable for all investors, so please ensure that you fully understand the risks involved and seek independent advice if necessary.
Disclaimer:
The above opinions given constitute general market commentary, and do not constitute the opinion or advice of IC Markets or any form of personal or investment advice.
Any opinions, news, research, analyses, prices, other information, or links to third-party sites contained on this website are provided on an "as-is" basis, are intended only to be informative, is not an advice nor a recommendation, nor research, or a record of our trading prices, or an offer of, or solicitation for a transaction in any financial instrument and thus should not be treated as such. The information provided does not involve any specific investment objectives, financial situation and needs of any specific person who may receive it. Please be aware, that past performance is not a reliable indicator of future performance and/or results. Past Performance or Forward-looking scenarios based upon the reasonable beliefs of the third-party provider are not a guarantee of future performance. Actual results may differ materially from those anticipated in forward-looking or past performance statements. IC Markets makes no representation or warranty and assumes no liability as to the accuracy or completeness of the information provided, nor any loss arising from any investment based on a recommendation, forecast or any information supplied by any third-party.

$ETHAs stablecoins gain real-world adoption, CRYPTOCAP:ETH demand might explode.
Why? Most stablecoins are backed or run on Ethereum.
People can spend stablecoins while keeping ETH locked not sold.
This creates real utility for ETH… and tightens its supply.
#Ethereum #ETH #Stablecoins #DeFi #Crypto
Ethereum H1 | Potential bearish reversalEthereum (ETH/USD) is rising towards a pullback resistance and could potentially reverse off this level to drop lower.
Sell entry is at 2,543.15 which is a pullback resistance that aligns with the 38.2% Fibonacci retracement.
Stop loss is at 2,625.00 which is a level that sits above the 61.8% Fibonacci retracement and a swing-high resistance.
Take profit is at 2,451.35 which is a multi-swing-low support.
High Risk Investment Warning
Trading Forex/CFDs on margin carries a high level of risk and may not be suitable for all investors. Leverage can work against you.
Stratos Markets Limited (tradu.com ):
CFDs are complex instruments and come with a high risk of losing money rapidly due to leverage. 63% of retail investor accounts lose money when trading CFDs with this provider. You should consider whether you understand how CFDs work and whether you can afford to take the high risk of losing your money.
Stratos Europe Ltd (tradu.com ):
CFDs are complex instruments and come with a high risk of losing money rapidly due to leverage. 63% of retail investor accounts lose money when trading CFDs with this provider. You should consider whether you understand how CFDs work and whether you can afford to take the high risk of losing your money.
Stratos Global LLC (tradu.com ):
Losses can exceed deposits.
Please be advised that the information presented on TradingView is provided to Tradu (‘Company’, ‘we’) by a third-party provider (‘TFA Global Pte Ltd’). Please be reminded that you are solely responsible for the trading decisions on your account. There is a very high degree of risk involved in trading. Any information and/or content is intended entirely for research, educational and informational purposes only and does not constitute investment or consultation advice or investment strategy. The information is not tailored to the investment needs of any specific person and therefore does not involve a consideration of any of the investment objectives, financial situation or needs of any viewer that may receive it. Kindly also note that past performance is not a reliable indicator of future results. Actual results may differ materially from those anticipated in forward-looking or past performance statements. We assume no liability as to the accuracy or completeness of any of the information and/or content provided herein and the Company cannot be held responsible for any omission, mistake nor for any loss or damage including without limitation to any loss of profit which may arise from reliance on any information supplied by TFA Global Pte Ltd.
The speaker(s) is neither an employee, agent nor representative of Tradu and is therefore acting independently. The opinions given are their own, constitute general market commentary, and do not constitute the opinion or advice of Tradu or any form of personal or investment advice. Tradu neither endorses nor guarantees offerings of third-party speakers, nor is Tradu responsible for the content, veracity or opinions of third-party speakers, presenters or participants.

ETHUSD is moving within the 2390.00 - 2880.00 range 👀 Possible scenario:
The crypto market fell on June 17, with only 10 of the top 100 coins in the green. Total market cap dropped 2.1% to $3.45T, while trading volume surged to $118B. Ethereum (ETH) slipped 1.7% to around $2,550, retreating from an intraday high of $2,672. ETH is now attempting to reclaim the $2,610 level.
Fundamentals remain strong: U.S. spot Ether ETFs continue to accumulate ETH, with BlackRock’s ETHA holding nearly $650M. Staking yields, tokenized real-world assets, and DeFi infrastructure are also driving momentum.
However, June has historically been bearish for ETH. Data from CryptoRank shows it’s Ethereum’s second-worst month on average, with only three green Junes in 10 years. Analysts warn a drop below $2,500 could send ETH to $2,000 — but many still expect a rally to $3,500–$6,000 in the long term.
✅Support and Resistance Levels
Support level is now located at 2,390.00.
Now, the resistance level is located at 2880.00.

ETH USD LONG!The price has been a trading in a channel on the 4hrs timeframe, and recently it traded on the lower bound of the channel and a reversal pattern is observed on the 1Hr timeframe.
Hence, the price is now expected to rise.

can eth touch previous high made? or will this coin crash?can eth touch previous high made?
or will this coin crash to oblivion?
let us know!
free transparent no edit no delete
🐉We value full transparency. All wins and fails fully publicized, zero edit, zero delete, zero fakes.🐉
🐉Check out our socials for some nice insights.🐉
information created and published doesn't constitute investment advice!
NOT financial advice

ETH SHORT TERM/MID TERM BEARISH PRICE MOVEMENTHello everyone,
i would like to share my view of ETH, in the future it will hit between 6500/7000 no doubt but short to mid term i believe we will see the lower price levels once again before it takes off to new highs!
targets: 1545 , 1288
Greetings,
The Short Master

ETH/USD Rejection at Supply Zone – Bearish Move LoadingETH/USD is currently showing a potential short opportunity after rejecting the key supply zone around $2,640 – $2,645, a level that previously acted as strong resistance.
🔍 Key Observations:
Price tapped into a visible Supply Zone (highlighted in blue) and is now consolidating below it.
Strong resistance is confirmed by repeated rejections at $2,640.
A clean support level lies at $2,576, which could act as the first target if sellers take control.
Below $2,576, watch out for a potential drop toward the demand zone around $2,508 – $2,500, a level where bulls previously stepped in aggressively.
📉 Bearish Scenario: If ETH breaks below $2,576 with volume, expect momentum to build toward the $2,508 demand area. A break below $2,500 could open the door for further downside.
📌 Trade Idea:
Entry: Below $2,576 on strong bearish candle
TP1: $2,508
TP2: $2,500
SL: Above $2,645
🚨 Note: Confirmation is key. Watch for bearish candlestick formations or volume spikes before entering short.
🔔 Follow me for more clean setups and live trade ideas.
#ETHUSD #Ethereum #CryptoTrading #SupplyAndDemand #PriceAction #Scalping #DayTrading #ShortSetup


ETHUSD is moving within the 2390.00 - 2880.00 range 👀 Possible scenario:
Ethereum dipped to $2,440 on June 13 but rebounded to trade near $2,640 on June 16. Despite muted price action, institutional and whale interest remains strong. Crypto funds saw $1.9B in net inflows last week, marking the ninth consecutive week of gains, per CoinShares. Ethereum-focused funds brought in $585M, with U.S. spot ETFs accounting for $528.2M, though the 19-day inflow streak ended Friday with minor outflows. Whale wallets (1,000–100,000 ETH) added 1.5M ETH over 30 days, a 3.7% increase, now holding 41M ETH—around 25% of supply. Retail investors, meanwhile, took profits as ETH trades 45% below its all-time high.
Network activity is also up: Ethereum Name Service usage surged 300%, lending protocols 200%, and USDC transfers on Layer 2s like Base, Arbitrum, and Optimism saw triple-digit growth. With growing institutional flows, active Layer 2 usage, and whale accumulation, Ethereum may be quietly building momentum for its next breakout.
✅Support and Resistance Levels
Support level is now located at 2,390.00.
Now, the resistance level is located at 2880.00.

Ethereum’s 19-Day ETF Inflow Streak: What Really HappenedEthereum’s 19-Day ETF Inflow Streak: What Really Happened to Price, Structure, and Sentiment
Table of Contents
1. Executive Summary
2. ETF Backdrop: How the 19-Day Inflow Wave Took Shape
3. Chronology of Price: Day-by-Day Performance
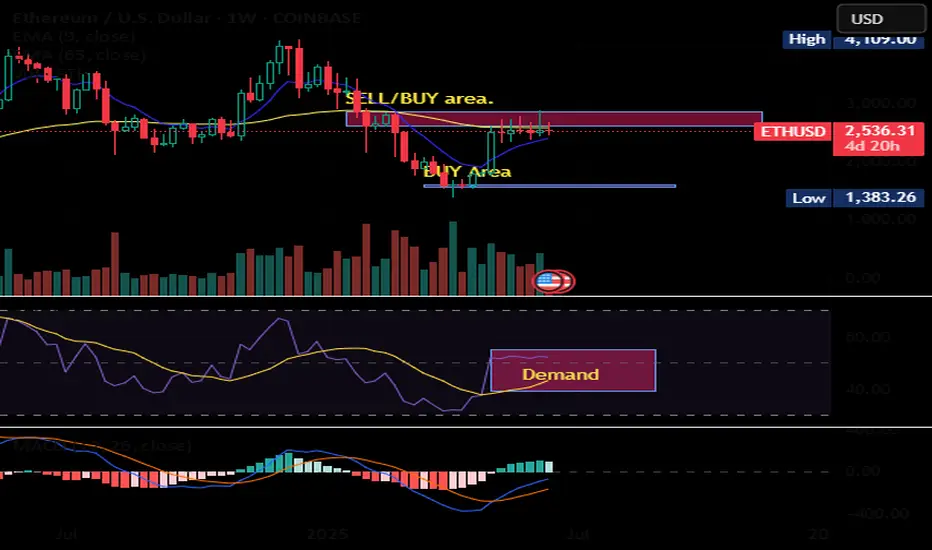
4. Weekly Chart Anatomy: The “Pre-Tower Top” Signal Explained
5. Intraday Technicals: From $2,450 Low to the $2,620 Hurdle
6. On-Chain & Derivatives Lens: Funding, OI, CEX Balances
7. Fundamental Undercurrents: Dencun Afterglow, L2 Fees, Staking Yields
8. Risks & Catalysts: ETH vs. Macro, vs. BTC Dominance, vs. SEC Noise
9. Playbooks for Traders and Long-Term Allocators
10. Conclusion: A Pause, Not a Peak—If Key Levels Hold
________________________________________
1. Executive Summary
• Ethereum received 19 consecutive days of net inflows into spot-linked exchange-traded products (ETPs) totaling $1.37 billion, the longest positive streak since the 2021 bull-run.
• Over the same period ETH/USD rose 18.4 %, printing a local high at $2,750, but has since pulled back to $2,575 amid broad crypto risk-off and Middle-East tensions.
• The latest weekly candle morphs into a “pre-tower top” pattern—two tall green candles followed by a small-bodied doji—often a harbinger of heavy distribution if confirmed by another red week.
• Short-term structure improved Monday: price pierced a contracting-triangle ceiling at $2,550, reclaimed the 100-hour SMA, and now eyes $2,620 as the gatekeeper to renewed upside.
• Funding rates flipped neutral, exchange reserves hit a 7-year low, and staking deposits outpace withdrawals 1.7 : 1—on-chain signs that the sell-off is more leverage shakeout than top formation.
________________________________________
2. ETF Backdrop: How the 19-Day Inflow Wave Took Shape
2.1. The Players
Unlike Bitcoin’s mammoth U.S. spot ETFs, Ethereum’s inflow streak drew from Europe and Canada, where physically backed ETPs have traded since 2021. The three biggest contributors:
Product Country 19-Day Net Flow AUM Growth
21Shares Ethereum ETP (AETH) Switzerland +$502 m +38 %
CI Galaxy Ethereum ETF (ETHX) Canada +$458 m +29 %
WisdomTree Physical Ethereum EU +$227 m +24 %
Rumors of an SEC approval window “after the U.S. election” sparked pre-positioning; asset managers figured it was cheaper to accumulate now than chase later once liquidity explodes on Wall Street.
2.2. Flow Mechanics
When an ETP issues new shares, it must buy spot ETH or tap an AP that can supply coins—direct demand unmatched by equivalent selling pressure. Over the 19-day window, the net 396 k ETH of creation equaled 57 % of all new issuance from block rewards post-Dencun, creating a measurable supply squeeze.
2.3. Historical Context
The only longer stretch was January–February 2021 (27 days), which culminated in ETH exploding from $1,400 to $2,000. The key difference today: market cap is six times larger, so identical inflows exert a milder percentage impact, explaining why price “only” added ~18 %.
________________________________________
3. Chronology of Price: Day-by-Day Performance
Day Date ETF Net Flow Price Close % Δ vs. Prior Day
1 Mar 18 +$58 m $2,110 —
5 Mar 22 +$73 m $2,265 +7.3 %
10 Mar 27 +$94 m $2,430 +2.4 %
15 Apr 1 +$125 m $2,690 +3.8 %
19 Apr 5 +$81 m $2,750 +0.9 %
Across the stretch, realized volatility rose from 32 % to 46 %, but skew stayed positive, showing call demand outpaced puts until the very end, when geopolitical headlines flipped sentiment.
________________________________________
4. Weekly Chart Anatomy: The “Pre-Tower Top” Signal Explained
4.1. What Is a Tower Top?
In candlestick lore, a tower top comprises:
1. A tall green candle (strong breakout)
2. Another tall green candle (exhaustion)
3. A narrow doji or spinning top (equilibrium)
4. A large red candle (breakdown confirmation)
We currently have the first three pieces: the last two weeks of March delivered back-to-back 10 % advances; the first week of April closed as a +0.6 % doji. The pattern is not confirmed until a decisive red week engulfs the doji body (< $2,540).
4.2. Indicators
• RSI (weekly): 59 → ticking down from 68 high; still shy of overbought.
• MACD histogram: Positive but flattening.
• Bollinger bands: Price mid-point of upper band, room for one more expansion.
Conclusion: the candle warns of fatigue, but momentum hasn’t rolled over—yet.
________________________________________
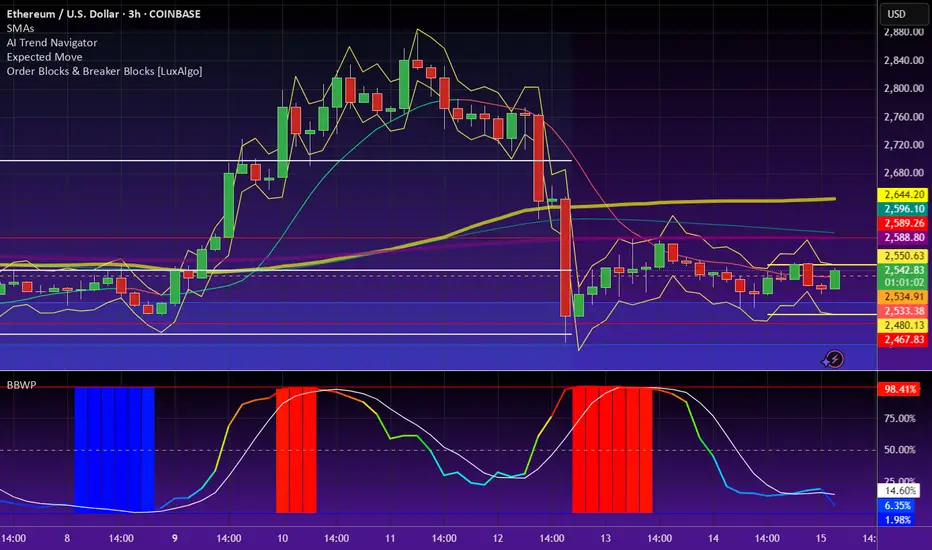
5. Intraday Technicals: From $2,450 Low to the $2,620 Hurdle
5.1. Hourly Chart (Kraken Feed)
• Triangle Breakout: Price sliced through descending trend-line at $2,550, tagging $2,590.
• Moving Averages: ETH trades marginally above the 100-hour SMA ($2,575) but below the 200-hour ($2,610).
• Fibonacci Zones: $2,620 aligns with 0.5 retrace of the $2,750→$2,450 fall—classic reversal pivot.
A clean hourly close >$2,620 opens the door to $2,680 (0.618 Fib) and psychological $2,700. Failure rejects to $2,520 support cluster.
5.2. Order-Book Heat Map
Coinbase Pro data shows 1,300 ETH ask wall at $2,620 and a thinner 890 ETH bid at $2,520. Liquidity skew favors dip-buying, but bulls need market orders >1 k ETH to smash the ask block.
________________________________________
6. On-Chain & Derivatives Lens
6.1. Exchange Reserves
Centralized exchanges now hold 12.9 million ETH, lowest since July 2017. The 19-day ETF harvest accelerated an already extant down-trend of roughly 60 k ETH/week outflows, mostly into staking contracts and L2 bridges.
6.2. Staking Flows
• Beacon deposit contract: +188 k in April’s first week.
• Withdrawal queue: 11 k ETH—tiny relative to deposits.
• Effective deposit APR after Dencun: 3.2 %, still beating U.S. 2-year T-notes post-tax for many investors.
6.3. Perpetual Funding & OI
• Funding normalized to 0.007 %/8 h (≈ 3.2 % APR), down from 9 % at March highs—spec longs flushed.
• Open Interest shed $420 m in the two-day dip—liquidations, not fresh shorts, drove the wash-out.
6.4. Options Skew
• 25-delta risk reversal (1-month): flipped to –4 % (puts pricier than calls) for first time since January—hedging demand but nowhere near panic-level (–12 % in 2022 bear).
________________________________________
7. Fundamental Undercurrents
7.1. Dencun Afterglow & L2 Fees
Proto-danksharding (EIP-4844) slashed L2 data costs by 85 %, pushing average Arbitrum and Optimism transaction fees under $0.02. Cheaper blockspace fuels on-chain activity:
Metric Pre-Dencun Post-Dencun Δ
Daily L2 Txns 2.4 m 4.1 m +71 %
Bridged ETH to L2s 6.8 m 7.9 m +16 %
More usage → more gas burned → structural tailwind to ETH as a fee-burn asset.
7.2. DeFi TVL
Total value locked rebounded to $61 billion, led by EigenLayer and restaking hype. ETH comprises 68 % of TVL collateral—every lending loop pins additional demand.
7.3. Competing Narratives
• Solana season siphoned retail mind-share; SOL/ETH ratio popped 42 % YTD.
• Bitcoin L2s (Stacks, Rootstock) attempt to mirror Ethereum’s smart-contract moat, but dev tooling remains nascent.
•
Net: Ethereum retains developer supremacy (70 % of new GitHub commits among smart-contract chains) and therefore garners institutional comfort.
________________________________________
8. Risks & Catalysts
Factor Bearish Angle Bullish Rebuttal
Macro Sticky U.S. CPI halts Fed cuts → higher real yields weigh on non-yielders ETH staking yield + MEV is real cash-flow; Dencun lowers L2 costs → adoption offset
SEC Spot ETF Delay past Jan 2026 or outright denial kills U.S. inflow dream 19-day streak proves ex-U.S. capital is hungry; approval >0 is all it takes for supply shock
BTC Dominance Halving FOMO may keep Bitcoin’s share >55 %, starve ETH rotation Historical pattern: ETH rips 6-10 weeks post-halving as beta plays catch-up
Tower-Top Pattern Weekly confirmation could spark drop to $2,200 support Pattern fails if bulls recapture $2,750 quickly, turning doji into bullish flag
________________________________________
9. Playbooks for Traders and Long-Term Allocators
9.1. Short-Term Momentum (0–7 days)
• Bias: Range-trade $2,520–$2,620 until breakout.
• Instruments: ETH-perp on Bybit/Deribit, 3× leveraged tokens for reduced funding bleed.
• Trigger: 15-minute candle above $2,620 with ≥ $50 m aggregated CVD buys.
• Stop: $2,560 (triangle retest).
• Target: $2,680 then $2,700.
9.2. Swing (1–8 weeks)
• Bias: Accumulate dips as long as weekly stays >$2,350 (0.382 Fib of Oct→Mar leg).
• Tools: 1-month $2,500-$2,800 call spreads; spot with 25 % collar protection.
• Catalysts: SEC commentary May 23, FOMC June 18.
9.3. Position (6–18 months)
• Bias: Dollar-cost average into staking nodes; carry 4 % ETH on portfolio NAV.
• Thesis: EIP-4844 usage boom + probable U.S. ETF = $4–5 k fair value by 2026.
• Risk Control: Hedge 25 % notional via BTC-perp short if BTC.D >58 %.
________________________________________
10. Conclusion: A Pause, Not a Peak—If Key Levels Hold
The 19-day ETF inflow streak proves that institutional demand for Ethereum exists even without a U.S. spot vehicle. Price responded vigorously but not parabolically, reflecting the asset’s growing market-cap gravity. The nascent “pre-tower-top” weekly candle warns of exhaustion; confirmation, however, requires another bearish week that cracks $2,540 support.
Short-term order-flow shows willing dip buyers, staking metrics scream supply sink, and the macro backdrop—while shaky—fails to dent ETH’s relative value proposition versus fiat yields. Translation: Ethereum is vulnerable to headline-driven squalls but structurally sound.
If bulls recapture $2,620, the path to retest $2,750 and ultimately $3,000 reopens. Lose $2,450 and the tower top will complete, sending ETH toward $2,200 where ETF inflow buyers likely reload. For now, the balance of evidence favors consolidation with an upward skew—tower construction, perhaps, but no wrecking ball yet.

Bullish bounce off pullback support?The Ethereum (ETH/USD) is falling towards the pivot and could bounce to the 1st resistance.
Pivot: 2,407.74
1st Support: 2,092.59
1st Resistance: 2,816.29
Risk Warning:
Trading Forex and CFDs carries a high level of risk to your capital and you should only trade with money you can afford to lose. Trading Forex and CFDs may not be suitable for all investors, so please ensure that you fully understand the risks involved and seek independent advice if necessary.
Disclaimer:
The above opinions given constitute general market commentary, and do not constitute the opinion or advice of IC Markets or any form of personal or investment advice.
Any opinions, news, research, analyses, prices, other information, or links to third-party sites contained on this website are provided on an "as-is" basis, are intended only to be informative, is not an advice nor a recommendation, nor research, or a record of our trading prices, or an offer of, or solicitation for a transaction in any financial instrument and thus should not be treated as such. The information provided does not involve any specific investment objectives, financial situation and needs of any specific person who may receive it. Please be aware, that past performance is not a reliable indicator of future performance and/or results. Past Performance or Forward-looking scenarios based upon the reasonable beliefs of the third-party provider are not a guarantee of future performance. Actual results may differ materially from those anticipated in forward-looking or past performance statements. IC Markets makes no representation or warranty and assumes no liability as to the accuracy or completeness of the information provided, nor any loss arising from any investment based on a recommendation, forecast or any information supplied by any third-party.

Bitcoin Mid-Term, 4H Timeframe, Bullish ($119,165 Next Target)On the 4H timeframe we have a consolidation pattern with a bullish bias. Bitcoin is aiming higher after a close above EMA8 & 13 with higher lows.
The drop 13-June found support perfectly at 0.786 Fib. retracement on a wick. The session closed above 0.618. The action turned bullish immediately and we are seeing slow but steady growth.
The recent drop was a market reaction due to a geopolitical situation. As soon as the event is priced in, the market seeks balance and goes back to its previous trend.
Bitcoin's bullish bias is not only supported by strong prices, $105,600 is very strong, but also by the altcoins and the cyclical nature of the market.
While Bitcoin already produced several new all-time highs this year the altcoins are yet to do the same. A bull market happens every four years or the year after the halving. For Bitcoin this is already true but this is a marketwide event and the altcoins are yet to go there and this is a bullish factor and soon this will be obvious on the chart.
We are 5-6 days away only from very strong bullish action. Notice that this isn't a long time, it is less than a week. The altcoins will reveal this bullish bias much sooner than Bitcoin but Bitcoin will also grow and hit a new all-time high soon. This new all-time high will be the catalyst for everything to boom.
» Ignore the short-term it is all noise—crypto is going up.
The next target is $107,558, followed by $109,508 on this timeframe. The latter being a mild resistance.
The main target here is $119,165 and this is a good resistance zone. It can be rounded up to $120,000. If this level gets hit it will only confirm additional growth. The target that follows is $130,000 and the minimum for this cycle is $160,000 but we are aiming higher.
Feel free to follow for more.
I will continue to detail Bitcoin on all the timeframes as well as many of the top, mid- and small altcoins.

ETH NEXT MOVE The chart shows **ETH/USD (Ethereum to USD)** on the **4H timeframe**, forming a **rising channel** pattern. Here's a breakdown of the analysis:
---
### 🔍 **Pattern Identified**
* **Rising Channel** (also known as an ascending channel):
* **Upper Resistance Line:** Price is currently testing this line.
* **Lower Support Line:** Held multiple times, confirming structure.
---
### 📈 **Current Price Action**
* **Price:** \~\$2,796.7
* ETH is **at the top of the channel**, facing strong **resistance**.
* Recent move was sharp and bullish, indicating momentum.
---
### ⚠️ **Possible Scenarios**
#### ✅ **Bullish Breakout (Less Common in Channels)**
* If price **breaks above** and **closes convincingly above the channel**, especially with high volume:
* Target zones: \$2,900 → \$3,000 → \$3,200.
* Look for **bullish continuation setups** on lower timeframes.
#### ❌ **Rejection from Resistance (More Likely)**
* If price **rejects the top** of the channel:
* Expect a pullback toward the **mid-line** or **lower support** (\~\$2,550 to \$2,400).
* This would offer a potential **buy-the-dip** opportunity.
---
### 📉 **Bearish Confirmation**
* A **breakdown below the lower trendline** (\~\$2,400):
* Invalidates the channel.
* Could trigger deeper correction toward \$2,200 and below.
---
### 📊 **Strategy Suggestions**
#### If Trading the Range:
* **Sell/Short** near top of channel (\~\$2,800), SL above channel.
* **Buy/Long** near bottom of channel (\~\$2,400), SL below channel.
#### If Anticipating Breakout:
* **Wait for retest** after breakout and enter on confirmation.
* Use trailing stops to manage risk.
---
### 🧠 Summary
| Bias | Direction | Reason |
| ------- | ------------- | ------------------------------------------- |
| Neutral | Ranging | Still inside the channel |
| Bullish | Above \$2,850 | Breakout with volume can fuel momentum |
| Bearish | Below \$2,400 | Breakdown from channel means trend reversal |

ETH SHOWING RESILIENCE! LONG OPPORTUNITY.After weeks of sideways price action, ETH has displayed multiple signals that regardless of worldwide geopolitical issues, we find ourselves in a great spot to trade the FIB channel, along with a simple trend exhaustion.
This is my personal favourite when it comes to perspective of what is really happening within the crypto space at the moment.
Lets get into the details!
Trading within the FIB if the support levels can hold, we have tested the $2500 support level multiple times, we have also seen a BULLISH FLAG with a break down, into a PERFECT CUP & HANDLE to the upside.
Along with confirmation of the trend exhaustion, we are seeing an uptick of bulls coming into the market and protecting the precious $2500 support line.
As long as ETH remains above $2500 and can continue to trade within the FIB channel, this is a great opportunity to long.
ETH is showing is resilience, lets see how this long trade plays out.
This is my opinion only, do not use this as financial advice. Good luck and lets get some gains! 🚀

EHTUSD15 min TF
Buy on next breakout
Cup and Handle Format
Risk Reward mentioned in chart with TP SL EP

Inverse cup and handle + Symetrical triangle (continuation) ETHInverse cup and handle + Symetrical triangle (down)
Bearish
Target 2100 ish
Thank me later,
The Short Master

ETHUSD: Next Move Is Down! Short!
My dear friends,
Today we will analyse ETHUSD together☺️
The market is at an inflection zone and price has now reached an area around 2,545.9 where previous reversals or breakouts have occurred.And a price reaction that we are seeing on multiple timeframes here could signal the next move down so we can enter on confirmation, and target the next key level of 2,529.4..Stop-loss is recommended beyond the inflection zone.
❤️Sending you lots of Love and Hugs❤️

Ethereum LP Range TighterVolatility has continued to decline, enabling us to tighten the liquidity provision range on Ethereum within the Base network, as indicated by the horizontal red lines. However, trading volume in ETH remains relatively low, which is resulting in minimal fee generation from the pool, we expect that to change: app.uniswap.org
ETH 06/15ETH is not bullish. It’s delayed. Strength isn’t absence of collapse — it’s the pause before it. Exit. Re-enter at 2,200. Obey structure, not emotions.