ETH/USD Analysis – Smart Money Breakdown ETH/USD Analysis – Smart Money Breakdown & Rejection from Premium Zone
🔍 Key Breakdown:
✅ BOS (Break of Structure): The initial BOS on July 15 signaled a strong bullish shift in market structure, triggering a sustained upside rally.
💪 Strong Bullish Rebound: After the BOS, ETH experienced impulsive buying, confirming institutional order flow and liquidity injection.
🔺 Resistance Zone (Premium Area): The price formed a clear TOP at the resistance (near $3,950–$4,000), a common zone where smart money distributes positions.
📉 Reaction from Resistance: As ETH tapped into the resistance, price sharply rejected — a potential mitigation move or distribution phase.
⚠️ Current Price Structure: After the correction, ETH is retracing back into the resistance zone. The projected arrow indicates a possible lower high formation, followed by a continuation to the support zone ($3,300–$3,400).
🧠 Educational Takeaways:
Structure Is King: Market structure (HHs, HLs, BOS) is the foundation of SMC-based trading.
Premium vs. Discount Zones: Smart money sells in premium (resistance) and buys in discount (support).
Liquidity Reversal: Tops often trap late buyers before a reversal — watch for liquidity grabs at key zones.
Wait for Confirmation: Always wait for confirmation (candlestick or structure shift) before entering trades.
🎯 Potential Scenarios:
✅ Bearish Case: ETH forms a lower high and drops to support (~$3,350).
❌ Invalidation: Clean breakout and hold above $4,000 could open doors for further bullish continuation.
ETHEREUM trade ideas


ETH ( Ethereum ) lovers looking strong for long term ETH -----Daily counts indicate Excellent bullish wave structure.
Both appear to be optimistic and this stock invalidation number (S L) wave 2 low
target short / long term are already shared as per charts
correction wave leg seems completed
Investing in declines is a smart move for short/ long-term players.
Buy in DIPS recommended
Long-term investors prepare for strong returns over the next two to five years.
one of best counter
Every graphic used to comprehend & LEARN & understand the theory of Elliot waves, Harmonic waves, Gann Theory, and Time theory
Every chart is for educational purposes.
We have no accountability for your profit or loss.

ETH Charging at $4K
ETH on the 4H
And just like that, ETH is knocking on the $4K door again. This move is absolutely beautiful.
After losing the 0.236 Fib last week and bouncing from the 0.5, ETH made another attempt earlier this week — got rejected — then broke above 0.236 like it was nothing.
Now, price is retesting yesterday’s close (black dotted line), which aligns with last week’s highs and is acting as short-term support. It’s gathering strength for the next push at $4K.
All signals align:
• MLR > SMA > BB Center
• PSAR flipped bullish
• RSI is cooling off
• MACD is fully bullish
Structure remains strong. Momentum is building.
ETH-related bullish news and stablecoin narratives are flooding the timeline.
I’ve started scaling back in and am watching how price reacts to the $4K resistance.
This part takes patience and focus — I’ll keep updating this idea as it evolves.
Always take profits and manage risk.
Interaction is welcome.

Ethereum double top or to 4800?Ethereum is showing a familiar pattern but this time appears to be different - odds favor a squeeze to 4800 within 30 days.

ETHUSD holds 3,550.00 support level and continues to grow.ETHUSD holds 3,550.00 support level and continues to grow.
Since August 1 the asset has been trading below the support level of 3,550.00. On Monday the asset broke through this level from below, establishing the false breakout of this level. A false breakout is when an asset’s price pops past a major support or resistance line but then flips back fast, not sticking with the move. It tricks traders into thinking a big trend’s kicking off, only to burn them when the price slides back to where it was.
On August 6 ETHUSD has successfully rebounded from the 3,550.00 support level and is currently developing short-term bullish momentum. The price is expected to grow towards 3,800.00 and 4,000.00 as a final target.

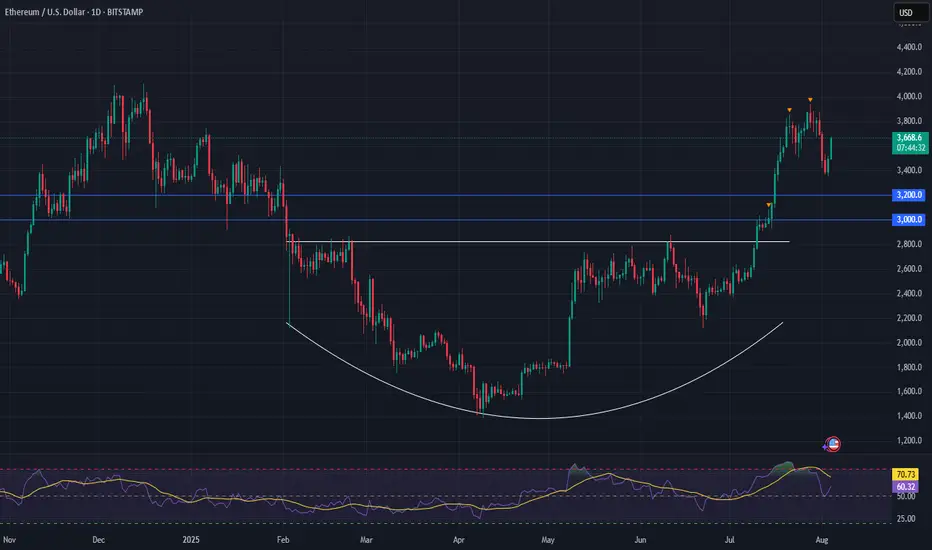
Ethereum (ETH) is setting up for a powerful moveFollowing a strong breakout, ETH has entered a healthy consolidation phase—setting the stage for its next leg higher.
Momentum remains firmly on the bulls’ side, with the breakout from a long-term saucer pattern fueling continued upside pressure.
📈 Technical Highlights:
✅ Short-term target: $4,000+ (breakout continuation)
✅ Long-term potential: $7,000+
🛡️ Key support: $3,000–$3,200 (bullish as long as this holds)
📣 Takeaway:
Ethereum is showing classic bullish structure. With higher-lows forming and strong support below, pullbacks are likely to offer high-probability entries for both traders and long-term holders.
#Ethereum #ETHUSD #Crypto #Trading #TechnicalAnalysis #CryptoTrading #EthereumPrice #Altcoins #Bullish #Breakout
ETH will hit a new ATH in 16 days.ETH to reach new ATH in 16 days based on trend momentum and historical breakout patterns. Watching key resistance levels closely. High volume and bullish sentiment support the move.

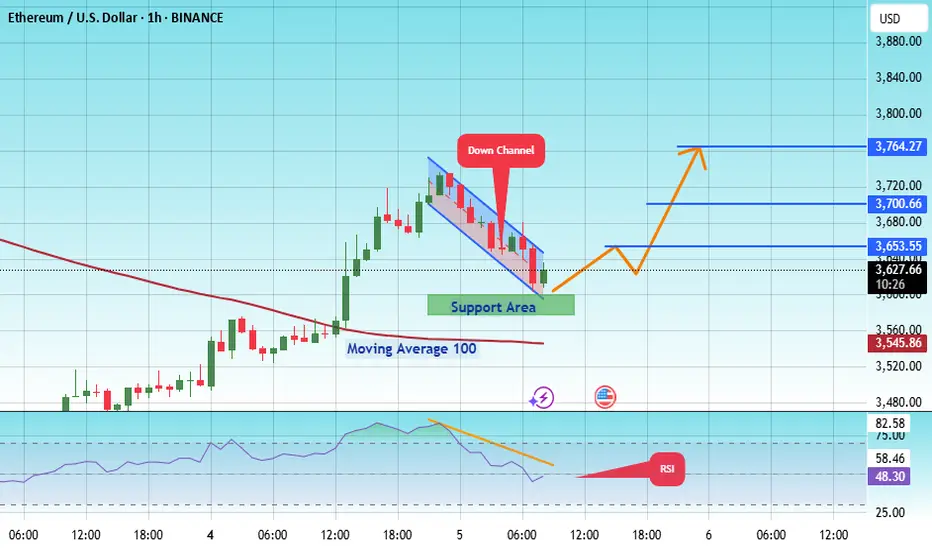
#ETH/USDT : Price is going as expected in previous ideas on eth#ETH
The price is moving within an ascending channel on the 1-hour frame, adhering well to it, and is on track to break it strongly upwards and retest it.
We have support from the lower boundary of the ascending channel, at 3593.
We have a downtrend on the RSI indicator that is about to break and retest, supporting the upside.
There is a major support area in green at 3582, which represents a strong basis for the upside.
Don't forget a simple thing: ease and capital.
When you reach the first target, save some money and then change your stop-loss order to an entry order.
For inquiries, please leave a comment.
We have a trend to hold above the 100 Moving Average.
Entry price: 3626.
First target: 3653.
Second target: 3700.
Third target: 3764.
Don't forget a simple thing: ease and capital.
When you reach your first target, save some money and then change your stop-loss order to an entry order.
For inquiries, please leave a comment.
Thank you.
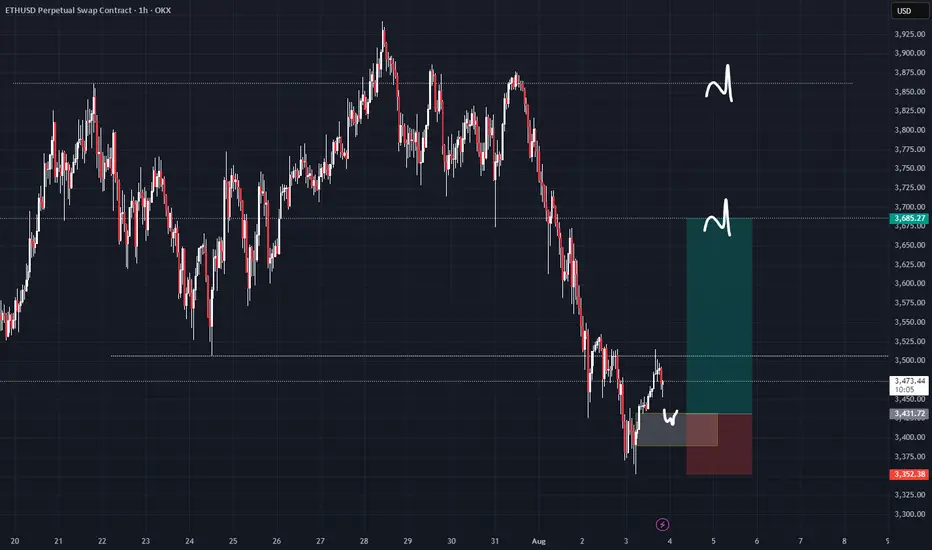
ETH/USD Double Bottom with Bullish RSI Divergence 1HETH/USD has formed a double bottom pattern on the 1 -hour timeframe , signaling a potential bullish reversal after recent downside pressure. The pattern is supported by a bullish RSI divergence, where price made lower lows but RSI printed higher lows — indicating a momentum shift.
A buy stop entry is placed just above the neckline, targeting a continuation toward key resistance zones.
Trade Setup
Buy Stop Entry: 3539.52 (on confirmed neckline breakout)
Stop Loss: 3424.13 (below second bottom – invalidation level)
Take Profit 1: 3658.19
Take Profit 2: 3774.71

ETHUSD bullish consolidation supported at 3,485The ETHUSD remains in a bullish trend, with recent price action showing signs of a corrective pullback within the broader uptrend.
Support Zone: 3,485 – a key level from previous consolidation. Price is currently testing or approaching this level.
A bullish rebound from 3,485 would confirm ongoing upside momentum, with potential targets at:
3,800 – initial resistance
3,855 – psychological and structural level
3,930 – extended resistance on the longer-term chart
Bearish Scenario:
A confirmed break and daily close below 3,485 would weaken the bullish outlook and suggest deeper downside risk toward:
3,372 – minor support
3,240 – stronger support and potential demand zone
Outlook:
Bullish bias remains intact while the ETHUSD holds above 3,485. A sustained break below this level could shift momentum to the downside in the short term.
This communication is for informational purposes only and should not be viewed as any form of recommendation as to a particular course of action or as investment advice. It is not intended as an offer or solicitation for the purchase or sale of any financial instrument or as an official confirmation of any transaction. Opinions, estimates and assumptions expressed herein are made as of the date of this communication and are subject to change without notice. This communication has been prepared based upon information, including market prices, data and other information, believed to be reliable; however, Trade Nation does not warrant its completeness or accuracy. All market prices and market data contained in or attached to this communication are indicative and subject to change without notice.

Ethereum PumpingA breakthrough is coming for Ethereum after testing $3800 for the fourth time, with $8000 as the target.


Patience is the keyEth moved downwards, but now it has started moving upwards. Once price passes 3901.88, one can move to the H4 and take a buy all the way to 4092.46.

Trendline break The price has broken out of a trendline followed by a pullback and now the price looks to go short
WE ONLY TRADE PULLBACKS

ETH - BTC ETF News: What It Means for the Market+ China Rumors 🚨 ETH - BTC ETF News: What It Means for the Market + China Rumors 💥🌐
July just ended with a crypto bombshell 💣 — and the market is barely reacting.
Let’s break it down:
🧠 One part hard news.
🌀 One part geopolitical smoke.
🎯 All parts worth watching if you care about macro market shifts.
🏛️ SEC Approves Real BTC & ETH for ETF Flows (July 29)
Say goodbye to the cash-only ETF model.
The SEC now allows direct in-kind creation/redemption of Bitcoin and Ethereum in ETFs.
That means providers like BlackRock, Fidelity, VanEck can now use actual BTC/ETH, not just synthetic tracking.
✅ Bullish Impact:
💰 Real Spot Demand: ETF inflows = real crypto buying
🔄 Efficient Arbitrage: No middle step via cash = faster flows
🧱 TradFi + Crypto Merge: ETFs now settle with crypto — not just track it
🎯 Better Price Accuracy: Spot ETFs reflect true market value more cleanly
📉 The market reaction? Mild.
But don’t get it twisted — this is a structural reset, not a meme pump.
⚠️ But There’s a Bearish Angle:
🏦 Centralized Custody: Crypto now lives in Coinbase, Fireblocks vaults
⚠️ Network Risks: ETF performance now tied to ETH/BTC uptime
🧑⚖️ Regulatory Overreach: More hooks into validator networks, MEV relays
🌊 Volatility Risk: Panic redemptions = real BTC/ETH sold into open markets
Still, this is good news for Ethereum in particular.
Why? Because ETH isn’t just money — it’s infrastructure.
And now Wall Street is finally using it, not just watching it.
🇨🇳 And Then There’s China… Rumor or Tumor?
Crypto Twitter is swirling with unconfirmed whispers from July 29 that China may be prepping a major Bitcoin statement ahead of the BRICS summit.
But let’s be clear:
🚨 It’s a rumor. Or a tumor. 🧠
And like many tumors in crypto — there’s a 40% chance it brings bad news. 🤕
Still, here’s what’s being floated:
🧠 Speculations Include:
🔓 BTC re-legalization in “special finance zones” (HK-style)
🏦 BTC in national reserves (!)
🤖 CBDC integration or smart contract interoperability
⚒️ Return of official state-backed Bitcoin mining
🧯 But no official sources. Just geopolitics + timing.
China’s FUD/FOMO pattern is Bitcoin tradition — don’t get trapped by hopium.
But if even half of it is true... buckle up.
📈 Ethereum Leads the Charge — But Watch These Alts:
If ETFs go fully crypto-native, some sectors light up 🔥
🔹 1. Ethereum Layer 2s (ARB, OP, BASE)
→ ETF gas pressure = L2 scaling demand
🔹 2. DeFi Protocols (UNI, AAVE, LDO)
→ TradFi liquidity meets on-chain utility
🔹 3. ETH Staking Derivatives (LDO, RPL)
→ Institutions want yield = LSD narrative grows
🔹 4. Oracles (LINK)
→ ETFs need trusted on-chain data = Chainlink shines
🔹 5. BTC on ETH Bridges (ThorChain, tBTC)
→ If BTC flows into ETH-based ETFs, bridges light up
🚫 What I will Avoid:
❌ Memecoins – zero relevance to ETF flows
❌ GameFi – not part of TradFi’s roadmap
❌ Ghost Layer 1s – no users, no narrative, no pump
🧠 My Take:
ETH is building momentum toward $4,092 — the third breakout attempt on your 1-2-3 model.
🔥 The fuse is lit. Target? $6,036
Timing? Unknown. But structure is in place.
Meanwhile, Bitcoin Dominance is rising.
ETH is shining.
Solana — while powerful — continues paying the price for memecoin madness 💀
We’re entering a new phase — where ETFs settle with real crypto , China watches the stage, and macro money is warming up behind the curtain.
So stack smart.
Study the flows.
Don’t let silence fool you — the biggest moves come after the news fades.
One Love,
The FX PROFESSOR 💙
Disclosure: I am happy to be part of the Trade Nation's Influencer program and receive a monthly fee for using their TradingView charts in my analysis. Awesome broker, where the trader really comes first! 🌟🤝📈

THE CHART DOESN'T LIE: A NEW DAWN FOR ETHEREUM
🔍 TECHNICAL ANALYSIS
1. The long-term downtrend , which lasted approximately 3.5 years, has been **broken on the monthly chart**, signaling a confirmed breakout (BO).
2. The horizontal resistance level at 4045 USDT is a critical zone. This is expected to act as the next stop following the breakout. A clear breach of this level could potentially lead to **more aggressive upward movements**.
Note: We do not consider the all-time high at 4631 USDT to be a major resistance, as it previously acted not as a strong sell zone but rather as a **momentum acceleration point**. With the entry of new investors and resulting FOMO (Fear of Missing Out), we anticipate minimal resistance around this level.
3. Since its launch in 2016, the **MACD indicator** has issued three **buy signals** on the monthly timeframe:
* Two resulted in strong bull runs .
* One led to a ** 60% rally **.
* Currently, a new bullish crossover is forming.
4. The RSI indicator has historically provided clear insight into when rallies may begin to slow. In particular, the 88 level and above has marked overbought territory, which could be a suitable area for gradual profit-taking .
5. Important Fibonacci-based accumulation zones are located between 3262 and 2697 USDT.
🧠 FUNDAMENTAL ANALYSIS
1. Smart Contracts
Ethereum is a programmable blockchain that enables the execution of smart contracts—automated agreements without intermediaries.
🧠 Example: “If Team A wins, send payment automatically.”
2. Decentralized Application Platform (dApps)
Ethereum empowers developers to build dApps whose data is stored across the network, not on centralized servers—making it resistant to censorship.
3. Foundation of DeFi and NFT Ecosystems
* Most DeFi platforms (lending, staking, earning interest) are built on Ethereum.
* Roughly 80% of NFTs originated on Ethereum (OpenSea, Bored Ape, CryptoPunks, etc.).
4. Approval of Spot Ethereum ETFs (U.S.)
* Following Bitcoin ETFs, some Ethereum spot ETFs have been approved.
* This has **opened the door to institutional investment**, creating **upward price pressure**.
5. ETH 2.0 Upgrade & Staking
* Ethereum transitioned from Proof of Work to Proof of Stake, making the network more sustainable and scalable.
* Users can now stake ETH to earn passive income.
6. Enterprise Adoption
* Corporations such as Visa and JPMorgan are testing Ethereum’s infrastructure.
* Use cases: payments, data storage, contract management.
7. Favorable Regulatory Shifts Support Altcoins
* U.S. laws like GENIUS and CLARITY have laid a framework for stablecoins.
* This has increased institutional interest in **infrastructure coins** like Ethereum and Solana.
8. Capital Rotation into Altcoins
* While Bitcoin consolidates between \$115K–\$118K, capital is flowing into altcoins.
* Tokens like XRP, DOGE, BONK, PEPE, HYPE have surged.
* XRP is particularly favored due to its enterprise use case, with price targets of \$4–\$6 being speculated.
9. Growth in Futures and Institutional Trading
* CME Group data shows growing open interest in Solana and XRP futures.
* ETH farms also reflect strong institutional interest, as companies begin to hold crypto assets under treasury models.
10. Risks to Monitor
* Potential downward pressure may come from **Fed rate decisions**, **ETF inflows/outflows**, *miner selling, or regulatory actions (e.g., MiCA).
* Altcoins remain volatile and sensitive to regulation.
💹 IN SUMMARY – Key Accumulation Zone:
3262 – 2697 USDT
We haven't provided detailed Ethereum analysis in a while, as both technical and fundamental structures often require time to form. In short: not all assets are worth analyzing until they are.
"Wealth does not come from the number of trades, but from the patience to wait for the right trade." – Bull Investment
⚠️ DISCLAIMER:
Maintain proper capital and risk management to protect your psychology during market corrections.
This analysis is for educational purposes only and does not constitute financial advice. Making decisions based on this commentary may lead to losses.
Avoid following unverified tips and rumors.

Bullish ETH!!!My inverse head and shoulder pattern played out close to perfect, as seen in pic.
Recent bullish move also, made perfect move to downside, with rsi at rock bottom and hitting target perfectly, I say the next bullish move woll break out and hit the new target as seen in pic.
Come on eth!!!

Potential deviation entery on ETHI partycaulary gonna be waiting for a decent reaction in yellow zone or price returning higher 3520 wich would confirm that deviation
But as u probably know trading deviation mostly requiers entering during it so my main goal for next pre london hours will be to try to find entery with decent rr ratio
But also if i dont see any decent reaction in yellow or a failure to hold higher 3520 i would consider skiping the trade or even look for continuation short
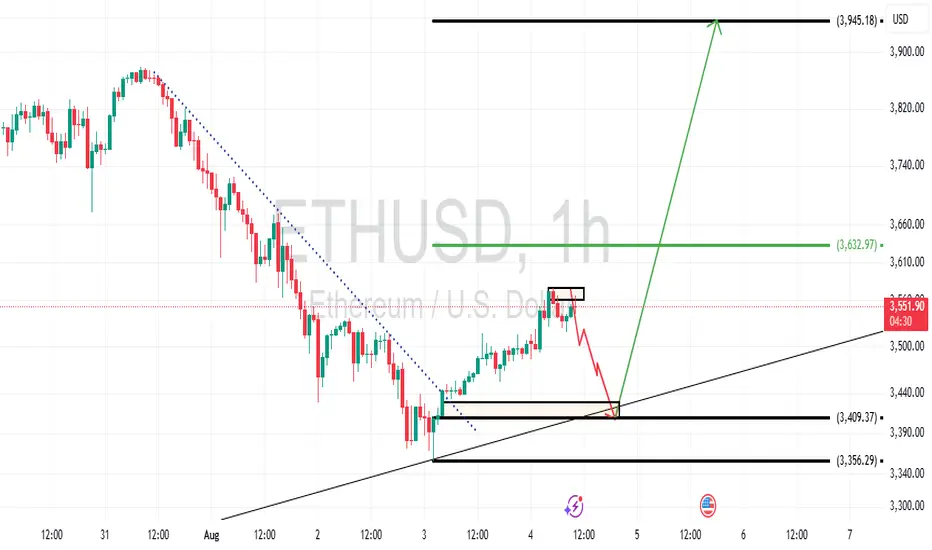
Eth/Usd Possible pathEthereum declared a possible bullish move that pends a retest. Depending on the momentum of the market, the market is likely to retest today or tomorrow in order to keep the week bullish.
Testing $3,500 Support, Rebound Ahead?Instrument: ETHUSD
Timeframe: Daily
Date: August 4, 2025
Analysis:
ETH fell 7.9% to $3,500 from $3,800, testing support after failing to break its high. The hawkish FOMC and rising BTC.D (62%) pressured altcoins. I entered the dip on $3,500, as shared on X and my previous report
Chart Setup:
Support: $3,500
Resistance: $3,600, $3,800

ETHUSD – Holding the LineETH is flirting with breakout mode, reclaiming its 200 SMA at $3,477 and pushing to $3,569. RSI is recovering from a dip and regaining upside pressure. Momentum holds above $3,525.

Bullish ETH, 4k on the wayNFA.
I`m very bullish here.
Consolidation likely till 5-6th august.
Run to 4k 11-20th august.
Good luck!
