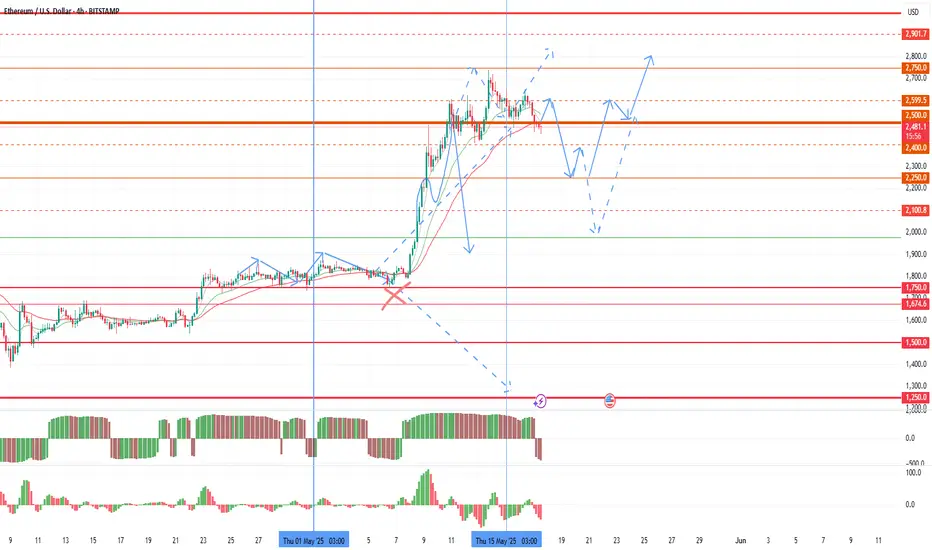
eth is going up!eth is going up!
minor channel break out, lets see what happens
i took long position while waiting.
-grey
ETHEREUM trade ideas

Etherium USD 4 Hour Head and Shoulder for Bearish Reversal Etherium USD 4 Hour Head and Shoulder for Bearish Reversal
Trade Plan to Short at the break of NeckLine

Continuation of the flat under the pressure of seasonal salesAnd so a difficult week is behind us, with overcoming the middle of the quarter. Against the background of positive factors, the week and the second half of the quarter opened above 2500, which provides market support and reduces the potential for decline. However, we have only come to a temporary consolidation of the market and it is too early to talk about a trend change to bullish. The final consolidation of the direction will take place in June. So far, the market has switched to seasonal sales from the 11th, as I warned about, and the bulls' task is to compensate for them. Technically, there is still a lot of potential for retest 2100-2150, which may happen in the coming week.
In an optimistic scenario, the new week will open above 2500. In this case, on Monday and Tuesday we will see insignificant sales again and the ether will not go below 2250 with a return to the hay in the second half of the week. In a more negative scenario, the week will open below 2500, in which case sales up to 2100-2150 are likely in the first half of the week, but with further purchases to 2500 due to the opening of the second half of the quarter above the level.
Today and tomorrow, there is a possibility of a wave of purchases, but I do not recommend keeping large-cap coins in operation, since seasonal sales in a negative scenario may last from mid-May to August, which will lead to their steady decline. Small-cap coins may show more significant growth impulses during this period.
We are also approaching the next assignment of the monitoring tag and delisting, which will have an additional impact on altcoins. So far, fantokens are in a good position, which successfully compensate for the drawdown of the altcoin index and are trying to grow, as they remain undervalued. I think they will remain interesting for speculators in the near future due to the drawdown of the rest of the altcoin market. ATM and city look the most interesting so far, which can continue to grow from their current positions, due to the lack of futures with active sales and the most oversold position. Under an optimistic scenario today and tomorrow, growth waves similar to acm are likely for them. Acm also has a high growth potential, but it may take time to accumulate with a retest probability of 0.75-90 before a new wave of purchases. Second of all, I am considering the alpine juv porto lazio. There is a possibility that binance will continue to add futures to fantokens every week, which will give new growth impulses.
In addition to fantokens, fio chess pivx adx quick, which remain in an undervalued position, can show a new wave of growth. I will be looking at them closer to the middle of the week.
ETHUSD Long: Start of Wave 3 UpAs I explained the wave counts for Ethereum, I believe that we have seen the end of a wave 2 correction and the next wave should be a wave 3 up.
I presented the breakdown of the down move using both Elliott Waves and Fibonacci extension.
As mentioned, the stop loss should be below wave C low or if you can stomach more risk, below the low of previous wave 4. The price target is >$3800.
Good luck!

Eth has formed Head n Shoulder PatternEth has formed a Head and Shoulders Pattern, we can expect a fall up to 2100.

ETHUSD Is Bullish! Long!
Here is our detailed technical review for ETHUSD.
Time Frame: 9h
Current Trend: Bullish
Sentiment: Oversold (based on 7-period RSI)
Forecast: Bullish
The market is approaching a significant support area 2,593.04.
The underlined horizontal cluster clearly indicates a highly probable bullish movement with target 2,920.18 level.
P.S
The term oversold refers to a condition where an asset has traded lower in price and has the potential for a price bounce.
Overbought refers to market scenarios where the instrument is traded considerably higher than its fair value. Overvaluation is caused by market sentiments when there is positive news.
Disclosure: I am part of Trade Nation's Influencer program and receive a monthly fee for using their TradingView charts in my analysis.
Like and subscribe and comment my ideas if you enjoy them!

ETHUSD - Support Line Reestablished A major support line has been recovered on this ETH daily chart
One that previously led to a strong breakout
From here price will find support on this line and then pop off again
Good time to buy ETHUSD
Daily chart

ETH Still Bearish ETH hasn't hit bottom yet, from the 4hrs and Daily pov ofcourse.
ETH as Bitcoin itself as of now are in a 4hrs and Daily Bearish cycles but that will start changing after May 20th or 22nd to start re-taking its uptrend move.
For now every bounce it will just to drop back down to the bottom of the trading range .
Buckle up grab your popcorns and prepared for bulls party that will start last week of month (if not sooner)

ETH - Ethereum Daily Chart turned to Down? Any Opinions?ETH - Ethereum Daily Chart turned to Down? Any Opinions?
Please comment why we should hold ETH?
Not financial advise!
Not for recommendations to buy sell any securities, FX, Stocks or Crypto.

ETHUSD AT CRUCIAL SUPPLY ZONE – BIG MOVE INCOMING?!Ethereum is currently trading at $2,555, sitting just below a strong supply zone between $2,570 – $2,620, as shown by the blue shaded area from LuxAlgo’s Supply and Demand Visible Range.
Key Levels:
Resistance Zone: $2,570 – $2,620 (Heavy Supply Zone)
Current Price: $2,555
First Major Support: $2,207 (Previous consolidation breakout zone)
Critical Demand Zone: $1,756 (Weekly demand and strong historical support)
Bearish Pressure Signs:
Multiple rejections from the supply zone.
Price failing to make higher highs.
Bearish candlesticks forming under key resistance.
My Take:
If Ethereum fails to break above this resistance zone, expect a possible retracement first to $2,207, and possibly deeper toward the $1,750s if broader market conditions worsen (e.g., risk-off sentiment or BTC dump).
What to Watch:
Daily close above $2,620 = bullish continuation.
Break below $2,500 = bearish confirmation for potential drop to $2,200 and lower.
Strategy:
Swing traders should look for a short setup near current levels with tight stop above $2,620, targeting $2,207–$1,756. Long entries only above confirmed breakout and retest of the supply zone.
What are your thoughts? Will ETH break out or break down?
#ETH #Ethereum #Crypto #TradingView #TechnicalAnalysis #ETHUSD #LuxAlgo #SupplyAndDemand

ETHUSD Weekly Breakout Incoming? Targeting $3,250+Ethereum (ETHUSD) is setting up for a major directional move on the weekly chart, and all eyes are on the key breakout zone above $2,800. Let’s walk through the analysis behind this swing trade idea and map out the key risk and reward levels:
▶️ Technical Story at a Glance:
After months of downside, ETH has rebounded sharply off the $1,600 zone (clear weekly demand and high volume).
Price is now pressing right up against a thick supply (resistance) zone that includes the psychological and technical resistance at ~$2,800.
We’re seeing several bullish technical signals align right as price approaches a potential inflection point:
• Weekly MACD Bullish Cross – signaling that longer-term momentum is flipping.
• StochRSI and PSAR bullish – suggesting upside is in play, not overextended yet.
• Volume profile supportive – no blow-off on the move back, buying looks organic.
• Ichimoku/Cloud structure – if price can get a weekly close above the cloud (and $2,800–$2,900 zone), that could mark a regime change back to bullish.
▶️ The Trade Idea:
Plan: Enter long on a confirmed weekly close above $2,800, as that would represent a powerful technical breakout.
Targets:
Primary: $3,250 (previous major supply/POI zone and clear chart resistance).
Stretch: $4,100 for those who want to trail stops and ride a potential trend.
Stop Loss: Below $2,350 (recent structure support and under the cloud) for smart risk control.
Risk Management: Size positions so no more than 1–2% of equity is at risk on the setup.
▶️ Trade Management & Execution:
Wait for confirmation — patience here beats trading early! Set alerts for a weekly candle close above $2,800 and confirm bullish behavior in MACD and trending indicators. Once triggered, enter the long with your stops in place and aim for the first major target at $3,250. Take partial profits along the way and move your stop to breakeven if the move continues in your favor.
▶️ Why This Setup?
This setup aligns multiple timeframes and indicator signals for a high-conviction swing trade. The next major resistance is still a good distance away, giving bulls room to run, while clear invalidation ($2,350) allows for controlled losses if the thesis is proven wrong.
▶️ Key Levels Recap:
Entry: Weekly close above $2,800
Stop: $2,350
Targets: $3,250 (primary), $4,100 (stretch)
Keep a close eye on volume, candle closes, and confirm momentum before executing. If price fails at resistance, step aside and wait for a better opportunity. Always trade your own plan and manage risk!

ETHUSD 5/16/25 UpdateHere is your update on ETHUSD via analyzing Cumulative Delta Volume (CDV), divergence between price and the Money Flow Index (MFI), and the 4h and D McGinley Moving Averages!
Happy trading, and I hope the video was helpful!

ETH 2nd rally to 2900 then 3000
Trend: Strong bullish momentum with price trading above key EMAs 10 20 50
Momentum: High RSI suggests strong buying pressure still above the red support line but also warns of potential overbought conditions could snap back would be worried unless we go below the 50 EMA.
Volume: volume is picking up again
MACD: temporary fear is fading out, greed is about to kicking again
Target 1 2800
Target 2 2900
Target 3 3000
Other bullish factor
A lot of positive headlines, government adoption , BTC is bullish. Good set up over all simple yet effective
Great risk reward opportunity !

ETH is moving within the 2,300.00 - 2,695.00 range👀 Possible scenario:
Ethereum (ETH) slipped 2.1% to just over $2,500 but remains up 30% for the week. Most holders are in profit, with key wallet cohorts having lower realized prices. Whale activity is being closely watched, as large sell-offs in the past triggered major drops.
Meanwhile, Starknet, an Ethereum layer-2, reached "Stage 1" decentralization — a key milestone toward full autonomy. It now leads ZK-rollups with $629M TVL, though it still trails far behind Base’s $14.7B and 33% market share.
✅ Support and Resistance Levels
Support level is now located at 2,300.00.
Now, the resistance level is located at 2,695.00.


ETH - Ethereum 15 Min Chart Opinions?ETH - Ethereum 15 Min Chart Opinions?
Not for financial advise
Not recommendations to buy sell any securities, stocks, FX or cryptos.
Do your own research for your own entertainment!

is ETH aiming for higher price?is ETH aiming for higher price? looking from market structure of ETH, ETH is now ready for another massive move on the higher price. Is this a indication of bulls coming back at the market? ETH should pass 2600 area if ETH like to target 2800 or even 3000 area

next wave is approaching for EthereumStochastic RSI has reset on different tf's. Bullish div on 4H btw

ETH ANALYSE We have two key levels to watch on ETH:
- Either the price reacts upwards on the $2401 level in H4,
- Or it falls further and reacts at the $2,121 Daily level.
Either way, the fall should not last too long.

EthereumETHUSD
- Fair Value Gap
- Bearish Channel as an corrective pattern in Short Time Frame
- Completed " 12345 " Impulsive Waves
- Break of Structure
- Change of Characteristcis


Ethereum - Short Term Buy IdeaH1 - Strong bullish move.
No opposite signs.
Currently it looks like a pullback is happening.
Expecting further continuation higher until the two Fibonacci support zones hold.
If you enjoy this idea, don’t forget to LIKE 👍, FOLLOW ✅, SHARE 🙌, and COMMENT ✍! Drop your thoughts and charts below to keep the discussion going. Your support helps keep this content free and reach more people! 🚀
--------------------------------------------------------------------------------------------------------------------
Disclosure: I am part of Trade Nation's Influencer program and receive a monthly fee for using their TradingView charts in my analysis.

Etherium..... Resisting at 50 % Fib RT.Though in an upward mood, the 50 % Fib RT seems a tuff nut to crack.
Expecting it to hold the 38.2 % Fib RT level of 2424, where the 200 DEMA too holds.
Lets see. Woukd love to add more at 2424 levels, with a strict SL if it daily closes below 2400.
Lots to learn from the markets.....
