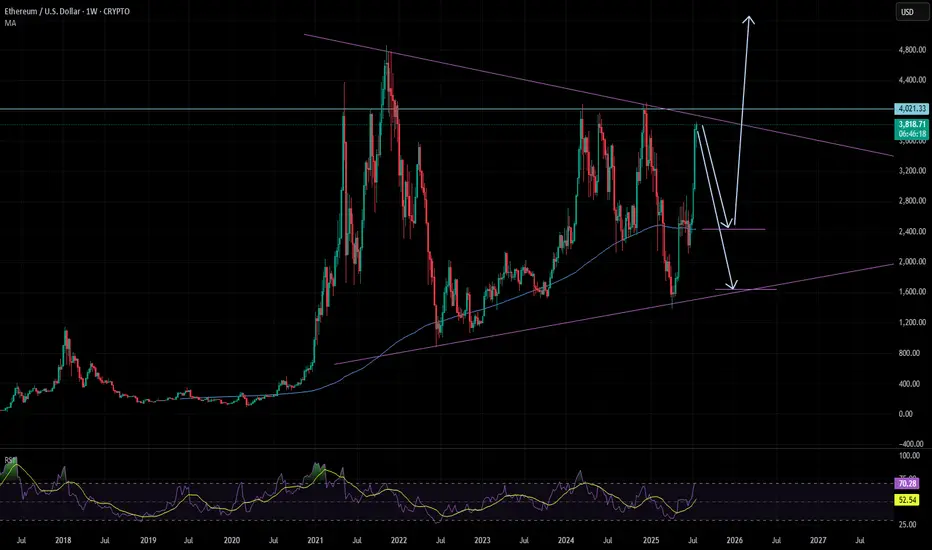
ETH is not going up soonETH made a beautiful bullrun from the trendline.
Now most people will be convinced we will break the 4K level and so straight up.
I'm not convinced, and that is because the last bullist candles are too extended. It's highly unlikely it will go straight up to + 4k from here.
Second we are in a massive triangle that has to play out first.
So what I believe will happen in the next months is that ETH will pullback to 2500 or even lower 1700. Allot of buyers that FOMO in now will be trapped and panic sell.
Then end on the year when QE has done and there is enough fuel to break out of the triangle. It will happen fast maybe arround nov / dec.
So don't fomo in wait
ETHEREUM trade ideas
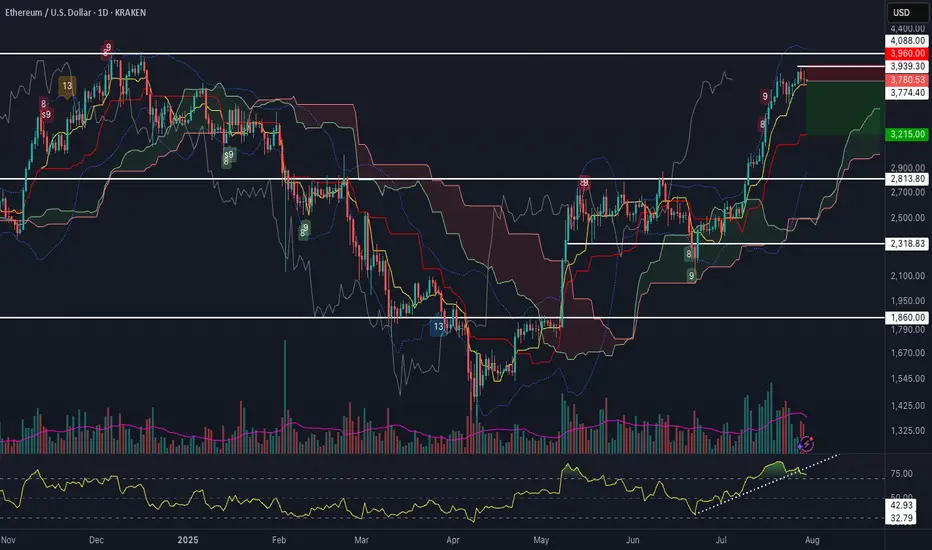
ETH Potential Swing ReversalAfter a strong leg higher, Ethereum is flashing a confluence of short-term reversal signals:
1. RSI trendline break on the daily, with bearish divergence building
2. %B Bollinger Band divergence, following three consecutive upper band taps during this move
3. Demark 9
4. Formation of a Doji candle at resistance, showing indecision near a key level
A clean break here opens room towards Ichimoku cloud support at $3,215.
🧠 Thoughts welcome!
ETH/USDEuphoria has been reached. Rally over.
Global freefall anticipated.
SPX or BTC should begin it.

ETH Reposition Play – VolanX DSS Sentiment Filter Active📉 ETH Reposition Play – VolanX DSS Sentiment Filter Active
🧠 VolanX DSS Triggered a Long Watchlist Signal
The ETH/USDT daily chart shows price stalling near the 0.786 Fib zone after a strong rally. Our proprietary DSS (Decision Support System) now monitors sentiment misalignment to prepare for the next institutional push.
🔍 Key DSS Observations:
Retail Sentiment: Fearful — retail bias flipped to short.
News Headlines: Negative — VADER sentiment ≈ –0.45.
Funding Rates: Flipped to negative across major exchanges.
Fear & Greed Index: 28 (deep fear zone).
📊 All 4 signals confirm contrarian long opportunity in “Reposition Zone” (≈ 3566–3280). Smart Money often absorbs panic exits before triggering the next leg.
🎯 DSS Strategy:
✅ Wait for confirmation at 3,280 or wick flush to 3,061.
📈 Potential upside target = 5,033 (1.618 Fib extension)
🛡️ DSS Sentiment Filter = ✔ Passed (4/4 bearish crowd indicators)
“When the crowd panics, liquidity positions. VolanX knows this.” – WaverVanir Protocol
📡 Signal monitored via VolanX Alpha Engine
🔒 Institutional tracking | AI-guided logic | DSS Probability Matrix
#ETH #Ethereum #Crypto #WaverVanir #VolanX #SmartMoney #SentimentTrading #AlphaProtocol #DSS #Reposition

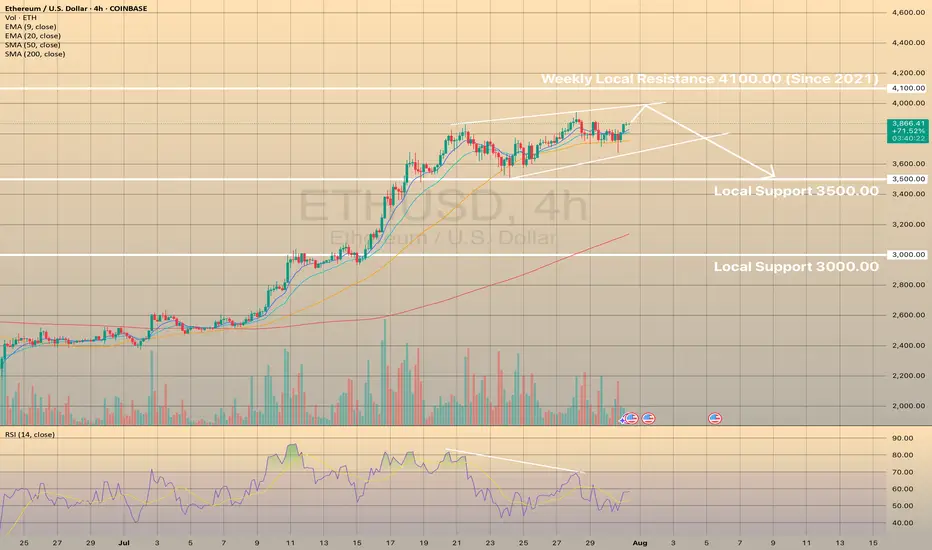
ETHUSD MAY FORM THE BEARISH WEDGE. THE PRICE IS GETTING READY TOETHUSD MAY FORM THE BEARISH WEDGE. THE PRICE IS GETTING READY TO DROP.
ETHUSD has been moving bullish since July 8. However since July 21 the price started to form the bearish wedge with bearish divergence on RSI on 4-h timeframe.
A bearish wedge is a bearish reversal pattern in an uptrend, where the price forms higher highs and higher lows within converging upward trendlines, signaling weakening bullish momentum and a potential downward reversal. To trade, identify the wedge with declining volume and confirm with RSI or divergence. Sell or short on a breakdown below the lower trendline with a volume spike. Set a stop-loss above the recent high or upper trendline. Target the wedge’s height projected downward from the breakdown or the next support level with a 1:2 risk-reward ratio.
We expect that the price will establish another bullish momentum and the price will go towards upper border of the wedge, slightly below the 4,100.00 resistance level and will decline towards 3,500.00 support level afterwards.
Strategic Long Position on Ethereum (ETH)
Ethereum's funding rates have spiked, reflecting an overcrowded long side. Such conditions often precede a long squeeze, as the market seeks to shake out overleveraged traders.
Despite this risk, the current bullish momentum justifies a tiered entry approach:
First Entry (Market Order): 3,790
Second Entry (Limit Order): 3,550
🛑 Stop Loss (for both entries): 3,400
🎯 Take Profit Target: 4,200
This setup allows participation in the upward trend while leaving room

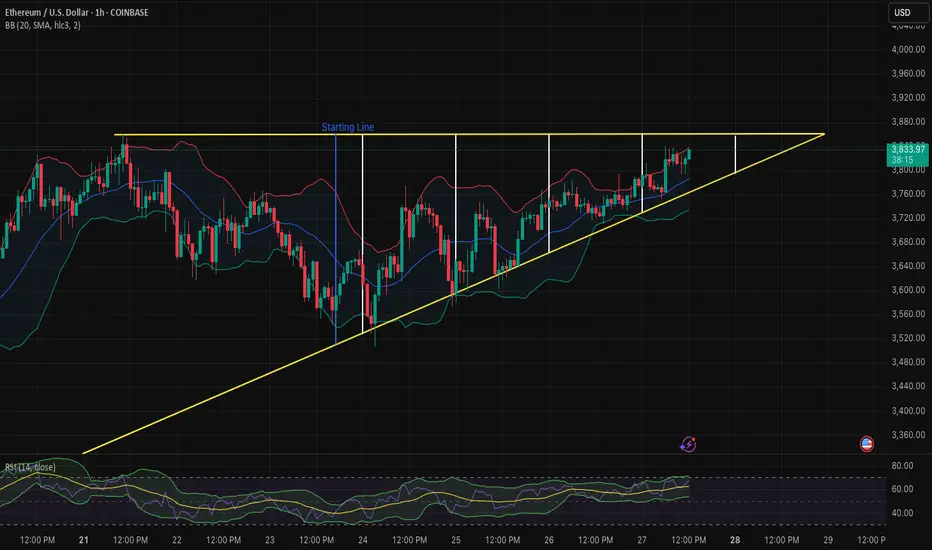
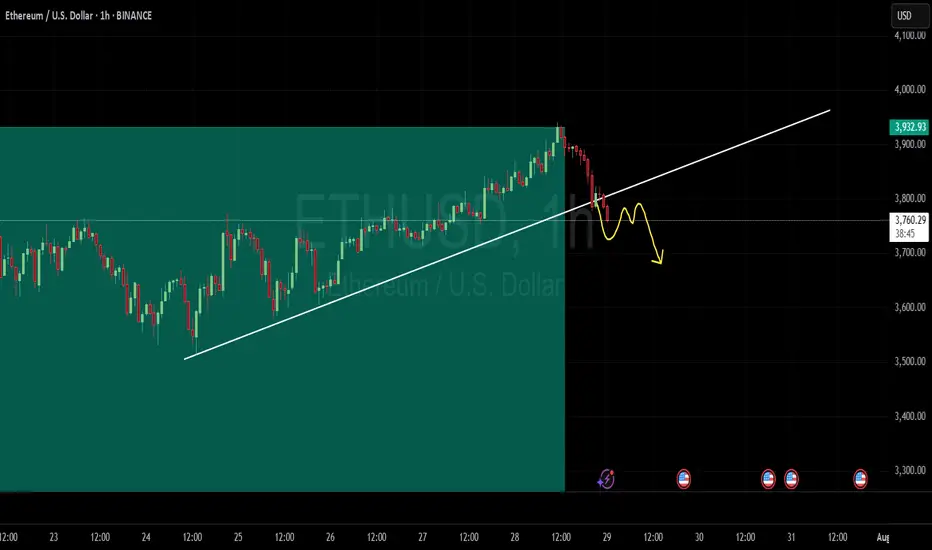
Will we finally test $3900?If this trend continues, we should be testing $3900 soon. It is also possible the magic lines I drew are making me see things. Let's see what happens, what do you guys think? $3900 today...or next month?
ETH potential reenteryHELLO THERE)
imma post here again
lemme know in what type of content ur intrested most
Ive been trading all that time
almost 8 years atm
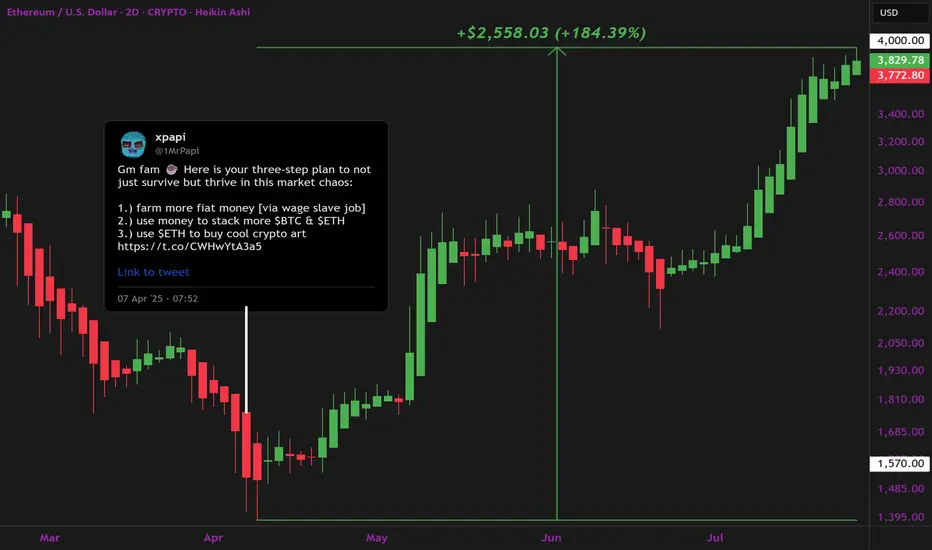
ETH - The Generational Opportunity Mere Months AgoMore of a hindsight than any prediction, though I believe alts and particularly ETH are going much higher still.
Buy when fear is peaked and blood on the streets. I posted tweeted over and over to buy when ETH when to it's lows in 2025. It was an absurd selloff probably manufactured to give funds and institutions a better entry, but the lagging ETH price action won't continue. Cat is out of the bag.
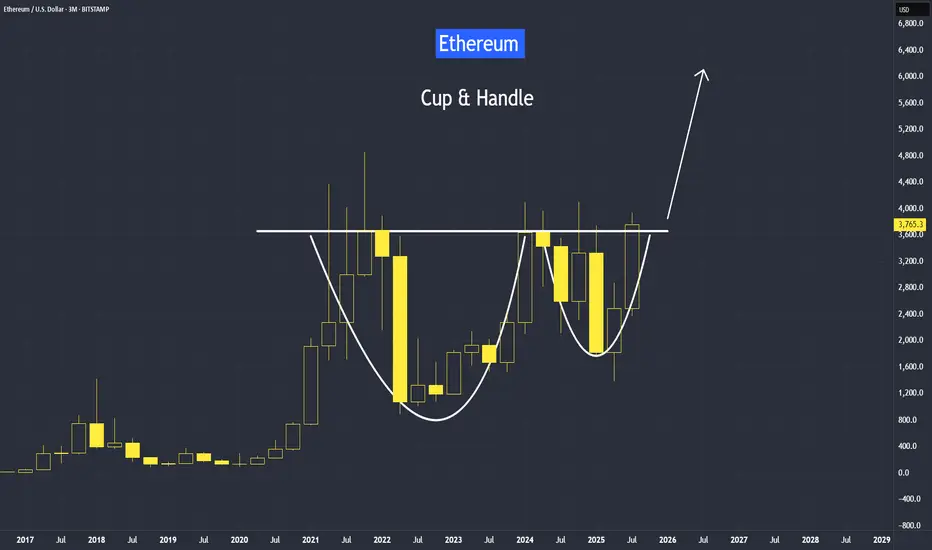
$ETH to $6.45k USD - 2024's Crescendo CRYPTOCAP:ETH is showing strong signs of an impending breakout to the $6.4k–$8k range, backed by two key technical indicators:
Cup & Handle Formation: ETH has recently broken out of a textbook cup and handle pattern, confirming the breakout with a solid retest over this past week of VOL. This is a classic bullish signal pointing to higher targets.
Bull Pennant: Since the 2021 rally, ETH has been consolidating within a massive bull pennant. This long-term structure suggests Ethereum is coiled and ready for a significant move upward.
1.618 Fib: Also layering in a Fibonacci retrace, if ETH is indeed heading for ATHs and price discovery, the 1.618 FIB is a common level that traders are very familiar with. It just so happens to be right in the middle of our target box at ~$7k!
Momentum is building— we will need to keep an eye on volume and follow-through for confirmation.
To boot, bearish sentiment for ETH is near all time highs. I think it might be time for a most-hated rally. I have a short term allocation in AMEX:ETHT to ride this momentum, NFA DYOR

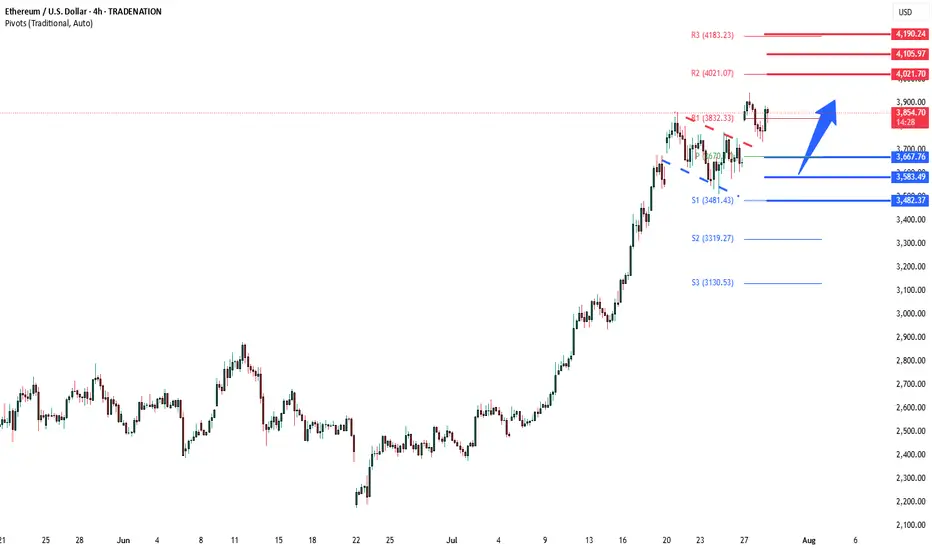
ETHUSD Bullish Flag breakout support at 3,667The ETHSD remains in a bullish trend, with recent price action showing signs of a corrective pullback within the broader uptrend.
Support Zone: 3,667 – a key level from previous consolidation. Price is currently testing or approaching this level.
A bullish rebound from 3,667 would confirm ongoing upside momentum, with potential targets at:
4,020 – initial resistance
4,105 – psychological and structural level
4,190 – extended resistance on the longer-term chart
Bearish Scenario:
A confirmed break and daily close below 3,667 would weaken the bullish outlook and suggest deeper downside risk toward:
3,584 – minor support
3,482 – stronger support and potential demand zone
Outlook:
Bullish bias remains intact while the ETHUSD holds above 3,667. A sustained break below this level could shift momentum to the downside in the short term.
This communication is for informational purposes only and should not be viewed as any form of recommendation as to a particular course of action or as investment advice. It is not intended as an offer or solicitation for the purchase or sale of any financial instrument or as an official confirmation of any transaction. Opinions, estimates and assumptions expressed herein are made as of the date of this communication and are subject to change without notice. This communication has been prepared based upon information, including market prices, data and other information, believed to be reliable; however, Trade Nation does not warrant its completeness or accuracy. All market prices and market data contained in or attached to this communication are indicative and subject to change without notice.
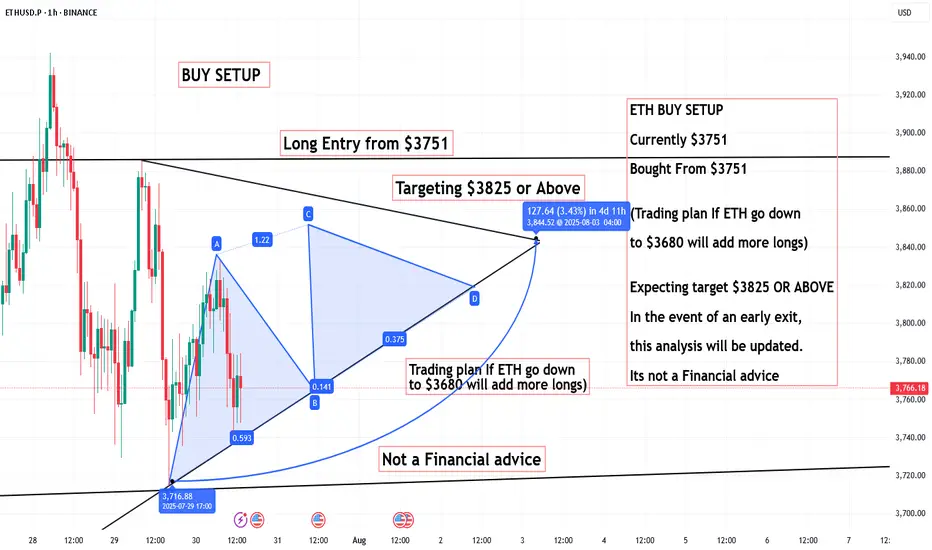
ETH BUY SETUP, Bought From $3751ETH BUY SETUP
Currently $3751
Bought From $3751
(Trading plan If ETH go down ,
to $3680 will add more longs)
Expecting target $3825 OR ABOVE
In the event of an early exit,
this analysis will be updated.
Its not a Financial advice
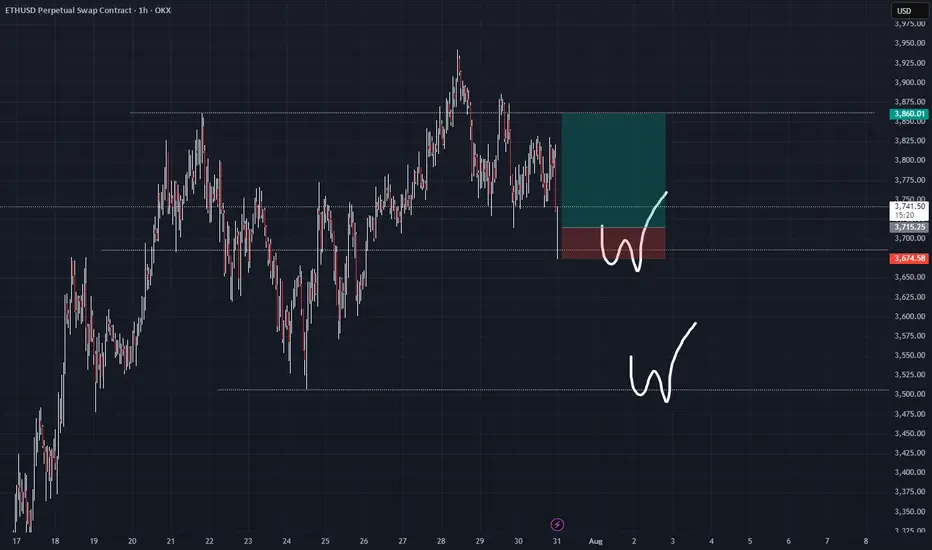
Eth next bottom (T2)As anticipated, my bearish T1 target (red) was hit soon after I first posted this chart on July 23rd 2025.
As the arrow indicated, Eth would bounce from my bearish T1 (red) to my bullish T1 (green). This has been confirmed in both price and in the timeframe indicated by my boxes.
There was also a downward arrow from my green T1 pointing towards my bearish T2 (red). Eth is already retracing from my top target, and I belive it will now continue down the red channel towards T2 and possibly T3 (between $2990 - $3200)

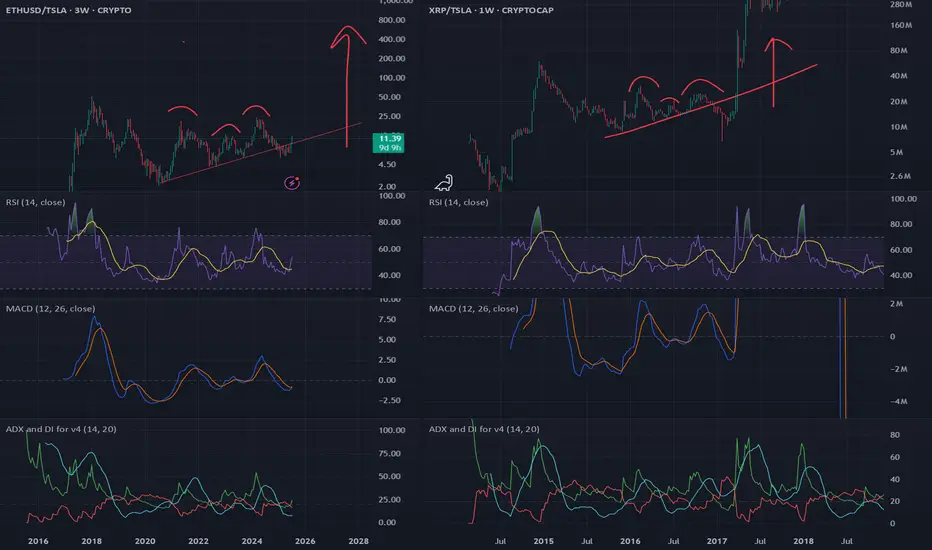
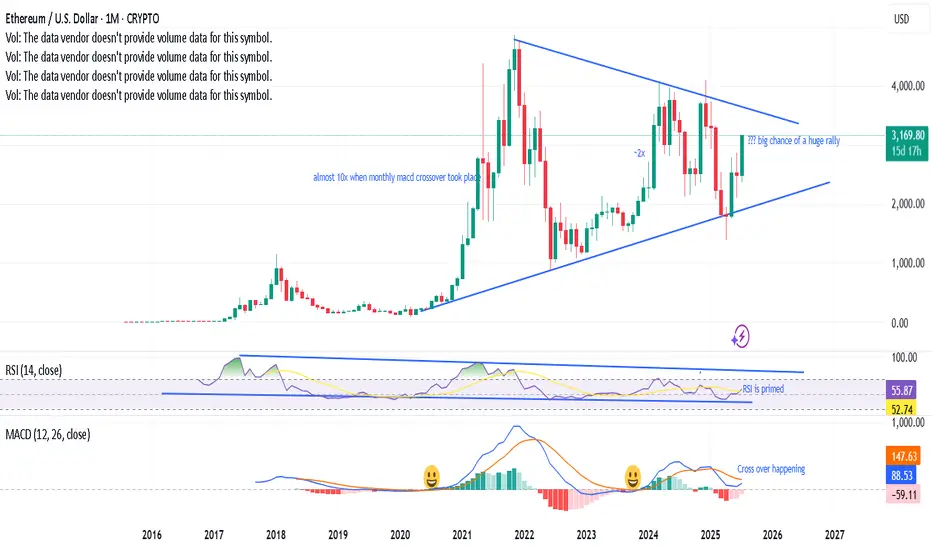
Monthly MACD crossover taking place, a prabolic rise?Last 2 times, when the monthly MACD cross over has happened, ETH has gone bonkers. A third one is on the verge of happening, RSI has enough room with a symmetrical triangle with bullish momentum - looks like a big rally is in the near horizon. Fingers cross.
ETHUSD Key Zone Retest – Bullish Momentum Above 3,760?Price surged past the 3,537.93 and 3,762.20 zones, holding gains above both. The current daily candle shows consolidation just above the 3,760 zone after a strong impulsive move.
Support at: 3,762.20 🔽 & 3,537.93
Resistance at: 4,056.40 🔼
🔎 Bias:
🔼 Bullish: If price continues to hold above 3,762.20 and closes strongly above this zone, we may see continuation toward 4,056.40.
🔽 Bearish: A daily close back below 3,760 could open room for a deeper correction toward 3,537.93 or even 3,040.00.
📛 Disclaimer: This is not financial advice. Trade at your own risk.

ETHUSD - Bearish But patternThe price completed the bearish bat harmonic pattern.
The level is additionally confirmed by another Fibo measurement and the price is at levels where usually returned.
Yet, the surging USD is a bearish factor.

ETHUSD: Bearish Divergence + Double TopHi everyone!
Ethereum – Double Top with Bearish Divergence
On the 4H chart, ETH is forming a clear double top while MACD prints a strong bearish divergence, signaling momentum loss.
📉 Neckline: $3,500 – this level acts as the key trigger.
🔻 Target: $3,000 – aligns with the 0.618 Fibonacci retracement and previous demand zone.
A confirmed break below $3,500 would validate the pattern and open the way to a deeper correction into the $3,000 area. As long as price stays under the second top, the bearish setup remains active.

Eth next target (T2)As anticipated, my bearish T1 target (red) was hit soon after I first posted this chart on July 23rd 2025.
As the arrow indicated, Eth would bounce from my bearish T1 (red) to my bullish T1 (green). This has been confirmed in both price and in the timeframe indicated by my boxes.
There was also a downward arrow from my green T1 pointing towards my bearish T2 (red). Eth is already retracing from my top target, and I belive it will now continue down the red channel towards T2 and possibly T3 (between $2990 - $3200)

Bullish Projection • Target Area: ~$4,080 – $4,100
• Current Price: ~$3,761
• Pattern Basis: Falling wedge breakout with expected move toward the target range.
• Risk Area: Highlighted in red below current price zone (~$3,700) indicating a stop-loss zone.

ETH BUY SETUP ,Bought From $3740ETH BUY SETUP
Currently $3740
Bought From $3740
(Trading plan If ETH go down
to $3680 will add more longs)
Expecting target $3815 OR ABOVE
In the event of an early exit,
this analysis will be updated.
Its not a Financial advice

Cup and Handle Setup in Ethereum Since April trough, Ethereum has risen by 179%, delivering a higher rate of return than Bitcoin at 66%.
But most of our attention is on Bitcoin, breaking above the 120,000 level.
Why is Ethereum quietly gaining ground —and what does the future hold for Ethereum?
It's video version on its trading strategies:
Mirco Bitcoin Futures and Options
Ticker: MET
Minimum fluctuation:
$0.50 per ether = $0.05 per contract
Disclaimer:
• What presented here is not a recommendation, please consult your licensed broker.
• Our mission is to create lateral thinking skills for every investor and trader, knowing when to take a calculated risk with market uncertainty and a bolder risk when opportunity arises.
CME Real-time Market Data help identify trading set-ups in real-time and express my market views. If you have futures in your trading portfolio, you can check out on CME Group data plans available that suit your trading needs www.tradingview.com