[$ETH] La phase d'accumulation par Wyckoff arrive à sa fin ! ATTENTION -
Départ imminent pour la phase E du schéma de Wyckoff , elle correspondrait à la phase 5 d'impulsion haussière des vagues d'Elliot
Mark up phase !
school.stockcharts.com
Trade Safe, Stay Safe
PEACE!
ETHEUR trade ideas


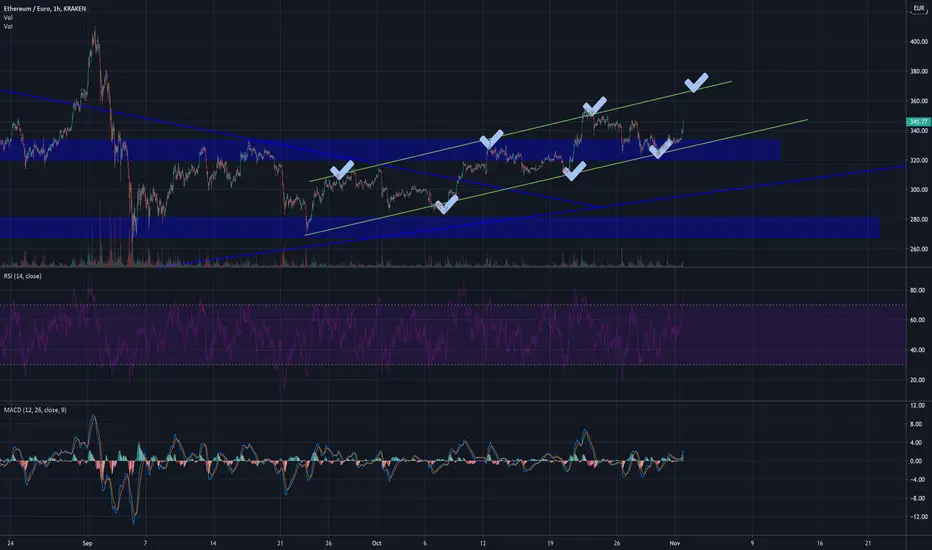
ETH-EUR - MUST LIKELY 370 EUR IN SHORT TERMIf you have seen my previous trade, this is a continuous analysis of the eth price movement.
Long trade here.
This is not financial advise.


buy ETH/ EURthere is high chance the price drop to reach color zone it could be the best entry for week


ETHEURIf markets doesn't crash price will rise till launch of 2.0 (precise date still need to be set)


ETH is in favors of the bullsPrice formed a clear ascending trendline (slashed in white), RSI is above 60 plus recently MAs are slopping up.
I would expect bears to fight at resistance around 380 €.
A break below the trendline will be a weak signal.


Diamon pattern ETH for long term NIce flawless incoming diamon pattern.
Might update guide if necessary

The rise of ETH from March to October 2020Incredible grow. I wonder how ETH this will be affected when the cryptocurrency moves from Proof of Work (Mining) to Proof of Stake. Any expectations?
Please share your thoughts


(ETHEUR) Ethereum Fractals: €905 or €188?ETH has broken away from it's 2017 fractal structure, now suggesting a return to the norm of the VPVR point of control around €188 ($221) may be in play. Expect the 150 MA at €274 ($322) to be defended if price falls lower, as well as the old resistance level of the 2-year long resistance trend-line, followed by volume and long-term moving average support within the €181-204 support level ($213-240).
Either way, a 67% retracement from recent higher highs wouldn't be out of the question, as it would still confirm a bullish long-term structure of macro higher highs and higer lows over a 20 month long period. Neither would a 3x from the current level of the 0.618 fib retracement to the 2.618 fib projection.
If price breaks down from the neutral zone, it's also likely that it won't complete the 2019 winter fractal, instead finding long-term support from the VPVR point of control as well as 50 & 100 Week MAs, that represent median prices from the past 1-2 years approximately.
This is no time to be going short imo, only to be eyeing up the dip. October vibes are telling me to be patient before longing any more ether.
Bitcoin dominance continues to consolidate at the lows around 60 in a bearish manner, but ETH remains in no mans land.
Altcoin Speculation Coming Soon...
Altcoin Dominance Eyeing Up A Breakout to 40%


ETHEUR longterm weekly macd-evaluationA ETHEUR longterm weekly macd-evaluation seems to give a fairly indicative picture. After the MACD of this timeframe shifts towards lower levels the price does not fail to continue a significant set-back.
Aproximate numbers, measured from the highest price before the arrow, to the lowest on the slope (errors may occure):
Jul -17; 234€ (68%),
Aug -17; 165 (50%),
Jan -18; 1200 (95%) un-relevantly large?
May -18; 620 (90%),
Jul -19; 210 (66%),
March -20; -180€ (70%),
Aug -20; so far 140€ (35%).
Now, the current change is quite flat, so it may or may not tip over, but if it does, a significant downside becomes more likely.
Also take a look at the yellow pre 2018 recistance.


ETH retracement IIA followup on my previous post, with a larger picture.
It seems that the .236 level might be holding, meaning the down-trend will soon continiue.
If not, the next fib.- levels are at 319 € and 336, the last one i consider to be downtrend-breaker-indicator.
We also see that the .5 level (336) resisted on the 17th, indicating that it was not possible to turn the trend at that point at least.

Eth retracement?The Ether-price went out of the triangle mentioned in my previous post, down to about 270€ shortly, as suggested.
Now the question is if that was a retracement in the up-wards trend or if this is one in the down-trend. If the price makes a clear crossover of the fib. -0.5 level (at 301-302€), the upwards trend might still be alive. If not it still loks like short to me.
Any ideas?
