ETH swing high above 255EUROnce 255eur cleared, all ingredients here for a run to 300 and maybe more:
- Stochastichs is overbought
- RSI rising but still in bear area
- Price above 10dma
In the coming days I am looking for the breakout of 255 and a retest with an hidden positive divergence on stochastics oscillator
Not calling the end of the bear market.
ETHEUR trade ideas
Hypothetical cup and handle for ETH?Well, I actually share this chart mostly to keep a track on personal thoughts but I'd appreciate some feedbacks :)
ETH looks oversold. RSI, MACD, StochRSI show potential for a nice way up. Volume is increasing even though it would be better if we could see more.
In the mean time the bear trend is quite strong and some bulls are waiting for 200 EUR or less.
Unclear Pattern ETH 4H ViewHello Mates,
Ethereum has an unclear pattern,
I could handle the support and get up with the triangle, but also has some technical possibilities to join the lower support
more over the indicators have some bullish divergences on RSI and MACD thus it is unclear is the price will really drop.
Happy trading cheers!!
ETH EUR are we in the last dump finally?Fractals are sometimes difficult to spot are some of their parts are evolving in shape or length but the most important is to catch the trend; it seems this fractal is still repeating and that is going to be finally the last dump before initiating a bullish trend. Here is the fractal I'm talking about:
It looks we have the "M" shape first and the the last bounce before the big jump; so we're between "3" and "4", and after we'll experience a succession of 3 series of bounces/pumps to confirm we're in "5"; these pumps may be massive (the trend is represented in purple lines)
Fingers crossed ;-)
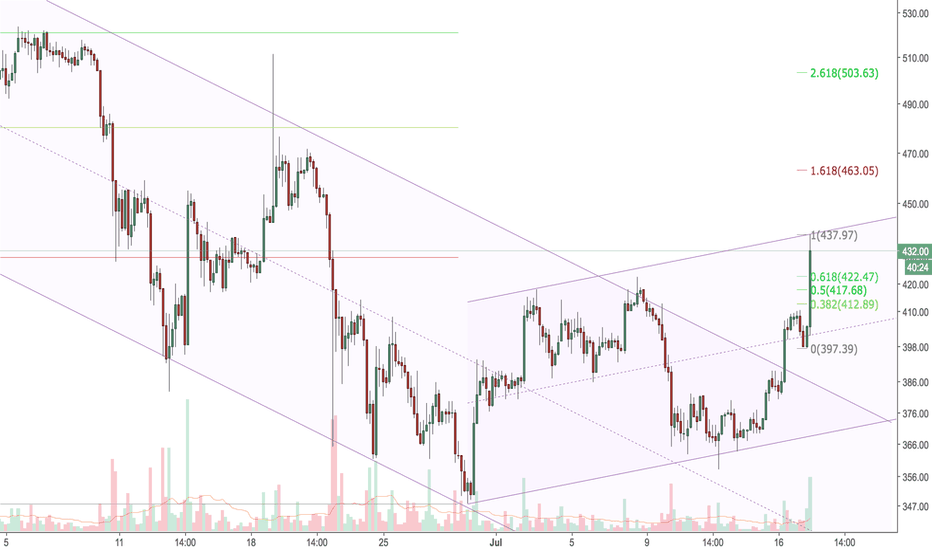
ETHEUR - channels, againLevels from the last analysis (the linked one with canceled trade) were never reached, so time for new one.
ETH touched the 0.618 Fib level of last drop and the middle of the uptrend channel. Pullback is expected to the bottom of the channel, somewhere around/between 382 and 385, with targets at 415 and 440. Initial stop loss will be set at 358 and will be moved higher when appropriate time comes.
Disclaimer: this idea is solely for my own purposes, to satisfy the ego, if it will work out ;)
Larger view:
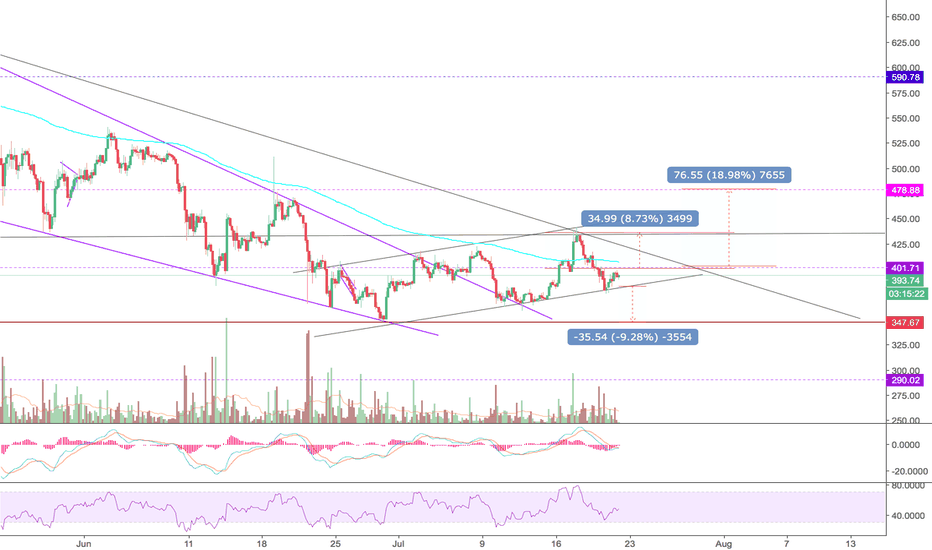
ETHEURETH can be trickier/riskier than BTC. It can also just hit 420 level and run again, but it can also drop all way down to the middle of channel somewhere over 400. More patience and lower timeframes will be used to see how it will behave.
I'll post updates (regularly, hopefully :)
Disclaimer: this idea is solely for my own purposes, to satisfy the ego, if it will work out ;)
Daily chart:
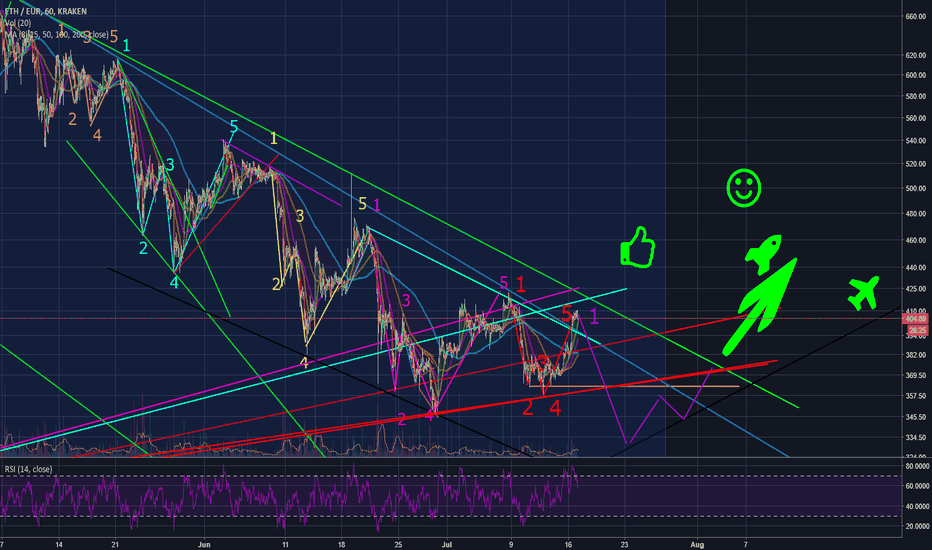
ETH EUR H1 - Surprise!ETH came back in its previous bearish channel after this surprising short squeeze; but the trend seems to follow back the fractal: this pull back make me strongly believe ETH will dump until it bounces on its main daily channel (black lines).
So, why such a dump until this level? Look closer at the BTC/USD chart: BTC maitains its level since 3 days as ETH has formed a H&S :
The reason for this is found in the ETH/BTC chart :
Since 4 days, ETH/BTC is bleeding out and that's why ETH moves are so bearish.
We know that ETH and BTC are linked, so the question is what will happen when things will go back to normal?
2 possible scenarios:
1st: ETH will pump, initiating a BTC pump
2nd: BTC will dump, ETH will also go bearish but slower and gaining in BTC at the same time, and after bouncing on their daily bullish main channel, they'll start the bull run that everyone is waiting for.
2nd scenario seems the most possible to me, as I'm expecting now a long squeeze after the short one ;-)
By the way, there are many lines on the chart, the purple one are describing the way I think ETH will take :-)
ETH EUR H1 - new fractal cycle incoming before bull runI didn't see that one coming! I thought it would have been the last moves before the last dump, but it seems another cycle is taking place. Previous moves from BTC chart also tends to confirm we're heading to a strong correction before the moment we're waiting for... ;-)


