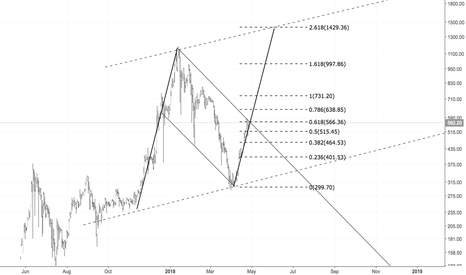
ETHEUR buying opportunityLooks like sell pressure is dropping, at least shortterm. Might be a nice pyramid opportunity, but let's wait until confirmed. What do you think? Will the drawn support hold?Longby jurepetrovic4
Short setup for EthereumThis is a fractal for the adam and eve top further down. assuming that BTC will move towards, but fail at 10k.Shortby Spaghettimonster1
ETH/EUR long setupETH/EUR tests 110-EMA at 514 levels, decisive break above could see further upside. The pair is trading with a bullish momentum and decisive close above 110-EMA could see extension of gains. RSI shows strength at 69 levels with room to run further. The pair also finds stiff resistance at 200-DMA at 520. Next major resistance above 200-DMA lies at daily cloud at 575 ahead of 38.2% Fib at 621. On the downside, we see immediate support at 5-DMA at 496. Bullish invalidation likely below 55-EMA at 467 levels. Support levels - 496 (5-DMA), 467 (55-EMA), 429 (21-EMA) Resistance levels - 575 (cloud base), 600, 621 (38.2% Fib) Good to go long on decisive break above 200-DMA, SL: 465, TP: 600/ 620Longby FxWireProUpdated 9
BUYING OPPORTUNITY! Triangle about to break upwardsSimetric triangle. Volume confirms the triangle. ABCDE almots done. MACD in a support level (Pink line) RSI in a support level (Pink line).Longby keep_it_simple227
EHTEUR Long position until the next resistanceUp Trend after consolidation time Good news Very good possibilities of rewards Take profit at the next resistanceLongby cross1963
Short Trade - DoubleTop on ETHEURIf price drops below €590, open a short position with minimum target of €575.Shortby youthfulguru0
ETHEUR Let's wait a little for LONGShortterm - if you're waiting for an entry let's wait a little to touch the triangle again. In you're in, stay in and enjoy the ride :)Longby jurepetrovic0
You showed me the way (ETH)The recent dip took me back to the drawing board and I'm still in a long position and the outlook is great. Symmetrical triangle can transform to a gigantic bull flag opening doors to uncharted territory. We have a potential inverse head and shoulders forming as well. Good stuff. ETH is playing the symmetry perfectly and fibs are showing the way. Don't doubt, just believe !Longby ethhunterUpdated 2213
WATCH OUT! Tripple topIF price breaks down the pink line, then price will drop significantly.Shortby keep_it_simple2
Expecting breakout ETHEUR!Expecting this breakout in the coming days. And yes, this is emotional! :)Longby jurepetrovic0
ETH Triangle Pattern Bull or Bear Breakout ? Target 725€ETH has previously confirmed its reversal bull trend. Reaching quickly the 578€ level (transposition of depth of cup&handle formation - see my previous idea) and correcting brutally until shot-term support trend line (blue). Despite bouncing back, it broke-down the first support trend line, indicating bear signal, forming a pennant pattern. In case of a bull breakout we have our trigger at >580€ (if candle confirmed) and our first target around 600€ level (transposition of triangle height) and second target around 725€ level (transposition of scale stairs as see in screenshot below). RSI mid range (50 now) so more up is possible. This scenario would make a nice validated continuation pattern. In case of a bear breakout, very likely fall until support zone (435-485) as shown and expected bounce back. by AyenUpdated 4
A closer look on the dip (ETH)Smaller timeframe shows the "real" breakout should be happening very soon approx, 2-3 days. I bought the dipLongby ethhunterUpdated 4
It's time for another boost up (ETH)Good oppertunity The chart tells us why Keep it simple...Longby ethhunterUpdated 11116
ETHEUR ascending triangle setupThere is a big ascending triangle on ETHEUR @2h, which is also seen on daily chart. We've got all the ingredients for a bull continuation after the European holidays :)Longby jurepetrovic1
Do you think my wave count is correct Hi, I believe we are riding wave 5 of Elliot wave, any comment are welcome ! Longby sanad001221
ETHEUR triangle setupETHEUR is reaching breakout zone on the symmetrical triangle. Let's see if there is enough bullpower to reach the higher high! Longby jurepetrovic0
Update on ETHSince ETH had a strong correction yesterday ETH failing to crack the 580€ resistance, it is now consolidating in the bottom of the green uptrend channel. Since the support of this channel stoped ETH from loosing more we can still expect the rally to go on in the next couple of days. Personally I expect it to retest 580€ and even crack it by the end of next weekend. --- Keep in mind this is no investment advice just my thoughts.Shortby SkillzzzUpdated 4
ETH down. To know why, enter here and check the fractals.Hi, there. As I said to you, there are amazingly similar patterns (fractals) in these two mountains. If you think it will go to $1400 or close, I think you can wipe your accounts off. Why do I know it goes down and can imitate the same behaviour? Well, this last bullrun was the Wave 4 of the correction, and now, it needs to go down again and complete the Wave 5. Trade at your own risk. I’m not responsible of your actions. Have a nice day! :)Shortby AndbcoinUpdated 559
ETH/EUR Elliot wave count and targetsWave 5 of Wave C of wave B yet to come. Short entry around 560 euros Target around 470 euros Shortby CrptTeddyBear110
ETH - Pullback may have further to goTop chart is daily with SMMA 20, 50 and 200. Plus RSI. Bottom chart is the same, but hourly. After a nice bull run we've got a pull back. Likely we'll pull back further before potentially continuing. Current status: - Price has pulled back, we've crossed the daily 50 SMMA going *down* in price. - On the hourly, it looked like we might form a "power v" which failed, then maybe a "double bottom" which *appears* to have just failed. - Strong support round the €495/$600 area. - Hourly downward trendline (red) - Overall trendline (pink) is still up, so long term still positive. What next? Potential support for a range around 20SMMA and the recent support area - so around €404-€460 ($491-$560) - but I wouldn't bet on that. Although this is also around 0.786 fib retrace from ATH, so it might hold. Aside from that, there's a potential support range between the long term trendline (€234) and 1 fib retracement (€253). If we fell through this, we'd have to rethink. Overall, I'm still long term bullish on Ether. This pullback is healthy - as long as it doesn't cause a selloff and fall through strong support zones. At the moment, I'm not in the market placing any trades. I'll wait until we break the current hourly downward trend in a strong fashion before re-entering. (Secured some profit yesterday, selling some positions taken out around €315, just in case this pullback goes further than desired. by Meniro1
Will ETH crash again?The green lines show the main upward channel of ETH. ETH went a little too high yesterday and left the channel to the top where it tested multiple times 580 but hit very strong resistance. Therefore it had to retract back in the channel where we are now checking the bottom. So the are two possible outcomes: 1. We can hold the bottom of the channel wich sends the price up again to recheck 580 resistance in a couple of days. 2. We don't hold the bottom of the channel and might fall back to 400 again.by SkillzzzUpdated 2