ETHFI/USDT – BREAKOUT ALERT! Descending Trendline Under Pressure
After over a year of relentless bearish pressure, ETHFI is now approaching a critical technical juncture that could mark the beginning of a major trend reversal. The chart displays a long-term descending trendline, and bulls are now challenging it with growing strength. This setup could lead to a powerful breakout and a potential trend shift.
🧩 Technical Pattern Overview:
🔸 Descending Trendline Resistance – Established since April 2024, acting as a dominant resistance across multiple retests.
🔸 Base Accumulation – Price has formed a strong base between $0.80–$1.00, indicating declining selling pressure and potential accumulation.
🔸 Volatility Squeeze – Price action is tightening near the apex of the descending triangle, suggesting that a breakout (up or down) is imminent.
🔸 Breakout Watch – A confirmed breakout above $1.25 would be a major bullish signal.
🐂 Bullish Scenario (Confirmed Breakout):
If the price breaks and closes above $1.25 with strong volume:
🎯 Potential Upside Targets:
Target 1: $1.784 – Previous local resistance
Target 2: $2.390 – Former consolidation zone
Target 3: $2.959 – Key psychological resistance
Extended Targets: $5.024 and $7.001 if a sustained rally unfolds
Ultimate ATH: $8.660 – If the broader crypto market enters full bullish mode
💡 Catalysts to Watch: Altseason, project news, favorable macro sentiment, or exchange listings.
🐻 Bearish Scenario (Rejection at Resistance):
If ETHFI fails to break out and gets rejected at the descending trendline:
🔻 Potential Downside Levels:
$1.088 – Immediate support
$0.88 – Minor support
$0.70 – Historical support zone
$0.50 to $0.35 – Deeper bearish targets if selling resumes
⚠️ Fakeouts are common during volatile phases — always wait for confirmation with volume.
📌 Conclusion & Strategy:
ETHFI is at a make-or-break level. A confirmed breakout could trigger a strong upward rally with high risk/reward potential. However, failure to break resistance could lead to continued consolidation or even downside.
🔍 Traders should watch for a clean breakout above $1.25, preferably with high volume. Risk management is key — define your invalidation levels and stick to your plan.
🧠 Trading Recommendations:
🟢 Breakout traders: Wait for confirmation > $1.25
🟡 Accumulate: Between $0.90–$1.00
🔴 Stop-loss: Below $0.85 for conservative risk
📈 Risk/Reward after breakout: Attractive (1:3 or better)
#ETHFI #ETHFIUSDT #CryptoBreakout #DescendingTrendline #AltcoinAnalysis #TechnicalAnalysis #BreakoutTrading #CryptoSignals #BullishReversal
ETHFIUSDT trade ideas

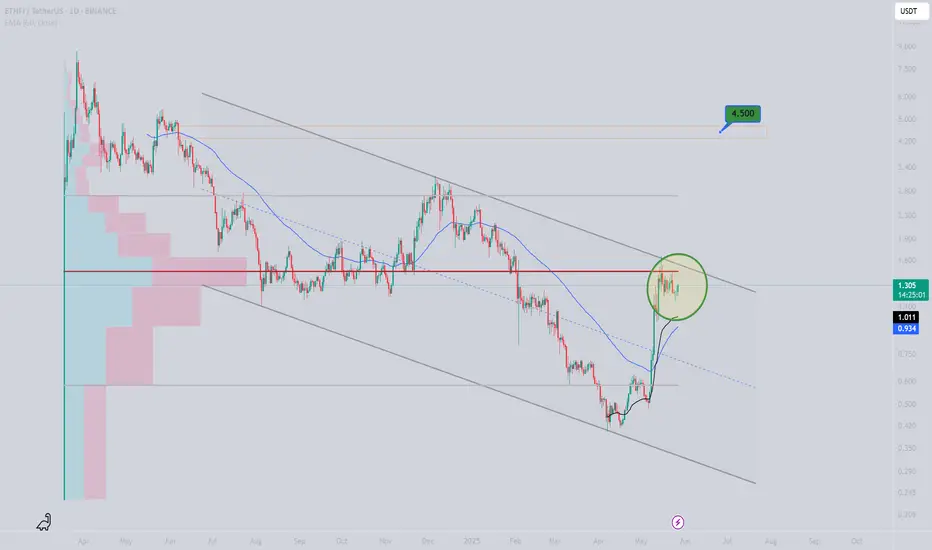
ETHFI _ just went Long reading the waves and Speed IndexReading the recent history of the waves (annotations in sync with the chart):
1. Support
2. Huge volume on PVR indicator at the bottom (buyers)
3. Abnormal Speed Index 55.7 on the down wave , that's Hard to Move Down , more buyers
4. Finally the Entry on a PRL signal.
Enjoy!
PS. I have no idea what this ETHFI crypto is, I just analyzed the chart and it looked like a high probability trade.

ETHFI - Target ReachedTarget reached closed with profit - let's not be greedy - this has a resistance level quite a few times
Enjoy trading with Volume Waves and Speed Index.
Enjoy trading because the chart reading says so not because because an indicator says so!!!

Buy Trade Strategy for ETHFI: Tapping Into the Future of ETH Title:
Buy Trade Strategy for ETHFI: Tapping Into the Future of Ethereum Restaking
Description:
This trading idea is centered on ETHFI, the governance token of the EtherFi protocol, a rising player in the Ethereum liquid restaking ecosystem. ETHFI empowers users to participate in the decentralized governance of EtherFi while benefiting from innovative staking models that unlock liquidity for staked ETH. As Ethereum continues to evolve post-merge, protocols like EtherFi aim to maximize staking efficiency and accessibility, making ETHFI an integral part of the Ethereum restaking narrative. Its unique position in this emerging sector, coupled with increasing adoption and ecosystem development, suggests strong long-term potential.
Nevertheless, the crypto market remains highly volatile, and investments in tokens like ETHFI carry inherent risks influenced by regulatory decisions, protocol upgrades, and broader market dynamics. Prudent risk management and informed decision-making are crucial when engaging with early-stage governance assets.
Disclaimer:
This trading idea is for educational purposes only and should not be considered financial advice. Cryptocurrencies, including ETHFI, involve a high degree of risk and may result in total loss of capital. Always conduct your own research, consider your financial situation, and consult a licensed financial advisor before making any investment decisions. Past performance is not a reliable indicator of future results.

ETHFI - Reached first target level - resistanceFollowing previous idea, the questions is ? let run or close it ?
One thing is for sure, move stop above break even to get some profits if you decide to let it run price turns.

ETHFI Key Reclaim Watch — Only Long Above $1.09 Confirmation✅ Price currently below major 1D S/R — no bullish bias yet
✅ Only looking for a long entry after confirmed reclaim of $1.09
✅ Structure remains bearish until then
Primary Scenario (Bullish):
Enter long only after confirmed reclaim/close above $1.09
Targets: Move to upper range ($2.76) on strength
Bearish/Flat Scenario:
If price fails to reclaim $1.09, no position — stay sidelined
🔔 Triggers & Confirmations:
Only long above $1.09 with confirmation (candle close, volume spike, or strong reclaim)
No trade below $1.09
🚨 Risk Warning:
Structure remains bearish below $1.09 — avoid bottom picking or forced trades

ETHFIUSDT Breakout Loading!CRYPTOCAP:ETHFI is consolidating within a symmetrical triangle on the 4H chart, with price tightening between descending resistance and rising support. A breakout or breakdown is likely soon. Watch for volume confirmation. Key levels to watch: $1.35 (resistance) and $1.00 (support). Breakout could lead to $1.50+, while breakdown risks a drop toward $0.95.

ETHFI/USDT10 hours ago
Key Level Zone: 1.1560 - 1.1630
LMT v1.0 detected.
The setup looks promising—price previously trended upward with rising volume and momentum, then retested this zone cleanly. This presents an excellent reward-to-risk opportunity if momentum continues to align.
Introducing LMT (Levels & Momentum Trading)
- Over the past 3 years, I’ve refined my approach to focus more sharply on the single most important element in any trade: the KEY LEVEL.
- While HMT (High Momentum Trading) served me well—combining trend, momentum, volume, and structure across multiple timeframes—I realized that consistently identifying and respecting these critical price zones is what truly separates good trades from great ones.
- That insight led to the evolution of HMT into LMT – Levels & Momentum Trading.
Why the Change? (From HMT to LMT)
Switching from High Momentum Trading (HMT) to Levels & Momentum Trading (LMT) improves precision, risk control, and confidence by:
- Clearer Entries & Stops: Defined key levels make it easier to plan entries, stop-losses, and position sizing—no more guesswork.
- Better Signal Quality: Momentum is now always checked against a support or resistance zone—if it aligns, it's a stronger setup.
- Improved Reward-to-Risk: All trades are anchored to key levels, making it easier to calculate and manage risk effectively.
- Stronger Confidence: With clear invalidation points beyond key levels, it's easier to trust the plan and stay disciplined—even in tough markets.
Whenever I share a signal, it’s because:
- A high‐probability key level has been identified on a higher timeframe.
- Lower‐timeframe momentum, market structure and volume suggest continuation or reversal is imminent.
- The reward‐to‐risk (based on that key level) meets my criteria for a disciplined entry.
***Please note that conducting a comprehensive analysis on a single timeframe chart can be quite challenging and sometimes confusing. I appreciate your understanding of the effort involved.
Important Note: The Role of Key Levels
- Holding a key level zone: If price respects the key level zone, momentum often carries the trend in the expected direction. That’s when we look to enter, with stop-loss placed just beyond the zone with some buffer.
- Breaking a key level zone: A definitive break signals a potential stop‐out for trend traders. For reversal traders, it’s a cue to consider switching direction—price often retests broken zones as new support or resistance.
My Trading Rules (Unchanged)
Risk Management
- Maximum risk per trade: 2.5%
- Leverage: 5x
Exit Strategy / Profit Taking
- Sell at least 70% on the 3rd wave up (LTF Wave 5).
- Typically sell 50% during a high‐volume spike.
- Move stop‐loss to breakeven once the trade achieves a 1.5:1 R:R.
- Exit at breakeven if momentum fades or divergence appears.
The market is highly dynamic and constantly changing. LMT signals and target profit (TP) levels are based on the current price and movement, but market conditions can shift instantly, so it is crucial to remain adaptable and follow the market's movement.
If you find this signal/analysis meaningful, kindly like and share it.
Thank you for your support~
Sharing this with love!
From HMT to LMT: A Brief Version History
HM Signal :
Date: 17/08/2023
- Early concept identifying high momentum pullbacks within strong uptrends
- Triggered after a prior wave up with rising volume and momentum
- Focused on healthy retracements into support for optimal reward-to-risk setups
HMT v1.0:
Date: 18/10/2024
- Initial release of the High Momentum Trading framework
- Combined multi-timeframe trend, volume, and momentum analysis.
- Focused on identifying strong trending moves high momentum
HMT v2.0:
Date: 17/12/2024
- Major update to the Momentum indicator
- Reduced false signals from inaccurate momentum detection
- New screener with improved accuracy and fewer signals
HMT v3.0:
Date: 23/12/2024
- Added liquidity factor to enhance trend continuation
- Improved potential for momentum-based plays
- Increased winning probability by reducing entries during peaks
HMT v3.1:
Date: 31/12/2024
- Enhanced entry confirmation for improved reward-to-risk ratios
HMT v4.0:
Date: 05/01/2025
- Incorporated buying and selling pressure in lower timeframes to enhance the probability of trending moves while optimizing entry timing and scaling
HMT v4.1:
Date: 06/01/2025
- Enhanced take-profit (TP) target by incorporating market structure analysis
HMT v5 :
Date: 23/01/2025
- Refined wave analysis for trending conditions
- Incorporated lower timeframe (LTF) momentum to strengthen trend reliability
- Re-aligned and re-balanced entry conditions for improved accuracy
HMT v6 :
Date : 15/02/2025
- Integrated strong accumulation activity into in-depth wave analysis
HMT v7 :
Date : 20/03/2025
- Refined wave analysis along with accumulation and market sentiment
HMT v8 :
Date : 16/04/2025
- Fully restructured strategy logic
HMT v8.1 :
Date : 18/04/2025
- Refined Take Profit (TP) logic to be more conservative for improved win consistency
LMT v1.0 :
Date : 06/06/2025
- Rebranded to emphasize key levels + momentum as the core framework

ETHFI last dip buyBINANCE:ETHFIUSDT remains one of the strongest ETH beta plays since the April bottom. After a clear impulse move and consolidation, price swept into a key 1D order block cluster, now acting as support.
Setup:
🟩 Key Support: $1.09–1.24 (1D OB cluster)
• Structure remains bullish above this zone
• Recent sweep confirmed as a last dip buy opportunity
• Higher lows and clean defense → continuation likely
📌 Wave Structure Suggests Ongoing Expansion
• Wave (4) completed on OB retest
• Next move (wave 5) targets new local highs if $1.24 holds
🎯 Targets:
• First resistance: $1.60
• Extension: $2.50–3.00+ (mid-range of former distribution zone)
Plan:
• Long bias above $1.09
• Accumulate dips on intraday structure above the OB
• Exit bias only on daily close below $1.09

ETHFIUSDT breakdown alertETHFIUSDT breakdown alert
ETHFIUSDT has broken down from a triangle pattern and appears to have completed a retest of the breakdown zone. If the price fails to reclaim this level and continues to reject it, we could see further downside pressure in the coming sessions.
Key levels to monitor:
– Breakdown zone now acting as resistance
– Immediate support below
– Volume confirmation to validate the move
Watch ETHFI closely — if the retest holds, it may lead to continued bearish momentum.

ethfi 4hIt has made a serious rise in recent days, but closing below 1.20 could bring levels to 1.034

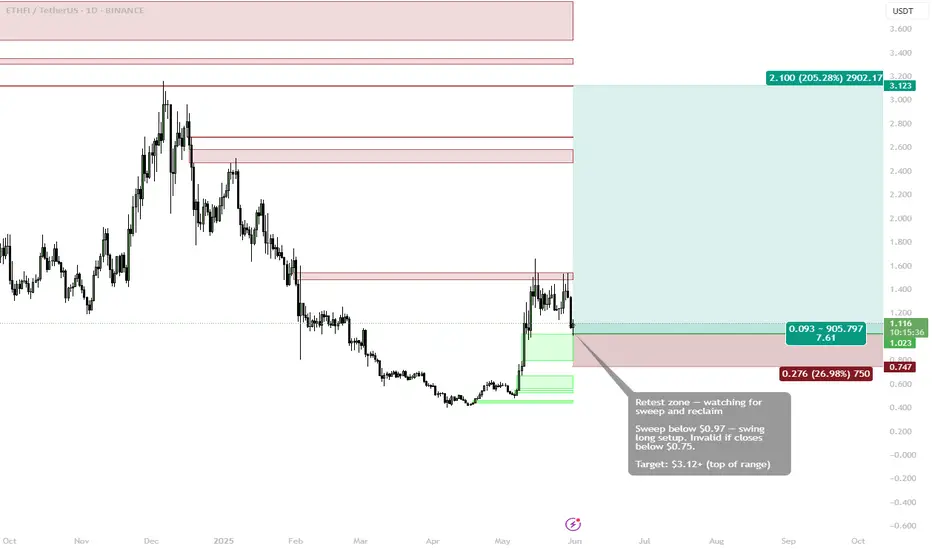
ETHFI (swing setup) — Retest in Progress Eyes on Sweep & ReclaimBINANCE:ETHFIUSDT is retesting a key breakout zone after a strong rally. Current structure suggests a possible swing long setup forming, contingent on a liquidity sweep below $0.97 and a clean reclaim.
Entry Criteria:
🟩 Retest Zone: $0.97–1.02
Looking for a sweep below $0.97 followed by a reclaim and bullish confirmation for entry.
❗ Invalidation: Close below $0.75 cancels the setup — indicates structural breakdown.
🎯 Target: $3.12+
Aiming for the top of the previous range — a 200%+ move if the reclaim holds.
📌 Big moves come from big levels — timing the reclaim is key.
ETHFI ROADMAPTo me the view is pretty clear.
* The purpose of my graphic drawings is purely educational.
* What i write here is not an investment advice. Please do your own research before investing in any asset.
* Never take my personal opinions as investment advice, you may lose your money.

ETHFIUSDT 2D AnalysisETHFI ~ 2D Analysis
#ETHFI Buy after successfully breaking this resistance line with a short term target of at least 15%+ and a long term target of $8.7

Symmetrical Triangle Breaks – $ETHFI Targets $2+CRYPTOCAP:ETHFI just broke out of a strong symmetrical triangle on the 2H chart finally escaping a long consolidation phase.
Price surged above resistance and reclaimed key EMAs, showing clear bullish momentum. If this breakout sustains, the next leg could take us toward $2.00+
Risk is tight below $1.27 the breakout zone and previous resistance-turned-support.
This move could be the start of something big.
Watch closely!

ETHFIIt has good momentum
But we need to see what it does with the range it is set at
If we see demand on the higher timeframe, I think it is worth the risk.
ETHFIUSDTETHFI has recently shown a strong recovery from its macro lows, now trading at $1.29. The price is currently reacting to the first weekly bearish order block zone around $1.20–$1.35, which historically served as a key support-turned-resistance area.
🔹 Key Observations:
Price Reaction Zone:
Price is consolidating inside the first weekly order block, indicating potential for rejection or absorption before a larger move.
Upside Potential:
If bulls break above and hold this zone, the next key weekly order blocks lie at:
$2.30–$2.70
$4.80–$5.40
Bullish Structure:
The strong impulsive move from sub-$0.50 to above $1.20 hints at aggressive accumulation. Continuation depends on reclaiming and holding above this current order block.
🧠 Summary:
ETHFI is at a critical inflection point, testing a major weekly supply/order block. A clean breakout could open room to higher order blocks, while rejection may lead to a retest of lower demand areas. Monitor for confirmation (e.g., daily candle close above $1.35 or strong rejection wicks) before positioning.

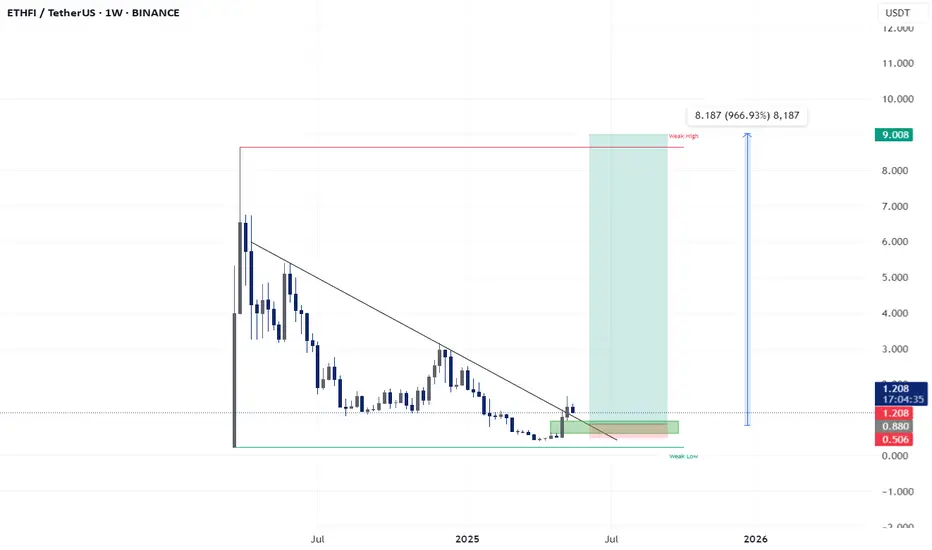
"ETHFI/USDT Long Set-UpETHFI/USDT Weekly Analysis – Trend Reversal in Play
The weekly chart of ETHFI/USDT shows a clear breakout above a long-term descending trendline, indicating a potential shift in market structure. Price has reclaimed the key resistance-turned-support zone (highlighted in green), suggesting bullish momentum may be building. With a well-defined invalidation level below the weak low and a high reward-to-risk setup targeting the $9.00 region, this breakout could mark the beginning of a significant trend reversal BINANCE:ETHFIUSDT
ETHFIUSDT | Bearish Bias Below the Red BoxETHFIUSDT isn’t showing strength here. Price is stuck below a clear red box resistance, and as long as that holds, my bias stays short.
There’s no sign of buyer aggression. CDV remains flat, and any volume upticks have been absorbed. Unless that red box is broken and retested, I see no reason to flip bullish.
Short ideas stay valid until proven otherwise.
Let the market earn your trust — not the other way around.
📌I keep my charts clean and simple because I believe clarity leads to better decisions.
📌My approach is built on years of experience and a solid track record. I don’t claim to know it all but I’m confident in my ability to spot high-probability setups.
📌If you would like to learn how to use the heatmap, cumulative volume delta and volume footprint techniques that I use below to determine very accurate demand regions, you can send me a private message. I help anyone who wants it completely free of charge.
🔑I have a long list of my proven technique below:
🎯 ZENUSDT.P: Patience & Profitability | %230 Reaction from the Sniper Entry
🐶 DOGEUSDT.P: Next Move
🎨 RENDERUSDT.P: Opportunity of the Month
💎 ETHUSDT.P: Where to Retrace
🟢 BNBUSDT.P: Potential Surge
📊 BTC Dominance: Reaction Zone
🌊 WAVESUSDT.P: Demand Zone Potential
🟣 UNIUSDT.P: Long-Term Trade
🔵 XRPUSDT.P: Entry Zones
🔗 LINKUSDT.P: Follow The River
📈 BTCUSDT.P: Two Key Demand Zones
🟩 POLUSDT: Bullish Momentum
🌟 PENDLEUSDT.P: Where Opportunity Meets Precision
🔥 BTCUSDT.P: Liquidation of Highly Leveraged Longs
🌊 SOLUSDT.P: SOL's Dip - Your Opportunity
🐸 1000PEPEUSDT.P: Prime Bounce Zone Unlocked
🚀 ETHUSDT.P: Set to Explode - Don't Miss This Game Changer
🤖 IQUSDT: Smart Plan
⚡️ PONDUSDT: A Trade Not Taken Is Better Than a Losing One
💼 STMXUSDT: 2 Buying Areas
🐢 TURBOUSDT: Buy Zones and Buyer Presence
🌍 ICPUSDT.P: Massive Upside Potential | Check the Trade Update For Seeing Results
🟠 IDEXUSDT: Spot Buy Area | %26 Profit if You Trade with MSB
📌 USUALUSDT: Buyers Are Active + %70 Profit in Total
🌟 FORTHUSDT: Sniper Entry +%26 Reaction
🐳 QKCUSDT: Sniper Entry +%57 Reaction
📊 BTC.D: Retest of Key Area Highly Likely
📊 XNOUSDT %80 Reaction with a Simple Blue Box!
📊 BELUSDT Amazing %120 Reaction!
📊 Simple Red Box, Extraordinary Results
I stopped adding to the list because it's kinda tiring to add 5-10 charts in every move but you can check my profile and see that it goes on..

EtherFi Governance Token & The 2025 Bull Market (PP: 1,111%)EtherFi is hot right now just as Ethereum is very hot. The project looks really good with great offerings, great products... Let's consider the chart. If you have a good product with a great chart, that's a combination for a massive 2025 bull market. You are bound to get numbers beyond this chart.
The long-term support and accumulation zone was lost in late February/early March. It was recovered again in May. The bottom was only available for two months. You are one of the lucky few if you decided to buy at bottom prices. Prices that will never become available again.
ETHFI is back above its August 2024 low, thus bullish; now trading with a bullish bias within its long-term accumulation zone. A price zone where we can buy, big, focusing on the long-term. A great chart, huge potential for growth, can't say it often enough.
There is really high volume here, the highest since launch date.
This high volume indicates and confirms that the bottom is in. If prices were to move back lower, trading volume the past two weeks would be much lower. Since prices are set to grow, volume is really high, the whales are loading up.
Not all is lost. It is still early because the last drop was a stop-loss hunt event. Notice the blue space on the chart, this is the standard buy zone. Here, in this range, ETHFIUSDT traded for more than 3 months in 2024.
A bull market can be expected now, a bullish trend.
Nice and easy, buy and hold; the market will take care of the rest.
This post is meant to alert you of a great entry timing and prices.
This is for spot traders. An easy buy. —Focused on the long-term.
Thank you for reading.
Namaste.

ETHFI PERPETUAL TRADE ,Sold From $1.63ETHFI PERPETUAL TRADE
ETHFI SELL SETUP
Currently $1.63
Sold From $1.63
(Trading plan If ETHFI go up to $1.75
will add more shorts)
Expecting target $1.53 OR DOWN
Incase of early exist will update this anaylsis
Its not a Financial advice

ETHFI Will Outperform Ethereum In This CycleHello, Skyrexians!
Yesterday we pointed out the great potential performance of Ethereum, but we have assets which depends on it but can perform much much better because of small cap. I personally have already bough BINANCE:ETHFIUSDT in February and March with average price $0.7, so now I have 2x, but this growth is not finished.
After listing pump this crypto retraced that much in the global wave 2 ABC shaped. Bullish/Bearish Reversal Bar Indicator has printed the first green dot only on the very bottom, as a result asset entered into bull market. The next target is 1.61 Fibonacci at $14. This is going to be wave 3 and that's all!
Best regards,
Ivan Skyrexio
___________________________________________________________
Please, boost this article and subscribe our page if you like analysis!

ETHFI/USDTKey Level Zone: 1.2400 - 1.2800
HMT v8.1 detected. The setup looks promising, supported by a previous upward/downward trend with increasing volume and momentum, presenting an excellent reward-to-risk opportunity.
HMT (High Momentum Trending):
HMT is based on trend, momentum, volume, and market structure across multiple timeframes. It highlights setups with strong potential for upward movement and higher rewards.
Whenever I spot a signal for my own trading, I’ll share it. Please note that conducting a comprehensive analysis on a single timeframe chart can be quite challenging and sometimes confusing. I appreciate your understanding of the effort involved.
Important Note :
Role of Key Levels:
- These zones are critical for analyzing price trends. If the key level zone holds, the price may continue trending in the expected direction. However, momentum may increase or decrease based on subsequent patterns.
- Breakouts: If the key level zone breaks, it signals a stop-out. For reversal traders, this presents an opportunity to consider switching direction, as the price often retests these zones, which may act as strong support-turned-resistance (or vice versa).
My Trading Rules
Risk Management
- Maximum risk per trade: 2.5%.
- Leverage: 5x.
Exit Strategy
Profit-Taking:
- Sell at least 70% on the 3rd wave up (LTF Wave 5).
- Typically, sell 50% during a high-volume spike.
- Adjust stop-loss to breakeven once the trade achieves a 1.5:1 reward-to-risk ratio.
- If the market shows signs of losing momentum or divergence, ill will exit at breakeven.
The market is highly dynamic and constantly changing. HMT signals and target profit (TP) levels are based on the current price and movement, but market conditions can shift instantly, so it is crucial to remain adaptable and follow the market's movement.
If you find this signal/analysis meaningful, kindly like and share it.
Thank you for your support~
Sharing this with love!
HMT v2.0:
- Major update to the Momentum indicator
- Reduced false signals from inaccurate momentum detection
- New screener with improved accuracy and fewer signals
HMT v3.0:
- Added liquidity factor to enhance trend continuation
- Improved potential for momentum-based plays
- Increased winning probability by reducing entries during peaks
HMT v3.1:
- Enhanced entry confirmation for improved reward-to-risk ratios
HMT v4.0:
- Incorporated buying and selling pressure in lower timeframes to enhance the probability of trending moves while optimizing entry timing and scaling
HMT v4.1:
- Enhanced take-profit (TP) target by incorporating market structure analysis
HMT v5 :
Date: 23/01/2025
- Refined wave analysis for trending conditions
- Incorporated lower timeframe (LTF) momentum to strengthen trend reliability
- Re-aligned and re-balanced entry conditions for improved accuracy
HMT v6 :
Date : 15/02/2025
- Integrated strong accumulation activity into in-depth wave analysis
HMT v7 :
Date : 20/03/2025
- Refined wave analysis along with accumulation and market sentiment
HMT v8 :
Date : 16/04/2025
- Fully restructured strategy logic
HMT v8.1 :
Date : 18/04/2025
- Refined Take Profit (TP) logic to be more conservative for improved win consistency
