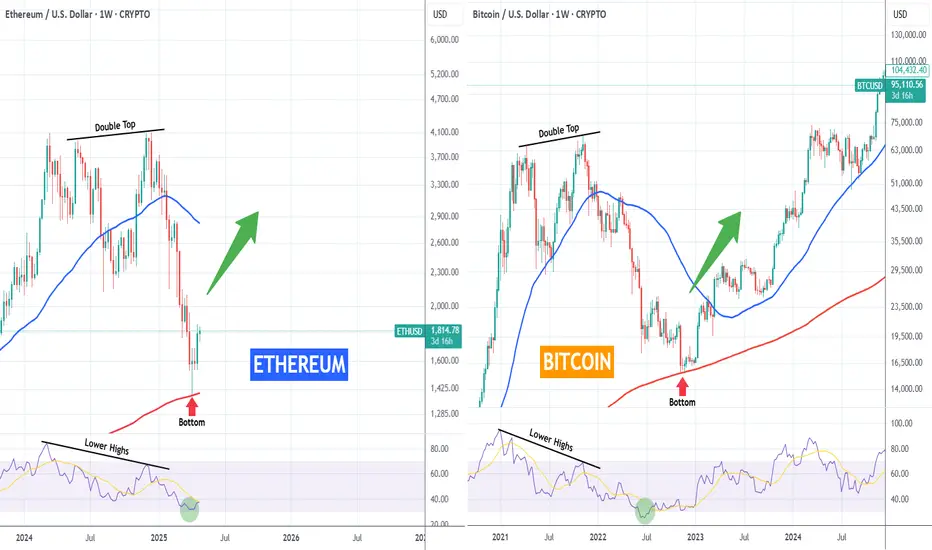
ETHEREUM vs BITCOIN fractals you'd never thought to look at!Odd comparison but you'd be lying if you say those fractals between Ethereum (ETHUSD) 2024 - 2025 and Bitcoin (BTCUSD) 2021 - 2022 don't look similar. But if you do believe it, can this mean ETH is about to see a rally to a new All Time High?
Anyway as the title says, this is fun fractal for comparison purposes only. The conclusion is yours!
-------------------------------------------------------------------------------
** Please LIKE 👍, FOLLOW ✅, SHARE 🙌 and COMMENT ✍ if you enjoy this idea! Also share your ideas and charts in the comments section below! This is best way to keep it relevant, support us, keep the content here free and allow the idea to reach as many people as possible. **
-------------------------------------------------------------------------------
💸💸💸💸💸💸
👇 👇 👇 👇 👇 👇
ETHHEDGEUSD trade ideas
Nobody appreciate it !!!Currently, ETH is forming an ascending triangle, indicating a potential price increase. It is anticipated that the price could rise, aligning with the projected price movement (AB=CD).
However, it is crucial to wait for the triangle to break before taking any action.
Give me some energy !!
✨We spend hours finding potential opportunities and writing useful ideas, we would be happy if you support us.
Best regards CobraVanguard.💚
_ _ _ _ __ _ _ _ _ _ _ _ _ _ _ _ _ _ _ _ _ _ _ _ _ _ _ _ _ _ _ _
✅Thank you, and for more ideas, hit ❤️Like❤️ and 🌟Follow🌟!
⚠️Things can change...
The markets are always changing and even with all these signals, the market changes tend to be strong and fast!!

Bullish on ETHAlso quick #ETH analysis for you boyz.
Price did manage to cross this red trendline which was holding the price down and Its showing signs of forming a Higher Lows. Those two are early indicators of trend reversal.
Lets Keep an eye on 200 EMA

This is just to show off my trendline skills, nothing more Hmmm. This is ethereum obviously. I don’t know much about TA but I think the little I learned put me a step ahead and I’m thankful for OpenAI. I get to work with a personal trainer or every information and logic I need.. just a chat away. It’s incredible.
So I think Eth is consolidating, just learnt that word. And it’s getting ready to do something. The logic is to just ride the wave of the market.. it’s almost impossible if you don’t know the trajectory of the market. But if you do then you one step safer…. Trendline helps with that

[LONG] ETHUSDT - Binance | Going Now?Welcome,
- Status: 📈 Long
- ETH good
- TP: I have 5 TP, the last 20% depend on you
- SL: When TP 1 is met, move SL to the entry position for FREE RISK. After the next TP is met, use Trailing Stop.
Keep wait..
Lets see..

ETHThe chart looks like Bitcoin’s movement in 2020. I think it will rise to $4,000 by autumn. If it breaks that level, we could see $8,000–$10,000 by 2026, and and possibly even reach $14,000.
At the moment, it’s hard to believe this forecast, but the market can move any way, and there’s always a chance this scenario could happen.

ETH/USD Breakout Trading Setup – Long Entry with 16% Target PoteEntry Point: $1,593.08
Target Point: $1,807.83
Stop Loss: $1,472.68
Risk/Reward Ratio: Roughly 2.1:1
Indicators Used:
EMA 30 (Red Line) at $1,593.08 (near entry point)
EMA 200 (Blue Line) at $1,605.09
Analysis:
1. Consolidation Phase:
ETH is in a sideways range after a prior downtrend, consolidating within the purple support zone.
This zone (~$1,555 to ~$1,593) has been tested multiple times, suggesting a strong base.
2. Bullish Breakout Anticipation:
The setup expects a breakout above consolidation, targeting a 16.11% move to $1,807.83.
A breakout strategy is being applied, assuming ETH will reverse from this consolidation area a

ETH bullish Super bullish as BTC leads as market indicator. A great place to take a risk after recovering 10% from lows.
Entry to TP1 is looking good.

ETHUSD is forming a H&S pattern on the H1ETHUSD is forming a H&S pattern on the H1 chart. The right shoulder has yet to finish forming so our TP1 will be on the neckline. TP2 will be if it breaks out from the trendline and TP3 will be the completion of the H&S pattern. Pattern will be invalidated if it breaks past the shoulder line.
Please do not risk more than 1% per trade。
If you like the idea, please help like the post and comment down your thoughts below! I would love to hear your thoughts!

[WAITING] ETHUSDT - Binance | What now?Welcome,
- Status: Neutral
- ETH Stil Consolidation, waiting signal for validation entry
Keep wait..
Lets see..

ETHUSD Stuck Below 1,830 – Bulls Losing Steam or Gearing Up?Ethereum remains range-bound below the 1,830 🔼 resistance after a failed bullish breakout attempt. Price has been consolidating between the 1,500 🔽 support and the 1,830 🔼 resistance for weeks. A breakout from either level will determine the next directional move.
Support at: 1,500 🔽
Resistance at: 1,830 🔼, 2,100 🔼, 2,530 🔼, 3,040 🔼, 4,036 🔼
Bias:
🔼 Bullish: Break and close above 1,830 could open room toward 2,100 and 2,530.
🔽 Bearish: Rejection at 1,830 or drop below 1,700 could push price back toward 1,500.
📛 Disclaimer: This is not financial advice. Trade at your own risk.

The end of seasonal growth, reducing work positionsThe seasonal growth cycle is ending this week. For most of the market, the sales cycle begins on Sunday. In the new week, we can still expect pumps for the turn of the month for individual coins. From Sunday to Tuesday, the probability of a market drawdown prevails as part of a pullback on the current weekly candle and shadow rendering for the new week. For coins that have already attempted to turn the month around, the probability of stable sales until the end of May already prevails from this week. From Tuesday to May 7-9 or 11-12, there will still be a flat period, when, with a general market pullback, individual coins may show growth, then the probability of a return of ether to 1500-1600 prevails, with a possible reversal and drawdown of the altcoin market. Today and tomorrow, I recommend reducing positions on coins, especially those that have shown good growth, in order to avoid drawdowns in the new month.
In the first half of the new week, growth impulses for coins that have not yet attempted to turn the current monthly candle into a bullish one are more likely. In particular, pumping is possible using vib wing and pda, which are awaiting delisting. For coins without the monitoring tag, it is better to make further purchases after the announcement of the tag assignment in the new week, because after the rollback from Sunday to Tuesday, coins can lose up to 50% additionally in the second half of the week if the tag is assigned. I will collect the list of coins for work in May after the announcement of the tag assignment.

BUY ETHUSDETHUSD technical analysis is aligning with fundamentals. We have seen a breakout from the channel, I am expecting price to pump up into 2080 before Monday. Huge entities like Black Rock are purchasing huge amounts of ETH, let us follow my fellow retailers

ETHUSD: 4H Golden Cross giving the strongest buy signal of 2025.Ethereum is about to turn bullish again on its 1D technical outlook (RSI = 54.924, MACD = 0.460, ADX = 35.736) as it completed a Golden Cross on 4H. This was the first 4H Golden Cross since October 17th 2024 and took place at the top of the 4 month Channel Down. We expect a bullish breakout next, aiming at the 0.786 Fibonacci retracement level (TP = 3,250).
## If you like our free content follow our profile to get more daily ideas. ##
## Comments and likes are greatly appreciated. ##

Ethereum´s local and possibly even macro bottom is in!- first ever White Stripe present on the 3W which is a very high time-frame
- Eth has experienced a more than 60% drop ever since the highs with no real relief inbetween
- at the very least, a strong bounce to 2400, 2500 is expected
- there is also the possibility that this is THE bottom before eventually Eth makes new ATHs, possibly this but probably next year

ETH turned bullish on the daily chart, great R:R hereTargeting mid to upper 3000s in the mid-term (2-3 months) and expecting 5k plus by year end. ETH will get it's turn, don't worry

ETH Bulls Might Have a Shot – Tight Range Before the Breakout📅 What just happened on ETH?
Ethereum recently printed a local bottom just below 1400 – a level that felt unthinkable just a few months ago. But as it often happens in crypto, the unexpected became reality.
💡 What came next?
From that low, ETH bounced strongly, signaling the start of a natural correction. While I personally don’t believe this is the final bottom, I do see opportunity on the upside.
🧐 What the chart tells us:
Sharp reversal from under 1400
Quick drop but failed continuation lower
Current tight consolidation, which often leads to breakout setups
🧠 My view:
Right now, this looks like a temporary bottom, and until proven otherwise, I’m interested in buying the dip. As long as the structure holds, bulls might have the upper hand short-term.
🎯 My Trading Plan:
Looking to go long, with 1800 as my target.
Risk-Reward? I’m aiming for at least 1:2, so I’ll be waiting for the right entry signal before jumping in.

Update: Enter The Heavens (ETH)Keeping it simple is often the way to go. I believe the image is self explanatory.

$ETH It's never to late to get on EMA 50 hitETH is on a climb, its still 50% cheaper than beginning of year.

Will ETH do it again?Looks like we are in a decent spot to scale in for the next mark-up phase.
ETH has retraced a bit further/deeper than originally anticipated, however that just makes the entry all the better.

ETHUSD Will Go Up! Long!
Here is our detailed technical review for ETHUSD.
Time Frame: 12h
Current Trend: Bullish
Sentiment: Oversold (based on 7-period RSI)
Forecast: Bullish
The market is trading around a solid horizontal structure 1,848.90.
The above observations make me that the market will inevitably achieve 2,055.37 level.
P.S
We determine oversold/overbought condition with RSI indicator.
When it drops below 30 - the market is considered to be oversold.
When it bounces above 70 - the market is considered to be overbought.
Disclosure: I am part of Trade Nation's Influencer program and receive a monthly fee for using their TradingView charts in my analysis.
Like and subscribe and comment my ideas if you enjoy them!

ETH is moving within the 1,550.00 - 1,830.00 range👉🏼 Possible scenario:
Ethereum dropped 3.3% to $1,754, echoing a broader 3.6% market correction. But under the surface, long-term holders are accumulating, with over 640,000 ETH flowing into wallets that haven’t sold since 2018—a multi-year high.
On-chain metrics show growing conviction: active addresses surged 10% in just two days, signaling rising network engagement. Despite short-term volatility, investor positioning suggests quiet confidence in Ethereum’s long-term fundamentals.
✅Support and Resistance Levels
Support level is now located at 1,550.00.
Now, the resistance level is located at 1,830.00.
