ETHEREUM SHORT TO $786! (UPDATE)ETH keeps on dumping😉
That's the power of Elliott Wave. We can see from our analysis that ETH remains within a 3 Sub-Wave (A,B,C) corrective channel. From naked price action we can still see that price remains bearish. Wave C target still remains around $786🩸
ETHHEDGEUSD trade ideas

ETHEREUM Huge bullish divergence targets $4000Ethereum / ETHUSD formed a Double Bottom while the 1day RSI was on a Rising Support.
This is a similar bottom formation like the September 6th 2024 Double Bottom.
Technically once the Falling Resistance breaks, the new bullish wave begins.
Target the bottom of the Resistance Zone at $4000.
Follow us, like the idea and leave a comment below!!

Bullish Divergence on the dailyI would also say that there is a bullish divergence happening on the daily, which further indicates likelihood of upward momentum.

ETHUSD – Double Bottom Formation & Falling Wedge Breakout | 4H AEthereum (ETH) has completed a Falling Wedge breakout followed by the formation of a potential Double Bottom pattern on the 4H timeframe, signaling a bullish reversal setup.
Technical Analysis:
Falling Wedge Breakout indicates trend reversal potential.
Double Bottom structure formed around $1,700 – $1,750 support zone.
Key Resistance Levels: $2,005 and $2,500 (pattern targets).
Fundamental Outlook:
Growing Ethereum network activity and ETF speculations supporting bullish sentiment.
Market participants eyeing Ethereum’s role in broader crypto adoption & DeFi space.
Broader crypto market recovery adding positive momentum.
If price sustains above $1,880, further upside towards $2,005 and possibly $2,500 can be expected. Break below recent bottom may invalidate this setup.
Watch for volume confirmation and market sentiment drivers!
Must Support Me Share My Idea With Your Firends Mention Your Feed back Comment Section

ETHUSD is offering you an opportunity to buy it cheap!!Seriously guys, what are you waiting for. DCA the move, open a futures trade. Using x50, risk $50 and you will be glad you did.
Let me post so you see this trade on time and enter on time
Follow me as my trades are mostly market orders

ETH might be about to melt facesSentiment as negative as it could be, no real inflows for weeks - bottom sentiment? Check.
Sudden massive inflows? Check!
This is not a trade idea. If you trade this, be careful - who knows right now.

ETH CHART: I FOUND THE BOTTOM!HERE IS MY FUNDA REASON OR NEWS WHY I THINK THIS IS THE LAST DROP~! BEFORE WE RECOVER AND START THE BUILDING OF CRYPTO!
Price Decline and Market Sentiment: Ethereum's price has dropped below $1,800, marking a significant decline of over 45% since the start of the year. This has raised concerns about its market stability, with some analysts predicting further drops to $1,550 if key resistance levels aren't reclaimed.
Investor Sentiment and FUD: Fear, uncertainty, and doubt (FUD) have led to increased selling pressure. Retail traders have been offloading ETH holdings, resulting in reduced trading volumes and network activity. Active addresses and transaction volumes have also declined, signaling lower demand!
Technical Challenges and Resistance Levels: Ethereum has struggled to break past critical resistance levels, such as $1,900. Its failure to reclaim these levels has validated bearish patterns, with some analysts warning of a potential drop to 17-month lows!
Macroeconomic Factors: Broader economic uncertainties, including geopolitical events like tariffs, have contributed to Ethereum's struggles. These factors have added to the negative sentiment in both the financial and crypto markets.
Network Activity and Whale Behavior: While some large investors (whales) are accumulating ETH, the overall network activity has seen a decline. This mixed behavior has created uncertainty about the asset's short-term trajectory

KEEP TRADING SIMPLE - ETH Good Afternoon,
Hope all is well. We are trading in a downtrend so please be careful, these need to be quick and calculated moves before determining if there is a reversal.
Volume is building, so is the support, this is a good spot to focus on a short term trade.
I have bought at this support level which is forming and will exit at resistance unless I see the trend hold and continue.
Have a great night.
ETH

ETH bullish RSI divergenceA bullish RSI divergence has formed on the daily timeframe, supporting the weekly trendline.
Are we going up from here ?

$ETHUSDWell this should help with getting Stock prices down to cheaper prices.
Lets see how this plays out.
Will be fun.

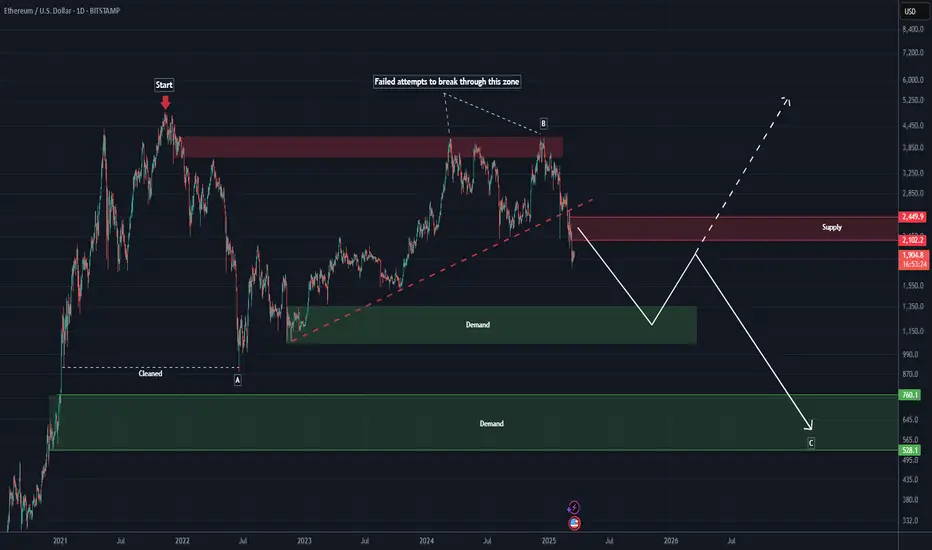
Ethereum will be in the bears' control in the mid-term (1D)Based on the recent pivot formations, momentum, and wave degrees, we are observing signs of a deeper correction on the Ethereum chart, which we find necessary to warn about.
As you know, we follow technical evidence and signals to provide analysis—we do not predict the market but rather analyze it step by step.
From the point where we placed the red arrow on the chart, Ethereum's price-time correction has begun.
It appears that an ABC pattern is forming, with wave B now completed or nearing completion after losing the trendline (red dashed line).
Wave C should align with the previous waves in degree and have a longer duration than wave A.
Since wave B retraced close to the top of wave A, wave C’s price correction may not fall too far below the low of wave A.
We have two possible scenarios: either Demand 1 will be the market bottom, or Demand 2.
A daily candle closing above the invalidation level would invalidate this analysis. Let's see how it plays out.
invalidation level : 2941$
For risk management, please don't forget stop loss and capital management
When we reach the first target, save some profit and then change the stop to entry
Comment if you have any questions
Thank You
ETH/USD SELLETH/USD trade in progress
Position opened on ETH/USD with good risk management and an optimal risk/reward ratio. Targeting a potential breakout, but with a tight stop loss to limit losses.
⚠️ Disclaimer: This is not financial advice, every trade carries risks.

ETH MOMENTUM RANGE DCA BUY DIP 1350 - 1150ETH MOMENTUM RANGE DCA BUY DIP 1350 - 1150
📊 ETH MOMENTUM RANGE – DCA BUY THE DIP STRATEGY
This strategy applies a mid-term momentum approach with DCA (Dollar Cost Averaging) entries as ETH pulls back into a key support range.
🔹 Momentum Bias: Mid-term bullish as long as ETH holds above the 1350 level. Corrections within structure are considered healthy.
🔹 DCA Buy Range:
Buy Level #1: 1350 USDT
Buy Level #2: 1250 USDT
Buy Level #3: 1150 USDT
(Scaling into positions gradually as ETH dips into support zones)
🔹 Additional Confirmation Tools:
RSI oversold on H4 or Daily
Bullish divergence signals
Reversal volume spikes
🎯 Mid-Term Targets:
TP1: 1600
TP2: 1750
TP3 (Extension): 2000+ (if momentum continues with BTC support)
🛡️ Risk Management:
Flexible stop-loss below 1100 (cut if bullish structure is invalidated)
DCA capital allocation: evenly split or 40%-30%-30% per level

ETH BUY?RSI on daily time frame is showing oversold which could be a sign of exhaustion.
Based on Daily & 4HR TF, the market seems to be forming a possible reversal pattern which could lead to a possible reversal.
We could see BUYERS coming in strong should the current level hold.
Disclaimer:
Please be advised that the information presented on TradingView is solely intended for educational and informational purposes only.The analysis provided is based on my own view of the market. Please be reminded that you are solely responsible for the trading decisions on your account.
High-Risk Warning
Trading in foreign exchange on margin entails high risk and is not suitable for all investors. Past performance does not guarantee future results. In this case, the high degree of leverage can act both against you and in your favor

Heading into 50% Fibonacci resistance?Ethereum (ETH/USD) is rising towards the pivot which has been identified as a pullback resistance and could reverse to the 1st support.
Pivot: 1,945.48
1st Support: 1,751.48
1st Resistance: 2,038.68
Risk Warning:
Trading Forex and CFDs carries a high level of risk to your capital and you should only trade with money you can afford to lose. Trading Forex and CFDs may not be suitable for all investors, so please ensure that you fully understand the risks involved and seek independent advice if necessary.
Disclaimer:
The above opinions given constitute general market commentary, and do not constitute the opinion or advice of IC Markets or any form of personal or investment advice.
Any opinions, news, research, analyses, prices, other information, or links to third-party sites contained on this website are provided on an "as-is" basis, are intended only to be informative, is not an advice nor a recommendation, nor research, or a record of our trading prices, or an offer of, or solicitation for a transaction in any financial instrument and thus should not be treated as such. The information provided does not involve any specific investment objectives, financial situation and needs of any specific person who may receive it. Please be aware, that past performance is not a reliable indicator of future performance and/or results. Past Performance or Forward-looking scenarios based upon the reasonable beliefs of the third-party provider are not a guarantee of future performance. Actual results may differ materially from those anticipated in forward-looking or past performance statements. IC Markets makes no representation or warranty and assumes no liability as to the accuracy or completeness of the information provided, nor any loss arising from any investment based on a recommendation, forecast or any information supplied by any third-party.

ETHEREUM Targeting 4500-4700Ethereum (ETHUSD) hit 2 weeks ago the bottom (Higher Lows Zone) of its 4-year Ascending Triangle pattern, following the recent 3-month correction.

ETH Ready for PUMP or what ?Currently, ETH is forming an ascending triangle, indicating a potential price increase. It is anticipated that the price could rise, aligning with the projected price movement (AB=CD).
However, it is crucial to wait for the triangle to break before taking any action.
Give me some energy !!
✨We spend hours finding potential opportunities and writing useful ideas, we would be happy if you support us.
Best regards CobraVanguard.💚
_ _ _ _ __ _ _ _ _ _ _ _ _ _ _ _ _ _ _ _ _ _ _ _ _ _ _ _ _ _ _ _
✅Thank you, and for more ideas, hit ❤️Like❤️ and 🌟Follow🌟!
⚠️Things can change...
The markets are always changing and even with all these signals, the market changes tend to be strong and fast!!

ETHUSD Ethereum update 28.03.2025We have reached several Internal liquidity
from this zone, waiting for an upward reaction within 2-4 days.
Best regards EXCAVO

ETH/USD "Ethereum vs U.S.Dollar" Crypto Heist Plan(Swing/Day)🌟Hi! Hola! Ola! Bonjour! Hallo! Marhaba!🌟
Dear Money Makers & Thieves, 🤑 💰🐱👤✈️
Based on 🔥Thief Trading style technical and fundamental analysis🔥, here is our master plan to heist the ETH/USD "Ethereum vs U.S.Dollar" Crypto market. Please adhere to the strategy I've outlined in the chart, which emphasizes long entry. Our aim is the high-risk Red MA Level. Risky level, overbought market, consolidation, trend reversal, trap at the level where traders and bearish robbers are stronger. 🏆💸"Take profit and treat yourself, traders. You deserve it!💪🏆🎉
Entry 📈 : "The vault is wide open! Swipe the Bullish loot at any price - the heist is on!
however I advise to Place buy limit orders within a 15 or 30 minute timeframe most recent or swing, low or high level.
Stop Loss 🛑:
📌Thief SL placed at the nearest/swing low or high level Using the 1H timeframe (1800) Day/swing trade basis.
📌SL is based on your risk of the trade, lot size and how many multiple orders you have to take.
🏴☠️Target 🎯: 2200 (or) Escape Before the Target
🧲Scalpers, take note 👀 : only scalp on the Long side. If you have a lot of money, you can go straight away; if not, you can join swing traders and carry out the robbery plan. Use trailing SL to safeguard your money 💰.
ETH/USD "Ethereum vs U.S.Dollar" Crypto Market Heist Plan (Day / Swing Trade) is currently experiencing a bullishness,., driven by several key factors.👇
📰🗞️Get & Read the Fundamental, Macro, COT Report, On Chain Analysis, Sentimental Outlook, Intermarket Analysis, Future trend targets.. go ahead to check 👉👉👉🔗
⚠️Trading Alert : News Releases and Position Management 📰 🗞️ 🚫🚏
As a reminder, news releases can have a significant impact on market prices and volatility. To minimize potential losses and protect your running positions,
we recommend the following:
Avoid taking new trades during news releases
Use trailing stop-loss orders to protect your running positions and lock in profits
💖Supporting our robbery plan 💥Hit the Boost Button💥 will enable us to effortlessly make and steal money 💰💵. Boost the strength of our robbery team. Every day in this market make money with ease by using the Thief Trading Style.🏆💪🤝❤️🎉🚀
I'll see you soon with another heist plan, so stay tuned 🤑🐱👤🤗🤩

ETHUSDSaturday we broke out of H4 support, retested and price gave us a very short move before reversing back up giving us what looked like a fakeout to the upside and now we are back below the H4 support zone with current H4 candle looking to close as a bearish engulfing. Target is still the weekly support around 1,555

Will ETH finally change direction?ETH is approaching support at $1,559, but here you can see how the price has fallen below the upward trend line, which could have resulted in a stronger rebound. When support is broken, you can still see a strong support level at $997, to which we can see a decline.
Only when the trend changes direction will ETH have to face resistance levels at $1,889, then $2,151, and then $2,560 before we see any major upward movements.
The Stoch RSI indicator shows us moving along a line where we could previously observe strong price rebounds, while the RSI indicator itself, taking into account the interval of one weekend, shows us approaching the level we last touched during the bear market bottom.

Buy signalRsi over sold ,so buy in part like 30 % if it dump a bit you can add to your buy 20 percent

