ETH Breaks Out of Falling Wedge, Eyes $2800 TargetEthereum (ETH) has broken out of a falling wedge pattern, signaling a potential bullish move. If the breakout sustains, the price could rally towards the projected target in the $2800 region, based on the wedge’s height.
ETHHEDGEUSD trade ideas

ETHUSD: Strong Growth Ahead! Long!
My dear friends,
Today we will analyse ETHUSD together☺️
The market is at an inflection zone and price has now reached an area around 1.800.9 where previous reversals or breakouts have occurred.And a price reaction that we are seeing on multiple timeframes here could signal the next move up so we can enter on confirmation, and target the next key level of 1.828.4.Stop-loss is recommended beyond the inflection zone.
❤️Sending you lots of Love and Hugs❤️

EthereumETHUSD
- Bearish Channel as an corrective pattern in Short Time Frame
- Break of Structure
- RSI - Divergence
- Completed " 1234 " Impulsive Waves
- Change of Characteristics

ETH/USD bearish trend(A Corrective Pullback)The sharp drop from 1,803 created an FVG around 1795–1800, which price is currently filling. A rejection at the bearish order block (1800–1803) could lead to a bearish continuation toward 1790 or lower then expect a bullish reversal targeting 1810–1815. then 1850. & then 1963 & so forth & so on. Watch for confirmation during the London or New York kill zones.

ETH big ass bull penantLFG
Few clean patterns
Angled cup and handle
Penant on last leg
Not financial advice

Ethereum sell analysis/idea based on Supply & DemandBased on Supply & Demand trading, we have a Drop-Base-Drop in our downtrend move in the weekly timeframe, so I will start selling once the price reaches the supply base.

Ethereum signal Ethereum sell......
Entry .....1814.6
Target..............1800
SL.............1827.7

ETH SUNDAY SHORTshort from test after UTAD in distribution/ re-acummulation pattern, looking to reach the low of the range before reversing up again.


ETH Trend Shift Loading? Enhanced Trend Indicator Spots Early !!Ethereum just triggered a volume-backed reversal signal on the 4H chart — and it might be the first real sign of life after months of bearish control. 📉➡️📈
Using the Enhanced Trend Indicator – Reversal & Volume Logic (invite-only), we’re seeing a confluence-based green triangle entry form at a higher low, right as ETH compresses under the long-term moving average zone.
🔍 Breakdown of What’s Happening:
✅ Trend Exhaustion in Sight – Price has flattened and is now reclaiming short-term EMAs
✅ Signal at a Higher Low – The most recent green triangle appears after a bullish structure shift
✅ Volume is Rising Off Base – Not a spike yet, but accumulation behavior is visible
✅ MA Reclaim Attempt Underway – Price is squeezing under the SMA200 — a move above could trigger continuation
🎯 Hypothetical Playbook:
📥 Entry Zone: $1,770–$1,800 (volume-backed reclaim attempt)
🎯 Target Zone: $1,860–$1,910 (trendline + prior supply zone)
🚨 Invalidation: Close below $1,707 or loss of structure + volume fade
🔒 About This Script
This signal didn’t print randomly — it triggered only when trend, structure, and volume aligned.
The Enhanced Trend Indicator is designed to filter out noise and give you clean confluence-based setups that align with institutional behavior, not laggy crossovers.
📩 DM me if you’re serious about clarity and control in your trades. Access is invite-only.
#ETH #Ethereum #CryptoReversal #TrendTrading #EnhancedTrendIndicator #VolumeLogic #CryptoSwingTrades #TradingView

ETH Wykoff Accumulation and Massive Falling WedgeWe could be seeing a big up move here this weekend. Wyckoff accumulation is almost complete, if support holds we should see a breakout of the falling wedge. However, I think this will be a huge trap to shake out sellers, so be looking to take profits.

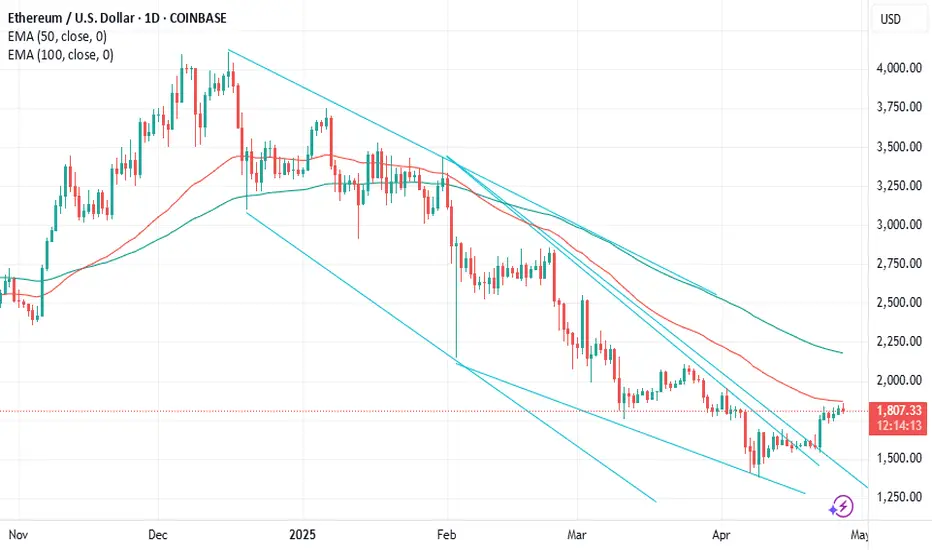
$ETH It's never to late to get on EMA 50 hitETH is on a climb, its still 50% cheaper than beginning of year.

Short-Medium Recovery For ETHUSDInverted H&S reversal likely building. Bearish continuation structure on Left Shoulder likely sees a mirroring effect here, synchronicity is common in shoulder formations and makes for a stronger neckline.
Targeting 2392 (+25%) should we get a meaningful break of 1820 level.
Trade Status - Pending. Likely to chop around a bit more first (see potetnial left shoulder formation). Look for tightening volatility compression for more optimal entry.


ETH/USD "Ethereum vs U.S Dollar" Crypto Heist Plan (Day/Swing)🌟Hi! Hola! Ola! Bonjour! Hallo! Marhaba!🌟
Dear Money Makers & Robbers, 🤑 💰💸✈️
Based on 🔥Thief Trading style technical and fundamental analysis🔥, here is our master plan to heist the ETH/USD "Ethereum vs U.S Dollar" Crypto Market. Please adhere to the strategy I've outlined in the chart, which emphasizes long entry. Our aim is to escape near the high-risk YELLOW ATR Zone. Risky level, overbought market, consolidation, trend reversal, trap at the level where traders and bearish robbers are stronger. 🏆💸"Take profit and treat yourself, traders. You deserve it!💪🏆🎉
Entry 📈 : "The heist is on! Wait for the MA breakout (1840) then make your move - Bullish profits await!"
however I advise to Place Buy stop orders above the Moving average (or) Place buy limit orders within a 15 or 30 minute timeframe most recent or swing, low or high level for Pullback entries.
📌I strongly advise you to set an "alert (Alarm)" on your chart so you can see when the breakout entry occurs.
Stop Loss 🛑: "🔊 Yo, listen up! 🗣️ If you're lookin' to get in on a buy stop order, don't even think about settin' that stop loss till after the breakout 🚀. You feel me? Now, if you're smart, you'll place that stop loss where I told you to 📍, but if you're a rebel, you can put it wherever you like 🤪 - just don't say I didn't warn you ⚠️. You're playin' with fire 🔥, and it's your risk, not mine 👊."
📍 Thief SL placed at the nearest/swing low level Using the 3H timeframe (1650) Day / Swing trade basis.
📍 SL is based on your risk of the trade, lot size and how many multiple orders you have to take.
🏴☠️Target 🎯: 2100 (or) Escape Before the Target
🧲Scalpers, take note 👀 : only scalp on the Long side. If you have a lot of money, you can go straight away; if not, you can join swing traders and carry out the robbery plan. Use trailing SL to safeguard your money 💰.
💰💵💴💸ETH/USD "Ethereum vs U.S Dollar" Crypto Market Heist Plan (Day / Swing Trade) is currently experiencing a bullishness🐂.., driven by several key factors.☝☝☝
📰🗞️Get & Read the Fundamental, Macro Economics, COT Report, Quantitative Analysis, Sentimental Outlook, Intermarket Analysis, Future trend targets... go ahead to check 👉👉👉🔗🔗
⚠️Trading Alert : News Releases and Position Management 📰🗞️🚫🚏
As a reminder, news releases can have a significant impact on market prices and volatility. To minimize potential losses and protect your running positions,
we recommend the following:
Avoid taking new trades during news releases
Use trailing stop-loss orders to protect your running positions and lock in profits
💖Supporting our robbery plan 💥Hit the Boost Button💥 will enable us to effortlessly make and steal money 💰💵. Boost the strength of our robbery team. Every day in this market make money with ease by using the Thief Trading Style.🏆💪🤝❤️🎉🚀
I'll see you soon with another heist plan, so stay tuned 🤑🐱👤🤗🤩

Enter The HeavensI’m 60/40 on this setup…maybe 75/25. I believe ETH has snatched up enough liquidity to enter the heavens. We shall see.


Ethereum Trades Sideways: Bulls Need a PushFenzoFx—Ethereum is trading sideways but remains above the 50-period simple moving average, signaling a bullish market. ETH is currently priced around $1,785. A close above $1,835 could trigger a move toward the $1,950 resistance.
Bearish Scenario:
If Ethereum falls below $1,690, supported by the 50-period simple moving average (4-hour chart), it could decline toward the $1,565 support level.

ETH is moving within the 1,550.00 - 1,830.00 range👉🏼 Possible scenario:
Ethereum dropped 3.3% to $1,754, echoing a broader 3.6% market correction. But under the surface, long-term holders are accumulating, with over 640,000 ETH flowing into wallets that haven’t sold since 2018—a multi-year high.
On-chain metrics show growing conviction: active addresses surged 10% in just two days, signaling rising network engagement. Despite short-term volatility, investor positioning suggests quiet confidence in Ethereum’s long-term fundamentals.
✅Support and Resistance Levels
Support level is now located at 1,550.00.
Now, the resistance level is located at 1,830.00.

EthereumETHUSD
- Completed " 123 " Impulsive Waves
- Break of Structure
- Demand Zone
- Ascending Triangle in Short Time Frame
- Order Block

ETHUSD-SELL strategy 6 hourly chart KAGIIt feels we are bit overextended. We have had a nice run up from $ 1,550 area and now we are on top side of the expected outcome short-term. The channel top is clearly observed and we have an overbought state, suggesting we should a move back towards $ 1,600 area.
Strategy SELL @ $ 1,790-$ 1,825 and take profit near $ 1,625 for now.

Weekly-Analysis:Ethereum (ETH)–Issue 275 (Free access)The analyst believes that the price of ETHUSD will increase within the time specified on the countdown timer. This prediction is based on a quantitative analysis of the price trend.
___Please note that the specified take-profit level does not imply a prediction that the price will reach that point. In this framework of analysis and trading, unlike the stop-loss, which is mandatory, setting a take-profit level is optional. Whether the price reaches the take-profit level or not is of no significance, as the results are calculated based on the start and end times. The take-profit level merely indicates the potential maximum price fluctuation within that time frame.
