Ethereum Messy But Bullish Inverse Head And ShoulderAlthough the sentiment around Ethereum seems to be leaning bearish at the moment, a closer look at the technicals reveals an interesting pattern. There's a potential inverse head and shoulders forming and still in tact as mentioned in prior charts. This traditionally signals that a bullish reversal could be on the horizon. Keep an eye on price action in the coming days; we might see Ethereum start to trend upwards soon
ETHHEDGEUSD trade ideas

ETHUSD May Rise from the Support Zone.When the ETHUSD weekly chart is examined; It is observed that the price movements continue above the support zone. As long as the crypto's 2125 level is not broken down, it is evaluated that the price movements above the 2750 level may exceed the 4105 level and target the 6086 level.

ETHUSD GOING TO HIT $4100Hi guys i think eth will be hitting 4100 in the near future why?
1. We are in bullish range
2. liquidity from irl already take out the next liquidity is ERL
great opportunity to accumulate

Decent pullback Google looks opportunistic hereGoogle traded higher into earnings only to have a decent pullback afterhours. Its trading into support which in my opinion is a decent buying opportunity. AMD also sold off below 110 and has finally reached a measured move from the start of its sell off last summer.

Ethereum's 50% Drop: What’s Next for Crypto Traders?Ethereum and altcoins have been crushed, down 50% from the highs. Many jumped in on the trendline break in January, but with Bitcoin stuck in a range and tariffs looming, it was a risky move. Now, the focus is on what’s next. Will US deregulation help? Could inflation and economic policies push markets lower? A breakout may take time, possibly in a few weeks. Buying dips is tempting, but without strong signals or a major shift, caution is key.
Watch the video to learn more.
This content is not directed to residents of the EU or UK. Any opinions, news, research, analyses, prices or other information contained on this website is provided as general market commentary and does not constitute investment advice. ThinkMarkets will not accept liability for any loss or damage including, without limitation, to any loss of profit which may arise directly or indirectly from use of or reliance on such information.

ETHUSD is showing signs of a possible correction 🔥 ETHUSD Analysis: Potential Correction Ahead 📉
ETHUSD is showing signs of a possible correction across multiple timeframes – **Daily**, **4-hour**, and **1-hour** – with current bearish signals emerging.
📉 Current Price:** $1,780**
Potential Target:** $1,700 - $1,650 zone**
🔻 Key Levels to Watch:
🔹 **Immediate Support:** $1,750 - $1,700
🔹 **Resistance:** $1,800 - $1,850
🔒 Suggested Stop Loss:** Above $1,820**
📊 Technical Signals:
🔸 **RSI Falling:** Indicates weakening bullish momentum
🔸 **Descending Trendline:** Resistance holding strong
🔸 **Bearish Divergence:** Observed on the 4-hour chart
ETHUSD is forming a descending triangle, increasing the likelihood of a bearish breakout toward the $1,650 support level.
**Bearish View:** Expecting ETHUSD to drop to $1,650 if support at $1,700 fails.
**Bullish View:** A breakout above $1,800 could push the price back toward $1,850 and beyond.
⚠️ **Note:** If ETHUSD falls below $1,650, we could see an extended correction to $1,600. ⚠️
🔔 **Be sure to follow updated ideas for real-time insights!** 🔔
⏰ **Analysis Time:** ETHUSD across multiple timeframes.
⚖️ **Always set a Stop Loss** to protect your capital! 🚨

ETHETH has poised for more bullish movement to the upside we are currently at a demand zone in confluence with a fibonnaci and also sma in line with the level if it should hold we might see eth rally into 3800 per coin and 4600 per coin

ETH will go down more don't buy!Ok Ethereum fell out of the wedge and went down heavy. Didn't expected that got liquidated heavy. But in hindsight was expecting something but you never know when and how.
Now making a new technical analysis, I see ETH doing this:
I zoomed out on the weekly TF on the logaritmic chart,
and there you can clearly see a new bigger wedge.
- There is a tripple top with higher highs
- The last pinbar pierced slightly out of the wedge and liquidated allooot of people.
I can see ETH can test the trendline and fall slightly out maybe 2K max.
But technically ETH has to breakout to the upside now,
In a couple of weeks ETH is heavy up. I think people wait for the FED decision in march for QE.
But I ladder in already in the chart already tells you actually ETH is going up.

Long eth Long eth @ 2783
SL 2287
target 4478
avg feb returns on eth is 36%
call me crazy i am expecting a banger of a month for eth

ETH / NASDAQ update#ETH has a positive pattern against NASDAQ this can be good news but if NASDAQ make a negetive pattern can pull down ETH with its self so this can be a bad news too !
we have to wait for better confirmations

Ethereum Below No Bueno LineI don't care which Trump is buying Ethereum.
Until that descending red line is closed above, there are no low risk entry points.

ETHUSDEthereum's market structure remains bullish, supported by increasing on-chain activity and institutional interest. With key resistance levels being tested, I anticipate a 25% upside move in the coming weeks. Price action aligns with broader market momentum—patience and execution are key. 🚀 #ETH #CryptoMarkets


Ethereum (ETH/USD) Weekly Analysis🚀 Ethereum (ETH/USD) – Bullish Elliott Wave 5 Expansion 🚀
📈 Weekly Chart Analysis | Elliott Wave + Fibonacci + MACD + RSI
Ethereum is currently in a Wave 4 corrective phase, preparing for a Wave 5 rally. If ETH holds above key support levels and breaks resistance, we could see a strong bullish move towards 5,440 USD and beyond.
📊 Elliott Wave & Fibonacci Analysis
Ethereum's Elliott Wave structure suggests that Wave 5 is yet to unfold. Based on Fibonacci extensions, the next key targets are:
✅ Fib 0.382 (~4,058 USD) – Initial resistance. A breakout here confirms bullish momentum.
✅ Fib 0.618 (~5,440 USD) – Mid-term bullish target.
✅ Fib 1.618 (~10,408 USD) – Extended bullish scenario if Wave 5 fully plays out.
🔹 Key Support Levels:
2,199 USD (Fib 0.236) – Must hold for the bullish structure to remain valid.
2,069 USD (Fib 0.5) – Deep retracement support.
🔹 Key Resistance Levels:
3,796 USD (Fib 0.382) – Crucial breakout zone.
4,058 USD (Fib 0.5) – Confirmation of bullish trend.
📉 MACD & RSI Confirmation
📊 MACD Analysis:
MACD lines are close to a bullish crossover, indicating momentum shift.
Histogram is contracting, suggesting sellers are losing control.
⚡ RSI Strengthening:
Currently around 51, signaling neutral momentum.
A break above 60 RSI confirms strong bullish pressure.
📊 Volume Analysis & Market Structure
📌 Current Volume:
Volume is currently low, which indicates market indecision.
A spike in buy volume will confirm a strong breakout above 3,796 USD.
🚦 Market Structure Confirmation:
Higher lows forming – Bullish structure remains intact.
Breakout above 3,796 USD + volume spike = Strong Wave 5 rally potential.
✅ Bullish Trade Plan
🔹 Entry Trigger: Breakout above 3,796 USD with volume confirmation.
🎯 Take Profit 1: 4,058 USD (Fib 0.382)
🚀 Take Profit 2: 5,440 USD (Fib 0.618)
🌕 Take Profit 3: 10,408 USD (Fib 1.618)
🛑 Stop-Loss: Below 2,199 USD (Fib 0.236)
💡 Conclusion & Market Sentiment
Ethereum is approaching a key resistance zone at 3,796 USD. A break and close above this level with strong volume will signal the start of Wave 5, potentially targeting 5,440 USD and beyond.
📢 Market sentiment remains cautiously bullish.
If ETH holds above 2,199 USD, the bullish structure remains intact.
MACD & RSI indicate growing momentum, but confirmation is needed.
Watch for a volume breakout above 3,796 USD before entering a trade.
📢 What’s your ETH price target? Comment below! 🔥
📈 Like & Follow for More Crypto Analysis! 🚀

Strong bullish signal for ETHWe see a very strong bullish signal for ETH. A limit order before the $2800 mark for a long position up to $3300 is a possible scenario. We had a breakout and were also able to confirm the sideways movements from previous price actions.

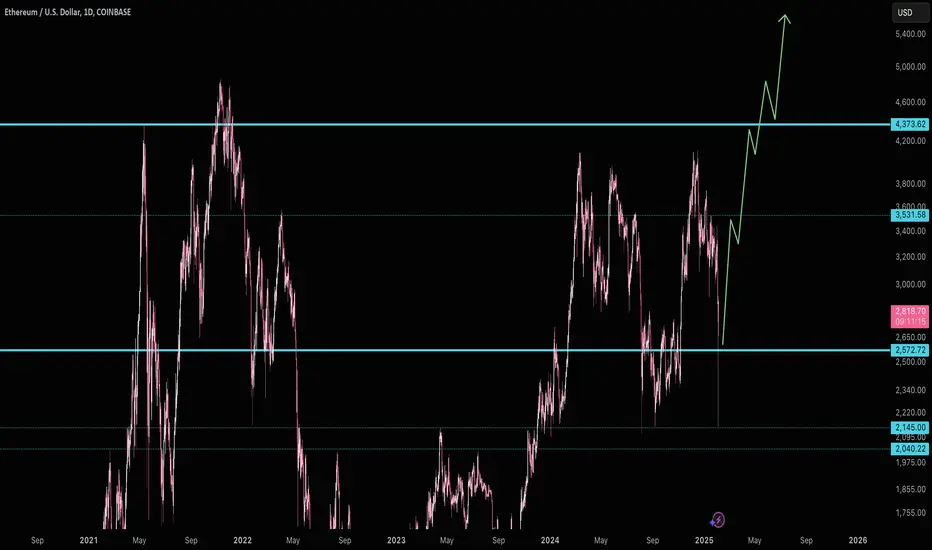
Ethereum Selling ClimaxThis last, uniquely dramatic, move down smells like capitulation for the remaining sellers. It's pretty hard to find any moves similar to February 3rd (May 2021 or covid?). ETH/BTC is in the long term buy zone below 0.0348.
$2570 is the major support, though every attempt down panics below considerably. $3530 is the most near term minor resistance. Upon clearing that, $4373 (the current ATH resistance) is the big resistance to clear. Because of how low ETH/BTC went and the rarity of this sell off I would heavily bet this resistance will be cleared and is highly likely to be our next major support area.
Eth is always the last in the cycle to run, so hold steady, the eth bull market is starting.
Good luck!
Ethereum Soars After Eric Trump’s StatementEthereum ( CRYPTOCAP:ETH ) saw a dramatic price swing after Eric Trump, son of U.S. President Donald Trump, made an unexpected bullish statement on X. His simple yet powerful remark, “In my opinion, it’s a great time to add CRYPTOCAP:ETH ,” ignited a surge in Ethereum’s price, sending it from $2,750 to $2,920 in under an hour. However, the rally was short-lived as ETH quickly retraced to $2,700, leaving traders wondering: Is this the start of a bigger move, or just a fleeting reaction?
Political Influence on Ethereum
Eric Trump’s statement came at a critical time, as the crypto market was already experiencing heightened volatility due to geopolitical and economic concerns. A major factor contributing to market uncertainty was Donald Trump’s announcement of new tariffs on Mexico, Canada, and China, which sent shockwaves through financial markets**.
Additionally, just before Eric Trump’s post, World Liberty Financial, a crypto project linked to the Trump family, addressed concerns over large fund movements to a Coinbase Prime address. They clarified that the transactions were merely internal treasury reallocations, not token sell-offs.
With institutional adoption of Ethereum growing, and Ethereum’s role in DeFi, NFTs, and Layer-2 scaling solutions expanding, many investors see dips as an opportunity rather than a sign of weakness.
Technical Outlook
At the time of writing, Ethereum is trading at $2,830, down 1.83% on the day. Despite this pullback, technical indicators suggest a potential bullish setup:
Ethereum is approaching oversold levels, indicating a buying opportunity for traders looking to enter at a discount. The current price action is forming a bullish flag pattern, with a support level at $2,666 (1-month low). If this support holds, CRYPTOCAP:ETH could be primed for a breakout.
A decisive break above $3,700, which aligns with Ethereum’s 1-month high, would confirm a trend reversal and potentially trigger a rally toward $4,000+.
What’s Next for Ethereum?
While Eric Trump’s statement briefly pumped ETH’s price, Ethereum’s long-term trajectory will depend on broader market sentiment, macro events, and its ability to break key resistance levels. If the bullish flag pattern plays out and Ethereum reclaims $3,700, we could see an extended uptrend in the coming weeks.

ETHEREUM showing strong downside after Crypto CrashLast year we were all bullish with the Crypto Summer.
This year, I think there is so much uncertainty with what is going on in the US that investors are flocking out of crypto and going straight back to safer havens like Gold, bonds and Platinum.
Anyway, I don't generally like big candles because it makes the analysis more erratic and volatile.
However, we do see downside to come for the crypto giant.
Price<20 and 200
Inv Cup and Handle
Major spike
Target $1,929

Eth ready Massive purchases can now begin!!
This is not a financial advice dyorr
Enjoyyyy
Buy and hold

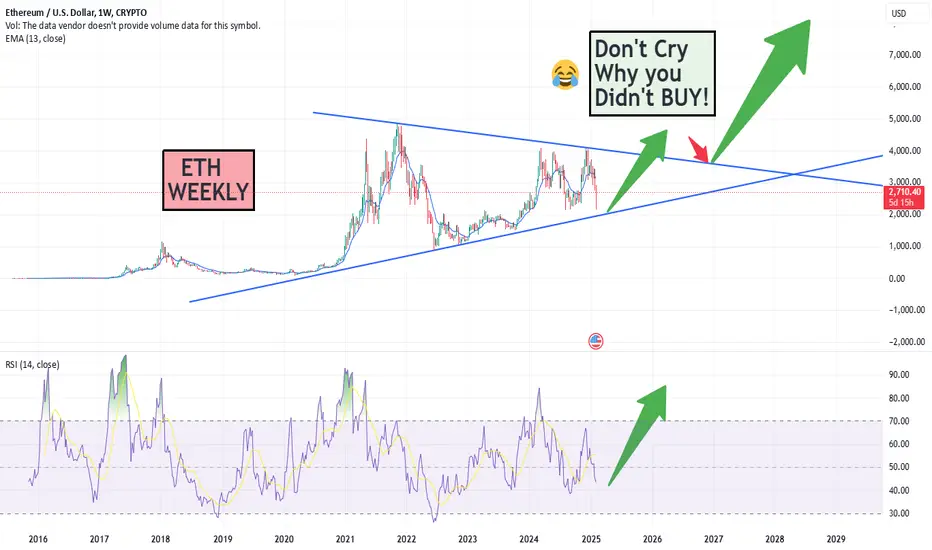
ETH - Weekly chartETH weekly chart
I can not ignore from the RSI that goes down, after having double top in the PA and RSI had a Bearish divergence, now we are after the execuiton, that means ATH is coming once we are out of the triangle.
I lean to 8000$- 10,000$ target.
NFA
just my thoughts
Fair Value Set UpBeautiful isn’t it? Perfect set up, we have a 1HR FVG that got retraced into and an overlapping PD array in the form of the STH. Entry confirmation will be a order flow leg on the timeframes 3-10 at the Fair Value Line ($2770.29) targeting the short term high of $2918.00. More or less a 5% move depending on entry.

#ETH/USDT#ETH
The price is moving in a descending channel on the 1-hour frame and is adhering to it well and is heading to break it strongly upwards
We have a bounce from the lower limit of the descending channel, this support is at a price of 2374
We have a downtrend on the RSI indicator that is about to be broken, which supports the rise
We have a trend to stabilize above the moving average 100
Entry price 2600
First target 2742
Second target 2942
Third target 3127

ETH Bi-Weekly vector recoveryTook a while but with the right news play it allowed for institutions to short, close and switch positions from where it all started with the range on higher Macro TF's
100% recovery achieved.
Now looking to the 5 day chart for Vectors to the upside above 3k and in relation to the day gap from 2.8k - 3.3k on ETH.D
