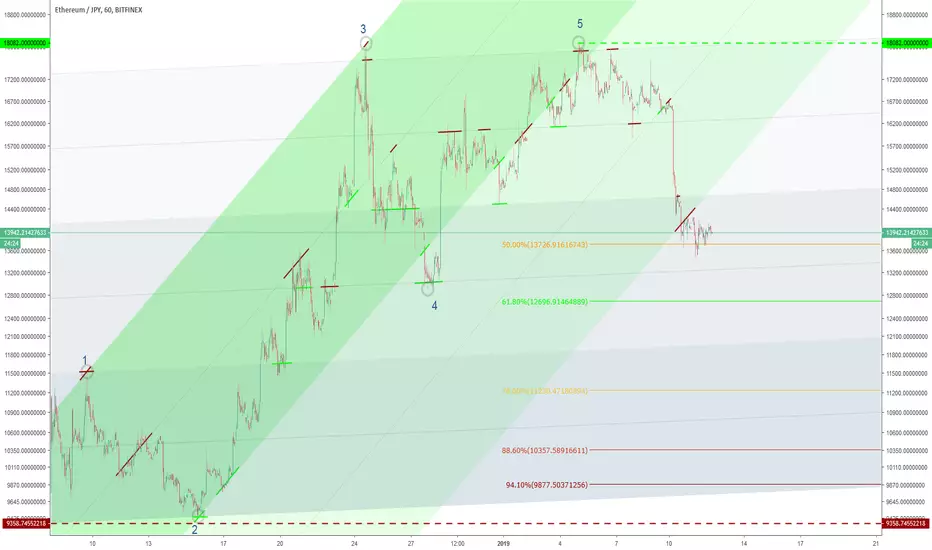
ETHJPY JAN-FEB 25
strong rejection from previous month.
indicate a nice pullback before continuing for short decision
targeting 557525 for short.
Related pairs

Sell ETHJPY. Just keep some JPY in the account for a bit.You cannot really short ETHJPY, but you can sell some ETH for JPY and aim to buy back more ETH on the reverse signal.


Bullish Motive Wave CompleteThis pair has the best structure for EW and KC analysis. Base channel shown in Blue and Acceleration channel shown in Green (with adjacent shadow channels).
Green and Red lines illustrate energy barriers (dynamic support and resistance offered by the growth structure) offering support from above (G
How to Trade Daily Double Bollinger Band StrategySetup
1st Bollinger Band (BB) default deviation (dev.) 2
2nd BB dev. 1
Upper Range ( UR -7.79% ) is space between the upper dev. 1 and 2 bands
Upper Mid Range (UMR) is space between 20ma and upper dev. 1 band
Lower Mid Range (LMR) is space between 20ma and lower dev. 1 band
Lower Range (LR) is

See all ideas
Summarizing what the indicators are suggesting.
Oscillators
Neutral
SellBuy
Strong sellStrong buy
Strong sellSellNeutralBuyStrong buy
Oscillators
Neutral
SellBuy
Strong sellStrong buy
Strong sellSellNeutralBuyStrong buy
Summary
Neutral
SellBuy
Strong sellStrong buy
Strong sellSellNeutralBuyStrong buy
Summary
Neutral
SellBuy
Strong sellStrong buy
Strong sellSellNeutralBuyStrong buy
Summary
Neutral
SellBuy
Strong sellStrong buy
Strong sellSellNeutralBuyStrong buy
Moving Averages
Neutral
SellBuy
Strong sellStrong buy
Strong sellSellNeutralBuyStrong buy
Moving Averages
Neutral
SellBuy
Strong sellStrong buy
Strong sellSellNeutralBuyStrong buy
Displays a symbol's price movements over previous years to identify recurring trends.