ETHEREUM SHORT TO $786! (UPDATE)ETH keeps on dumping😉
That's the power of Elliott Wave. We can see from our analysis that ETH remains within a 3 Sub-Wave (A,B,C) corrective channel. From naked price action we can still see that price remains bearish. Wave C target still remains around $786🩸
ETHUSD.P trade ideas

ETHDISCLAMER ON !!!!
ETH Support $1.749 and target $2.600
The market is not yet bullish in the short term, so buying must be disciplined cutloss
For the long term, you can buy in installments

ETH Weakness and the Bearish Flag targeting $1300 levels ETH is currently showing signs of weakness. I anticipated stronger buying pressure and a significant bounce from the $1900 levels. However, this scenario hasn't played out, and instead, a bearish flag has formed on the daily chart. This pattern suggests a potential target around the $1300 range. Stay cautious—avoid FOMO and refrain from entering long positions at this stage.

ETH PoV - 1.600$? Ethereum is going through a phase of challenges and opportunities, with its current price approaching the target i've set for a potential purchase of $1600. In recent months, Ethereum has faced a significant price correction, with Ether's value dropping by about 40%, largely due to the growing competition from other blockchains like Solana and Cardano, which are gaining popularity due to their speed and low transaction costs. Additionally, the rise of memecoins and recent developments in the cryptocurrency regulatory landscape have shifted attention away from Ethereum, while other cryptocurrencies, such as Bitcoin, seem to enjoy greater favor among investors. Internally, Ethereum is still facing delays and challenges related to technical updates, as well as some tensions within the developer community, which has made it harder to maintain market leadership. The decision not to acquire Ether for a U.S. cryptocurrency reserve by the Trump administration has also disappointed many investors, fueling outflows from ETFs invested in Ethereum. Despite these difficulties, long-term prospects for Ethereum remain positive. In fact, some analysts suggest that if demand and supply stabilize, and if Ethereum can overcome internal challenges and effectively respond to competition, it could reach new all-time highs, with a target potentially surpassing $5000 in the next 12 months. This scenario is supported by the continued interest in ETFs that invest in Ether, the expansion of its network, and improvements in regulations, which could further incentivize institutional and retail adoption. Ultimately, while there are risks to consider, investing in Ethereum could be highly rewarding in the long term, with the possibility that the cryptocurrency could recover ground and set new value records in the next 12 months. Achieving a $5000 target, however, will depend on Ethereum's ability to innovate, address internal issues, and navigate the evolving regulatory landscape, but if it can maintain its central role in the cryptocurrency ecosystem, it may continue to grow significantly.

Bullish Divergence on the dailyI would also say that there is a bullish divergence happening on the daily, which further indicates likelihood of upward momentum.


Heading into 50% Fibonacci resistance?Ethereum (ETH/USD) is rising towards the pivot which has been identified as a pullback resistance and could reverse to the 1st support.
Pivot: 1,945.48
1st Support: 1,751.48
1st Resistance: 2,038.68
Risk Warning:
Trading Forex and CFDs carries a high level of risk to your capital and you should only trade with money you can afford to lose. Trading Forex and CFDs may not be suitable for all investors, so please ensure that you fully understand the risks involved and seek independent advice if necessary.
Disclaimer:
The above opinions given constitute general market commentary, and do not constitute the opinion or advice of IC Markets or any form of personal or investment advice.
Any opinions, news, research, analyses, prices, other information, or links to third-party sites contained on this website are provided on an "as-is" basis, are intended only to be informative, is not an advice nor a recommendation, nor research, or a record of our trading prices, or an offer of, or solicitation for a transaction in any financial instrument and thus should not be treated as such. The information provided does not involve any specific investment objectives, financial situation and needs of any specific person who may receive it. Please be aware, that past performance is not a reliable indicator of future performance and/or results. Past Performance or Forward-looking scenarios based upon the reasonable beliefs of the third-party provider are not a guarantee of future performance. Actual results may differ materially from those anticipated in forward-looking or past performance statements. IC Markets makes no representation or warranty and assumes no liability as to the accuracy or completeness of the information provided, nor any loss arising from any investment based on a recommendation, forecast or any information supplied by any third-party.

ETH - 4 Red Monthly CandlesThis is the second time we’ve seen four consecutive red monthly candles for ETH. The last occurrence was during the 2018 bear market, where ETH crashed 88% from its peak.
This time, the four-month decline has resulted in a 57% drop so far. However, with the price now at a key support zone, I anticipate that the April 2025 candle will be green, signaling a strong recovery—potentially exceeding the previous month’s losses.
If April turns out to be another red month, we could see ETH dropping further toward the $1,300 level before finding a stronger bottom.
Let’s see how this plays out!
Cheers,
GreenCrypto

ETH MOST POSSIBLE TPSThat is most possible movement from eth
Bottom line
1550-1900
Midtearm tps
Tp1 4000
Tp2 7000
Tp3 10000
Long tearm tps
Tp1 10000
Tp2 25000
Tp3 45000

"ETH/USD: Breakout Incoming? Buy Signal from Falling Wedge!"It illustrates a downward trend with a falling wedge pattern, which is a bullish reversal pattern.
Key Observations:
Falling Wedge Pattern:
The price has been trading within a downward-sloping channel.
The wedge pattern suggests a potential breakout to the upside.
Breakout Opportunity:
The price is currently near the lower boundary of the wedge, suggesting a potential buying opportunity.
A buy signal is indicated at a key support level.
Target Price:
The chart has a target zone around $2,531 – $2,562, which suggests an expected upward move.
Technical Indicators:
The price is currently around $1,815, indicating a possible bottom formation.
A bullish move from this level is expected.
Trading Idea:
Entry: Buy near the current price ($1,815).
Target: $2,531 – $2,562.
Stop-Loss: Below $1,723 for risk management.
This analysis suggests a bullish reversal with a potential breakout from the falling wedge. However, traders should confirm with volume and other indicators before entering a trade.

ETHUSD Bullish ScenarioIn ETHUSD chart shows us clear bullish momentum.
RSI bullish divergence
Double bottom formation
Support zone
Bullish Falling Wedge
All these indicators shows that ETHUSD in upward direction after the breakout of trendline

The key is whether it can rise to 2271.0-2356.31
Hello, traders.
If you "Follow", you can always get new information quickly.
Please also click "Boost".
Have a nice day today.
-------------------------------------
The April TradingView competition is sponsored by PEPPERSTONE.
Accordingly, we will look at the coins (tokens) and items that can be traded in the competition.
I will talk about the ETHUSD chart.
--------------------------------------
(ETHUSD 1W)
If you look at the 1W chart, you can see how important the current price position is.
If it continues to decline this time, it is likely to fall to around 1337.54.
Therefore, the key is whether it can maintain the price by rising near the Fibonacci ratio of 0.236 (2089.91).
In order to turn upward on the 1W chart, it must rise near the Fibonacci ratio of 0.382 (2646.14) and maintain the price.
-
(1D chart)
Since the HA-Low indicator on the 1D chart is formed at the point of 1935.88, the key is whether it can receive support and rise near this area.
If it does not and falls below 1871.55, it is highly likely to fall to around 1626.95.
-
The M-Signal indicator on the 1W and 1M charts is passing near the Fibonacci ratio of 0.382 (2646.14).
Therefore, in order to turn into an uptrend, the price must rise above the M-Signal indicator on the 1W and 1M charts and be maintained.
To do so, we need to see if it can naturally rise above the M-Signal indicator on the 1W and 1M charts while maintaining the price by rising around 2271.0-2356.31.
However, in order to continue the uptrend, it is expected that the price must rise above the Fibonacci ratio of 0.382 (2646.14) and be maintained.
-
If the OBV does not rise above the upper line of the price channel and show an uptrend, it is likely that it will be difficult to sustain even if an uptrend appears.
The StochRSI indicator is showing a downward trend in the overbought zone.
Therefore, if the StochRSI indicator turns upward again and maintains the price around 1935.88, it is expected that it will lead to an attempt to rise to around 2271.0.
Therefore, when the competition started,
- If the StochRSI indicator did not turn upward,
- If the OBV did not rise above the upper line and showed an upward trend,
- If it did not receive support near 1935.88, it is expected that the SHORT position would be advantageous.
-
Thank you for reading to the end.
I hope you have a successful trade.
--------------------------------------------------
- Here is an explanation of the big picture.
I used TradingView's INDEX chart to check the entire range of BTC.
I rewrote the previous chart to update it while touching the Fibonacci ratio range of 1.902 (101875.70) ~ 2 (106275.10).
(Previous BTCUSD 12M chart)
Looking at the big picture, it seems that it has been maintaining an upward trend following a pattern since 2015.
That is, it is a pattern that maintains a 3-year bull market and faces a 1-year bear market.
Accordingly, the bull market is expected to continue until 2025.
-
(Current BTCUSD 12M chart)
Based on the currently written Fibonacci ratio, it is displayed up to 3.618 (178910.15).
It is expected that it will not fall again below the Fibonacci ratio of 0.618 (44234.54).
(BTCUSDT 12M chart)
Based on the BTCUSDT chart, I think it is around 42283.58.
-
I will explain it again with the BTCUSD chart.
The Fibonacci ratio ranges marked in the green boxes, 1.902 (101875.70) ~ 2 (106275.10) and 3 (151166.97) ~ 3.14 (157451.83), are expected to be important support and resistance ranges.
In other words, it seems likely that they will act as volume profile ranges.
Therefore, in order to break through these ranges upward, I think the point of interest is whether they can be supported and rise near the Fibonacci ratios of 1.618 (89126.41) and 2.618 (134018.28).
Therefore, the maximum rising range in 2025 is expected to be the 3 (151166.97) ~ 3.14 (157451.83) range.
In order to do that, we need to see if it is supported and rises near 2.618 (134018.28).
If it falls after the bull market in 2025, we don't know how far it will fall, but based on the previous decline, we expect it to fall by about -60% to -70%.
Therefore, if it starts to fall near the Fibonacci ratio of 3.14 (157451.83), it seems likely that it will fall to around Fibonacci 0.618 (44234.54).
I will explain more details when the bear market starts.
------------------------------------------------------

ETH Quick sell to double bottom then buy*I am in no way a financial advisor and you should always do your own due diligence before placing any trade. Do not trade what you are not comfortable with losing. No trade is guaranteed.
SL 2163
TP 1761

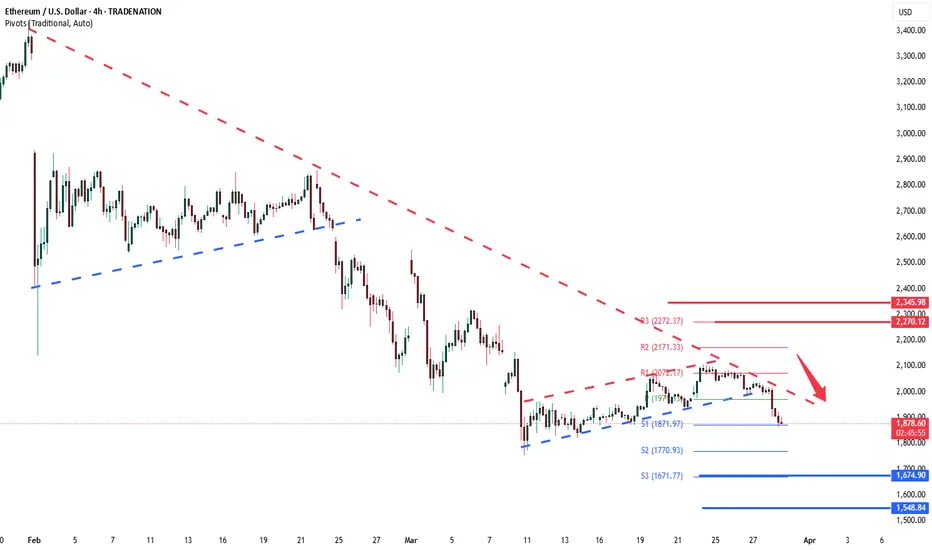
ETHUSD INTRADAY downtrend continuation below 2,171The ETH/USD pair is exhibiting a bearish sentiment, reinforced by the ongoing downtrend. The key trading level to watch is at 2,171, which represents the current intraday swing high and the falling resistance trendline level.
In the short term, an oversold rally from current levels, followed by a bearish rejection at the 2,171 resistance, could lead to a downside move targeting support at 1,872, with further potential declines to 1,770 and 1,670 over a longer timeframe.
On the other hand, a confirmed breakout above the 2,171 resistance level and a daily close above that mark would invalidate the bearish outlook. This scenario could pave the way for a continuation of the rally, aiming to retest the 2,272 resistance, with a potential extension to 2,345 levels.
Conclusion:
Currently, the ETH/USD sentiment remains bearish, with the 2,171 level acting as a pivotal resistance. Traders should watch for either a bearish rejection at this level or a breakout and daily close above it to determine the next directional move. Caution is advised until the price action confirms a clear break or rejection.
This communication is for informational purposes only and should not be viewed as any form of recommendation as to a particular course of action or as investment advice. It is not intended as an offer or solicitation for the purchase or sale of any financial instrument or as an official confirmation of any transaction. Opinions, estimates and assumptions expressed herein are made as of the date of this communication and are subject to change without notice. This communication has been prepared based upon information, including market prices, data and other information, believed to be reliable; however, Trade Nation does not warrant its completeness or accuracy. All market prices and market data contained in or attached to this communication are indicative and subject to change without notice.
ETHUSDBearish trend with bear continuation flag and double top formation. indicating a possible bearish trend.
ETHUSD: Different asser, same pattern, same ending.Ethereum remains bearish on its 1D technical outlook (RSI = 40.440, MACD = -154.200, ADX = 29.206) but sits at the bottom of its 1 year Megaphone. This is the same pattern that Bitcoin traded on last year and Gold during its most recent Bear Cycle. In all instances, when the price found support on the MA50 and broke over the Megaphone, it reached the 2.0 Fibonacci. According to this, it won't be surprising if we see ETH at 9,000 by the end of the year.
## If you like our free content follow our profile to get more daily ideas. ##
## Comments and likes are greatly appreciated. ##

ETHEREUM READY FOR TAKEOFF?Hi traders! Analyzing Ethereum (ETH/USD) on the 1H timeframe, spotting a potential entry:
🔹 Entry: 1,840.30 USD
🔹 TP: 1,990.20 USD
🔹 SL: 1,753.70 USD
Ethereum is showing signs of a possible bullish reversal! RSI is near oversold levels, and if momentum picks up, we could see a strong move toward 1,990.20 USD. Eyes on the charts! 📈
⚠️ DISCLAIMER: This is not financial advice. Trade responsibly.

(ETH/USD) Poised for a Major BreakoutMarket Structure & Analysis:
Falling Wedge Breakout: Ethereum previously broke out of a falling wedge pattern, which is a bullish reversal signal.
Ascending Triangle Formation: Price is currently forming an ascending triangle, indicating potential for a breakout.
Support Levels:
$2,021 – Local support.
$1,926 - $1,873 – Strong demand zone.
Resistance Levels:
$2,120 - $2,251 – First resistance zone.
$2,531 - $2,564 – Final bullish target zone.
Trading Plan:
Buy Setup:
Enter long on breakout above $2,120 with strong momentum.
Stop Loss: Below $2,021 (support level).
Take Profit Targets:
TP1: $2,251 (first resistance).
TP2: $2,531 (main target).
TP3: $2,564 (extended bullish target).
Risk Factors:
A failure to break $2,120 could result in a pullback to $1,926.
Macroeconomic factors or Bitcoin’s movement may impact Ethereum’s trend.


Ethereum (ETH/USD) Bullish Breakout – Eyes on $2,500+ Target 📈 Chart Overview:
Timeframe: 4H (Ethereum/USDT)
Trend Reversal: Ethereum has broken out of a falling wedge pattern, indicating a shift from bearish to bullish momentum.
Support Level: Around $1,800 - $1,900, where price previously found strong buying interest.
Retest Confirmation: ETH successfully retested the breakout level (~$2,020), confirming a potential bullish continuation.
Resistance Zone: The next key resistance area is around $2,250, followed by a potential move towards the $2,530 - $2,550 target zone.
📊 Trade Setup:
Bullish Bias: Price action suggests an upward move towards $2,250 and potentially $2,530.
Risk Management: A stop-loss can be set below $2,020 to minimize downside risk.
🔥 Conclusion: If Ethereum maintains momentum above the retest zone, it could see a strong rally in the coming days! 🚀

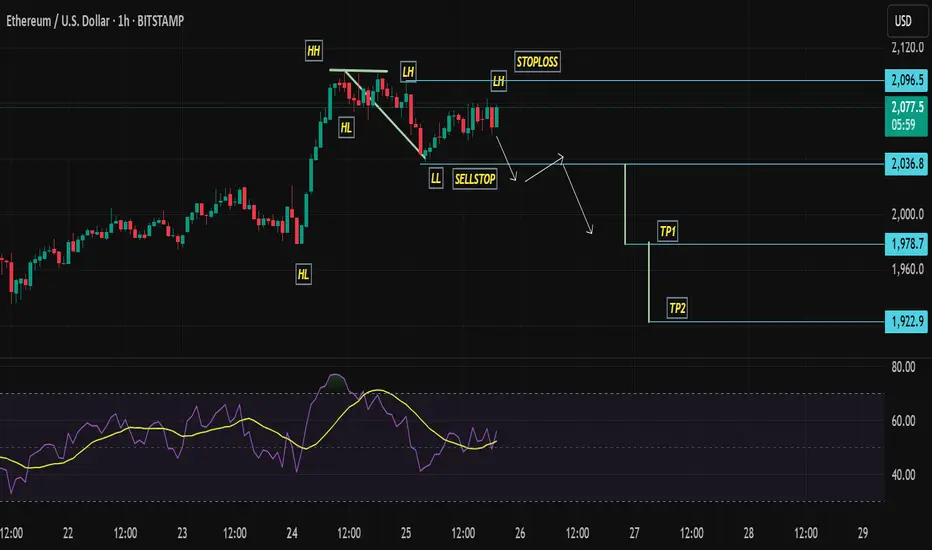
ethusd short looks like higher time frame bearish retest is complete and price wants an impulse move in the direction of the predominant trend which is downwards

ETH Did his last kiss! Huge upmove inComing I share my thoughts and ideas rarely
I always draw my lines to find out how the majority of people see the charts.
dont want to explain more , but now I think market makers tried their best to show market is bearish , ( as a prove check the fear and greed index ) which made wounder if these prices really are fairly valued or not ?!
anyway , maybe its time for eth to reclaim some shares from market dominance :)
will update this soon ...

ETH USD ShortTrumps hope rally doesnt change in real fundamentals.
ETHUSD definitley a MUST-Short to me.
I cover the sells there where hype is the biggest: Others buy breakouts,or set their stops and take profits,I sell exactly those levels.
