Range or drop for the 4H chartIn the 4H chart in futures operations, the price at this moment is in a NON-OPERABLE AREA, since we would wait for the time for the price to retrace or make a range and purchase positions are reopened
ETHUSD.P trade ideas

Ethusd buy zone @2092 H4 chart analysis📈 ETH/USD Trade Update - H4 Chart
✅ Confirmation Factors: Bullish structure, RSI above 50, and MACD bullish cross with increasing volume.
📊 Key Zone: Confirmation around $2000-$2050 strengthens bullish outlook.
🔹 Buy Zone: $2088
🎯 Target 1: $2324
🎯 Target 2: $2533
🎯 Target 3: $2830
💡 Stay patient for confirmation and manage risk wisely.
Would you like to add stop loss guidance or risk management tips?

ETHUSD New trendETHUSD has currently successfully broken through the resistance level of 2,100 and has re-entered a new range.
Hold for the long term
💎💎💎 ETHUSD 💎💎💎
🎁 Buy@2050 - 2080
🎁 TP 2200 2300 2400 2500
The market has been extremely volatile lately. If you can't figure out the market's direction, you'll only be a cash dispenser for others. If you also want to succeed,Follow the link below to get my daily strategy updates

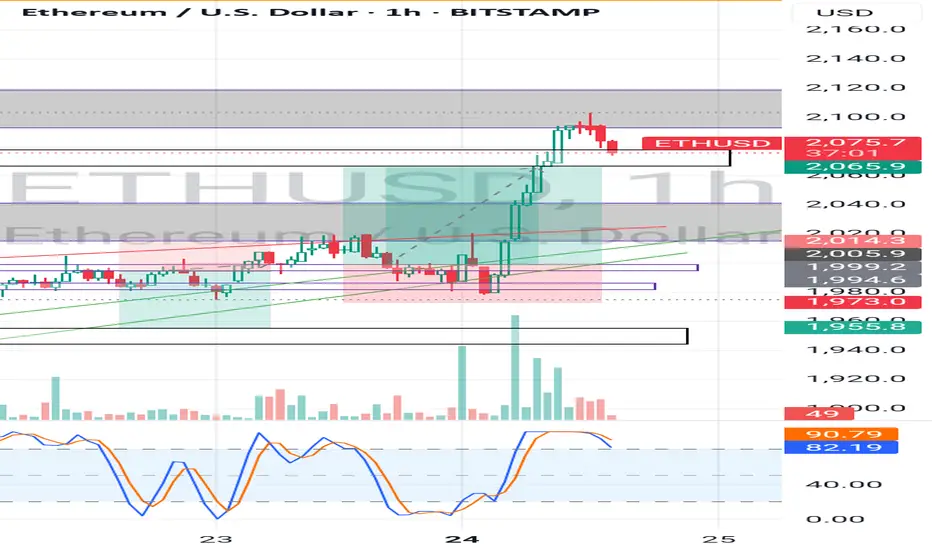
ETH/USD Breakout – Long Position Activated!Hi Traders ! Ethereum on the 1H chart has been trading within a descending channel and is now testing the upper boundary. I’ve placed a long entry expecting a breakout, targeting the $2,061 - $2,070 zone. Stop-loss set in case of a false breakout. RSI is showing signs of recovery. Let’s see how it plays out! 🔥👀
Disclaimer: This is not financial advice. Trade at your own risk. 🚨

Ethereum (ETH/USD) Price Analysis: Breakout PotentialThis Ethereum (ETH/USD) 4-hour chart from TradingView presents a technical analysis focused on a potential breakout. The chart incorporates Fibonacci retracement levels, trendlines, and moving averages to identify key price levels. The price of Ethereum is currently testing a breakout above a descending trendline, suggesting a bullish reversal.
Key Fibonacci levels are highlighted, with the 0.236 level at $2,120.21, 0.5 at $2,158.8, and 1.0 at $2,519.19, indicating potential resistance and support zones. The chart also outlines two take-profit (TP) targets, with TP1 around $2,321.80 and TP2 near $2,518.49. A major moving average (MA) at $2,200.00 acts as an additional resistance level.
Ethereum's price is currently at $2,092.75, with bid-ask values matching at $2,092.95. The market is reacting to key support at approximately $1,996.99. A successful breakout above resistance could confirm an upward trend, while failure might lead to a retest of lower support zones.
This technical setup is essential for traders monitoring ETH/USD, as it provides insight into price action, key support and resistance levels, and potential breakout opportunities based on Fibonacci retracements and trendline analysis.

$ETHNot much to say about CRYPTOCAP:ETH but we can see that institutions love ETH, possible $10,000 per Ethereum is coming.
What your thoughts? Comment Like & Share
LTCUSD INTRADAY at decisive point Technical Analysis of LTC/USD
Trend Overview: LTC/USD exhibits a neutral sentiment within a prevailing range-bound trading structure. The recent price action suggests an oversold bounce-back, forming a bearish sideways consolidation. This indicates indecision in the market, with neither bulls nor bears taking full control.
Key Levels:
Resistance: 960.00, 988.50, 1031.40
Support: 883.00, 840.10, 808.80
Price Action Analysis: The key resistance level at 960.00 serves as a crucial pivot point. An oversold rally from current levels could face rejection at this zone, leading to further downside movement. Failure to break this resistance may result in renewed bearish momentum, targeting lower support levels at 883.00, followed by 840.10 and 808.80 in the longer timeframe.
Alternatively, a confirmed breakout and daily close above 960.00 would shift sentiment to bullish, potentially opening the door for an upward move towards 988.50 resistance. Further bullish momentum could drive LTC/USD to 1031.40, reinforcing a stronger uptrend.
Conclusion: LTC/USD remains in a consolidation phase, with the 960.00 level acting as a decisive point for future price direction. A bearish rejection at this level could reinforce a downward trajectory, while a breakout above it would invalidate the bearish bias, signaling potential further gains. Traders should closely monitor price action near 960.00 to assess the next significant move.
This communication is for informational purposes only and should not be viewed as any form of recommendation as to a particular course of action or as investment advice. It is not intended as an offer or solicitation for the purchase or sale of any financial instrument or as an official confirmation of any transaction. Opinions, estimates and assumptions expressed herein are made as of the date of this communication and are subject to change without notice. This communication has been prepared based upon information, including market prices, data and other information, believed to be reliable; however, Trade Nation does not warrant its completeness or accuracy. All market prices and market data contained in or attached to this communication are indicative and subject to change without notice.

How "Max Pain" Can Become Your Ally in ETH TradingImagine standing on the edge of a cliff, peering down at a raging river below. That’s the feeling traders experience as the options expiration date approaches. At this moment, all bets are off, and the market is primed for sharp movements. Have you ever wondered how to turn this uncertainty into an advantage?
Let’s break it down. The ETH market is buzzing with tension: open interest in options is soaring, and the ratio of in-the-money to out-of-the-money puts stands at 48% to 52%. This means nearly half of all puts have intrinsic value. Professional market participants, like skilled magicians, hedge their positions, transforming them into delta-neutral setups.
But how do they do this? Right, by buying futures! This is the hidden growth driver we’ve been witnessing over the past few days. While I won’t dive into other factors like news, it’s crucial to understand that this dynamic could be the key to success.
Now, let’s talk about “Max Pain.” The Max Pain level for this options series landed on the March 2nd trigger point, where we saw a powerful bullish candle. But are the bulls stuck there? I’m pretty sure they are. Now, we’re left to watch whether the market can break free from this grip.
Personally, I see an opportunity to open a short position. But let’s see if the “law of gravity” will hold true for Max Pain this time.
Stay tuned If you want to stay updated on forex and crypto trading nuances!

Bullish Reversal with Inverse Head & Shoulder + QuasimodoEthereum is currently showing strong bullish potential on the 1-hour chart, forming a powerful confluence of reversal patterns—Inverse Head & Shoulders and the Quasimodo Pattern. These patterns often indicate trend exhaustion and signal a shift in momentum.
📊 Pattern Analysis
1. Inverse Head & Shoulders Pattern
This pattern is a classic bullish reversal setup.
The structure is well-defined:
Left Shoulder: Forms after a local downtrend.
Head: Makes a deeper low.
Right Shoulder: Higher low indicating reduced selling pressure.
The neckline has just been breached, suggesting the breakout has begun.
2. Quasimodo Pattern (QM)
Often forms at key reversal points.
Characterized by a head and shoulders structure with a lower low (head) and a higher low (right shoulder).
Acts as additional confirmation of a reversal with tight invalidation zones.
The Quasimodo zone also aligns with strong demand just below $1,970.
🎯 Target Projection
The projected minimum target is measured from the bottom of the head to the neckline, then added to the breakout point.
Target: ~$2,121.41
This implies a 5.38% potential move from the breakout zone.
The yellow highlighted area marks a potential supply zone, where price could face resistance.
🧠 Trade Considerations
Entry: On breakout above neckline (already triggered).
Confirmation : Look for bullish candles + volume spike.
Retest Entry: If price revisits the neckline (~$2,000 zone) and holds as support, it provides a second chance entry.
Invalidation: A break below the right shoulder (~$1,965) would invalidate the pattern setup.
Stop Loss Idea : Below the head or right shoulder depending on risk tolerance.
📌 Confluence Factors
Dual bullish reversal patterns (H&S + QM)
Breakout in progress with bullish momentum
Strong price reaction from the higher low confirms buyer interest
Room to run into previous supply zone around $2,120–2,140

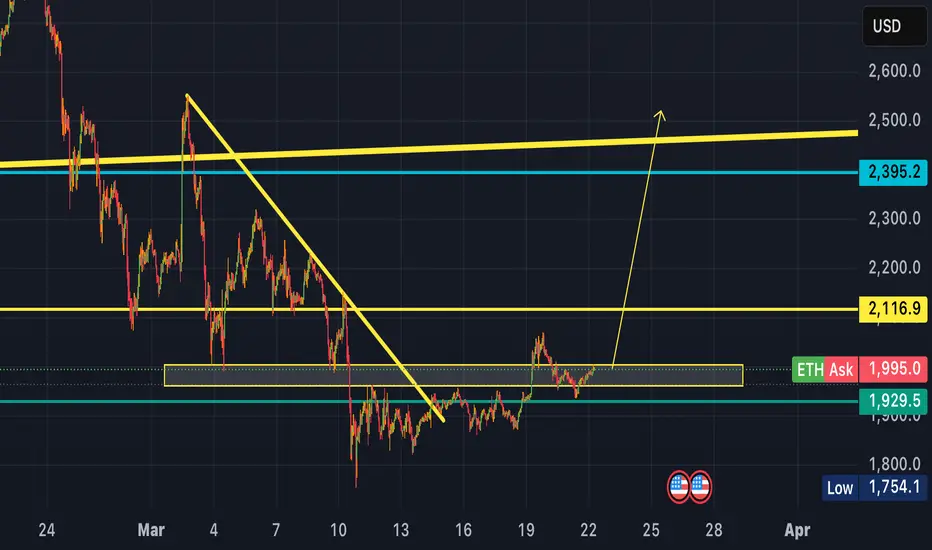
ETH ready for a rebound towards 2.5k- after breaking the magical line of 2000$, expectation was that the final capitulation for ETH has started
- that did not happen however and ever since that 2k break, bulls have consistently shown strength on low time-frames
- with the recent S/R flip, it is likely ethereum and by extension the entire crypto market gets a relief rally
- Bitcoin could go all the way to 110k however, if that happens, it is likely the move is going to be a short

Could Pectra Upgrade leads Eth to 11K this cycle?
sentiment on ETH never has been that low while all the arguments against ETH will just be vanished with the upcoming Pectra upgrade
volume is as low as pre 2017 era so I think we can consider ourselves around June July 2017, when ETH made a ~70% retrace from 450 to 150 than peaked at 2K
Despite some delays I don't see why the upgrade will not happen...patience is key
_______
In a more technical view lets zoom to the daily timeframe
- its visible on the weekly chart: ETH bounced from weekly POC, saving it from collapse (?)
- around 0.5 fib now from low cycle to top cycle
- bounced back above that big blue trendline, its an important support that we dont want to loose
I would say the low has been done on the 11th of March, as for BTC
2 and a half possibilities here,
- bullish scenarios : I think there's too much stake on this asset, we bounce from here to see at least 2800 zone
either only up from now, either we go back to 1800 to make a double bottom, sort of H&S pattern kinda happening often at least this cycle
as long as we dont make a lower low this scenario is valid
in this scenario if the upgrade keep its promises and volume is back, I don't see why we wouldn retest new ATHs
- bearish scenario : we breakdown for a lower low aiming to 1600 area, the retest of the trendline above would fail and it would probably be the end of this bull market, that a lot of ppl have already called
______
fast check on whats happening if we zoom again:
Heres the 4H
4H closes in 1 hour but as you can see for now ETH pinged from that blue trendline i think we really dont want to loose
I bought a bit again today, lets see
cheeeers

ETHUSD Bearish Continuation pattern resistance at 2,171The ETH/USD pair is exhibiting a bearish sentiment, reinforced by the ongoing downtrend. The key trading level to watch is at 2,171, which represents the current intraday swing high and the falling resistance trendline level.
In the short term, an oversold rally from current levels, followed by a bearish rejection at the 2,171 resistance, could lead to a downside move targeting support at 1,872, with further potential declines to 1,770 and 1,670 over a longer timeframe.
On the other hand, a confirmed breakout above the 2,171 resistance level and a daily close above that mark would invalidate the bearish outlook. This scenario could pave the way for a continuation of the rally, aiming to retest the 2,272 resistance, with a potential extension to 2,345 levels.
Conclusion:
Currently, the ETH/USD sentiment remains bearish, with the 2,171 level acting as a pivotal resistance. Traders should watch for either a bearish rejection at this level or a breakout and daily close above it to determine the next directional move. Caution is advised until the price action confirms a clear break or rejection.
This communication is for informational purposes only and should not be viewed as any form of recommendation as to a particular course of action or as investment advice. It is not intended as an offer or solicitation for the purchase or sale of any financial instrument or as an official confirmation of any transaction. Opinions, estimates and assumptions expressed herein are made as of the date of this communication and are subject to change without notice. This communication has been prepared based upon information, including market prices, data and other information, believed to be reliable; however, Trade Nation does not warrant its completeness or accuracy. All market prices and market data contained in or attached to this communication are indicative and subject to change without notice.

ETH USD SHORT Ethereum price has been choppy and low in volume since it's major dump during the week.
And still can't get passed the minor resistance zone, from which I'm capitalizing on to the next major Support in confluence with the diagonal Support Trendlines.
So let's see how price moves.
The_KLASSIC_TRADER.

ETH/USD – Bullish Breakout & Buying OpportunityEthereum has broken out of a descending channel and is consolidating near a key support zone. The price action suggests a potential bullish continuation, with a buying opportunity forming above the $2,000 - $2,100 support level.
Key Levels to Watch:
Support: ~$2,000, ~$1,800
Resistance Zone: ~$2,250
Target: ~$2,530
Trading Plan:
Buy Entry: On breakout and retest above $2,250
Stop-Loss: Below $2,000
Take-Profit: $2,530
If Ethereum successfully breaks resistance with volume confirmation, it could rally toward $2,500+, making this a strong bullish setup. Keep an eye on price action for confirmation. 🚀

Etherium will blast in upcoming weeksI m very sure that Etherium will very bullish in coming days so traders don't escape this opportunity 2800 is very good zone where market can reach .

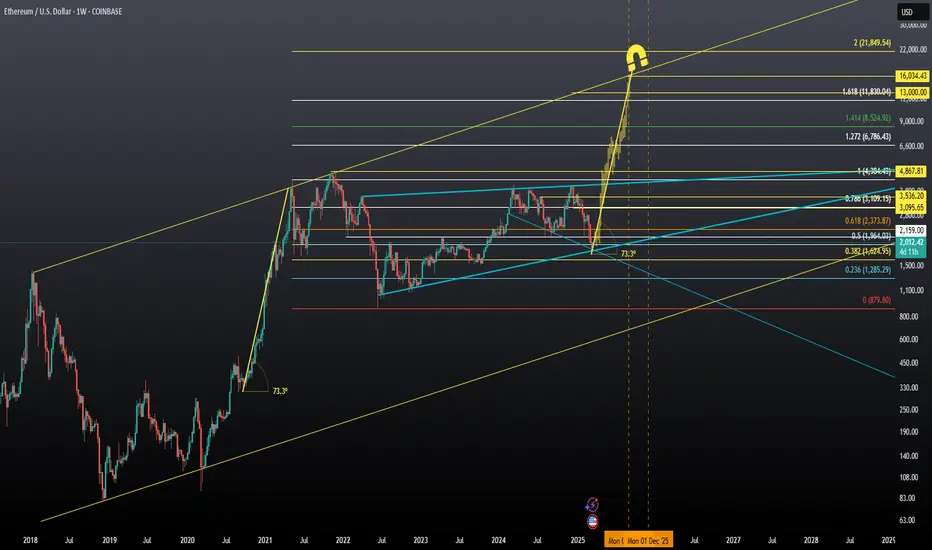
Whales Only: Ride Ethereum’s 5x Wave to $8K and Beyond"Attention traders and whales—check this chart! I’m breaking it down with monthly candles.
Short-term traders: Think twice before shorting. Flip your chart to monthly, peek at the RSI, and see the risk you’re taking for a few bucks. Whales are lurking, and they’ll scoop your tiny bags when you least expect it.
Long-term traders and whales: This is your playground. Last bear market, monthly RSI hit 44 with ETH priced between $900-$1,000. From there, we spiked to $4,000 three times. Buyers loaded up at $900-$1,200, sold at the top—first a 3x run, then two 2x corrections. Total move? 5x.
Fast forward to today: RSI’s back at 44, the same level as the last bear bottom. History’s whispering opportunity. When the next bear market hits, most coins will bleed red—but not Ethereum. Expect green daily candles and long-trade fireworks. From $1,750, we’re eyeing a 3x-5x surge: first to $8K, dip to EUROTLX:4K , then back-to-back $8K runs.
We’re sitting at $1,970 now, just above the $1,750 bottom. This is a whale’s game—perfect for those dropping $100M+ into the market. Load up, legends. The chart doesn’t lie. "

ETH USD LONG RESULT After closing the Short at Break Even, I wait for price to reach and hold from the now support and opened a long position of which went better than planned.
_ THE _ KLASSIC _ TRADER_.
LOW RISK ETH SHORTSimply hopped into an ETH Short at around 11;15 pm EST
about a 40 pip SL @ $2,580
Looking for a 1:4 or 1:5
TP 1 : 2,487
TP 2 : 2,420
TP 3 : 2,355
If you can handle volatility hold till possible $2,100 or below!
Always good to scale in and out protecting your capital EFFICIENTLY!
Let's Get it PPFX Fam! Peace

2.5 reasons to not buy crypto todayLet me be clear - I am BULLISH on crypto! But for your wallet's sake, be patient! All (most) crypto investors want to be millionaires by next week on XRP and the like. I won't argue whether you will be or not - but please just give yourself a better entry!
Maybe we pop again before falling, maybe we never fall again, but with the broader markets in a bad place, we have every reason to dip further for more liquidity. For months I've been spitting out this same video in longer form and I simply wanted to show here, in the most basic way possible, why the crypto market wants to come down further. There are SO MANY BUYERS down below! If BTC wants to hit $1MM, ETH $10K and XRP $200, then we will need the liquidity that is sitting below to get there. We will need to shake out the last few that are holding crappy positions near ATH's and reload with larger institutional $.
The past few months in crypto have taught me an incredible lesson about patience because though my analysis has been telling me to wait, wait, wait, I am tempted every day to buy. And I'm not - instead I've been trusting my analysis and intuition and have been shorting BTC futures every chance I get.
Hope this helps someone to NOT BUY crypto today!
Happy Trading :)

ETH USD SHORT RESULT Ethereum later held support from our diagonal Support Trendlines and took a minor bounce.
Though I closed at Break Even, price moved to sl and currently still hasn't decided on a direction to Take.

ETH Breakout Setup: Eyeing $2,550 Target!"Key Observations:
Strong Support Level: ETH has bounced from a strong support zone around $1,792 - $1,905.
Retest & Buy Zone: Price has broken above a key level and is now retesting it, indicating a potential buy opportunity.
Resistance Zone: A key resistance zone is marked near $2,557.71.
Target Levels: The first target is set at $2,557.71, with a possible further extension to $2,854.38.
Bullish Confirmation: If ETH maintains support above $1,981, the uptrend towards the target is likely.
Trading Idea:
Entry: Buy on successful retest.
Stop Loss: Below the strong level at $1,905 - $1,792.
Take Profit: First target at $2,557.71, extended target at $2,854.38.
This setup follows a classic breakout and retest strategy, suggesting bullish momentum if Ethereum sustains above key levels.

Ethereum - Huge Pump in 2025Ethereum is in a bullish wedge pattern! It is pretty undervalued now at $2000! I believe ETH will pump hard in 2025, with the ambitious targets on the chart projected to be reached between September and December 2025.
Also, remember now ETH is the largest holding of World Liberty Financial the invest group of the trump family!
DO YOU UNDERSTAND WHY ETH CAN'T BREAK THE $4000 PEAK YET?DO YOU UNDERSTAND WHY ETH CAN'T BREAK THE $4000 PEAK YET?
Are you still DCA'ing ETHUSDT?
Are you still holding ETHUSDT?
Are you still hoping for an altcoin season?
Good luck.
