Ethusd Long setup #nonchalantICTjust a long setup im seeing on ethusd. We purged sellstops and reverted higher. Then continued respecting discount arrays.
ETHUSD.P trade ideas

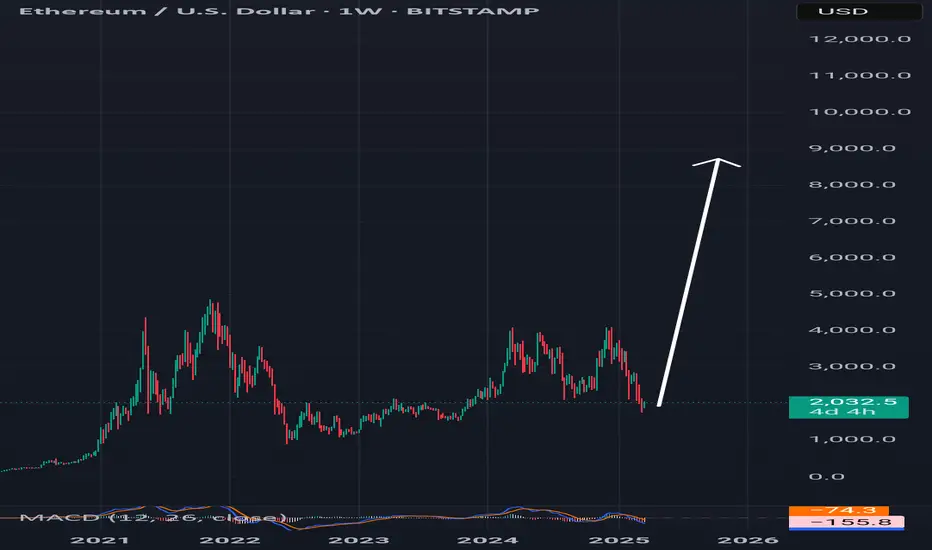
ETH/USDETH reaches the historical buy zone that triggers a macro bottom.
✅ Price is testing this trendline, just like it did in 2020, 2021, 2022, and 2023 - each time leading to a major bounce!
✅ RSI is also touching historical support, signaling a possible reversal.
If history repeats, this could be a high-reward buying opportunity before the next major move!

ETHUSD Bearish continuation pattern forming?The ETH/USD pair is exhibiting a bearish sentiment, reinforced by the ongoing downtrend. The key trading level to watch is at 2,140, which represents the current intraday swing high and the falling resistance trendline level.
In the short term, an oversold rally from current levels, followed by a bearish rejection at the 2,140 resistance, could lead to a downside move targeting support at 1,723, with further potential declines to 1,545 and 1,375 over a longer timeframe.
On the other hand, a confirmed breakout above the 2,140 resistance level and a daily close above that mark would invalidate the bearish outlook. This scenario could pave the way for a continuation of the rally, aiming to retest the 2,344 resistance, with a potential extension to 2,537 and 2,620 levels.
Conclusion:
Currently, the ETH/USD sentiment remains bearish, with the 2,140 level acting as a pivotal resistance. Traders should watch for either a bearish rejection at this level or a breakout and daily close above it to determine the next directional move. Caution is advised until the price action confirms a clear break or rejection.
This communication is for informational purposes only and should not be viewed as any form of recommendation as to a particular course of action or as investment advice. It is not intended as an offer or solicitation for the purchase or sale of any financial instrument or as an official confirmation of any transaction. Opinions, estimates and assumptions expressed herein are made as of the date of this communication and are subject to change without notice. This communication has been prepared based upon information, including market prices, data and other information, believed to be reliable; however, Trade Nation does not warrant its completeness or accuracy. All market prices and market data contained in or attached to this communication are indicative and subject to change without notice.

Ethereum (ETH/USD) – Potential Breakout from Range Towards $2,50📊 Chart Insights:
ETH/USD is currently ranging near the $1,950 zone, following a consolidation phase.
A strong resistance zone is visible between $2,302 - $2,527, which has historically acted as a rejection point.
Support levels are established around $1,824 - $1,909, forming a strong base for price action.
A breakout above the current range could signal a bullish move toward the $2,302 resistance level, with a further target at $2,527.
📈 Trading Plan:
✅ Entry: Buy above $1,966 on confirmation of breakout.
🎯 Targets: $2,302 and $2,527 for profit-taking.
❌ Stop Loss: Below $1,909 to manage risk.
📉 Bearish Scenario: If ETH fails to hold $1,909, a retest of $1,824 is possible.
🔥 Ethereum could see a strong rally if momentum builds above resistance! Are you ready?

Ethereum (ETH/USD) - Potential Breakout from RangeEthereum (ETH/USD) - Potential Breakout from Range
Chart Overview:
The price of Ethereum (ETH/USD) has been consolidating within a range after breaking out of a long-term downtrend channel.
A strong support level is identified around $1,852, which has been holding the price steady.
A resistance zone near $2,076 is acting as a short-term barrier for upward movement.
Trading Idea:
If ETH successfully breaks above the range, it may trigger a bullish move towards $2,539 and potentially $2,854.
Entry Strategy: Wait for a confirmed breakout above $2,076 with strong volume.
Stop-Loss: Below $1,852 to minimize risk.
Market Sentiment:
ETH/USD is showing signs of accumulation, and a breakout could signal a new bullish trend.

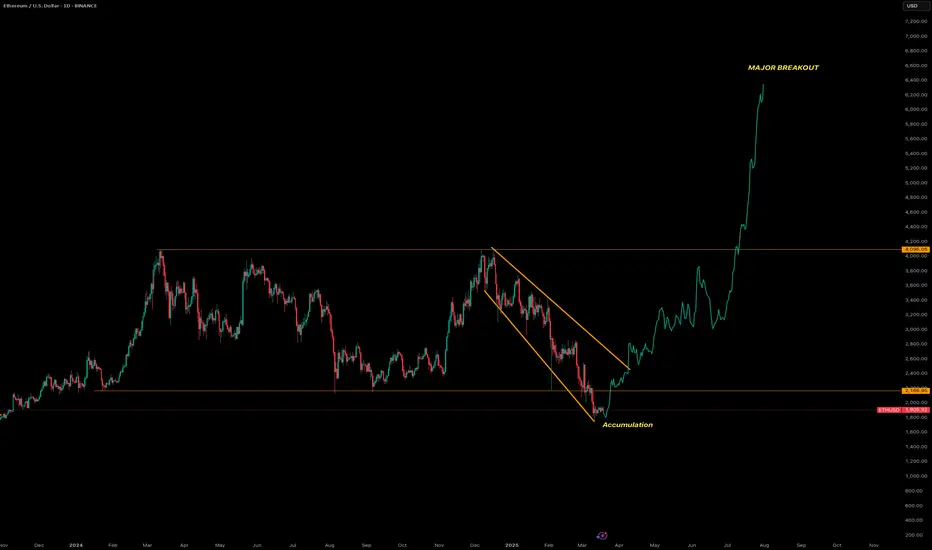
Ethereum will make a major Breakoutanalysis the chart
Let’s analyze the provided Ethereum (ETH/USD) chart on a daily timeframe from TradingView, focusing on the key technical elements and trends:
1. Overall Trend
The chart displays a significant bullish trend for Ethereum, with the price rising from around $2,200 in early 2024 to approximately $4,000 as of the latest data point (March 18, 2025).
The upward movement is marked by a sharp breakout, indicating a strong shift in momentum from consolidation to a rapid ascent.
2. Price Levels and Targets
Current Price: Approximately $4,000, with a previous support/resistance zone around $2,200.
The chart highlights a major breakout above the descending triangle pattern, suggesting potential for further upside, though no specific price target is explicitly labeled beyond the current level.
3. Technical Patterns
Descending Triangle: The chart features a descending triangle pattern, typically considered a bearish continuation pattern. However, the recent price action has broken out upward through the upper resistance line (around $2,200-$2,500), invalidating the bearish outlook and turning it into a bullish reversal signal.
Accumulation Phase: A clear accumulation zone is marked near the lower boundary of the triangle (around $2,200), where the price consolidated before the breakout. This suggests strong buying interest built up at this level, supporting the subsequent rally.
4. Support and Resistance
Support: The $2,200 level, which acted as the lower boundary of the triangle, now serves as a potential support zone if the price pulls back. This level could be retested as new support following the breakout.
Resistance: The next resistance is not explicitly marked, but the rapid upward move suggests the price may face selling pressure around previous highs (e.g., $4,500-$5,000) or psychological levels like $5,000, based on Ethereum’s historical behavior.
5. Volume and Momentum
Volume data isn’t shown, but the steep upward slope post-breakout indicates significant buying pressure and momentum. A breakout with high volume would further confirm the strength of this move.
6. Timeframe and Projection
The chart spans from late 2023 to mid-2025, with the major breakout occurring around early 2025. The sharp rise suggests this bullish momentum could continue in the short to medium term, potentially pushing Ethereum toward new all-time highs (above $4,800, its previous peak).
7. Key Observations
The upward breakout from the descending triangle is a powerful bullish signal, often indicating a reversal of prior bearish pressure and the start of a new uptrend.
The accumulation phase near $2,200 reflects a period where buyers absorbed selling pressure, setting the stage for the breakout.
Potential risks include a pullback to retest the broken resistance (now support) at $2,200-$2,500, or overextension if the rally lacks consolidation. Monitoring for overbought conditions (e.g., via RSI or other indicators) could be prudent.
Wyckoff type 1 accumulation systemWyckoff type 1 accumulation system
We expect the beginning of an upward trend, where any setback within the accumulation scheme will be areas to start making upward positions.

$ETH Mission to $15k in 2025The CRYPTOCAP:ETH chart reeks of market maker meddling—erratic swings and volume surges that defy natural flow. On the macro, I’m targeting the 3.618 Fibonacci, projecting $15.3K (±5%). The fingerprints of an orchestrated push are everywhere, yet the Fibs hold firm. Some might nitpick my 4th wave breaking Elliott Wave rules, but anyone tracking ETH this cycle knows manipulation has been the real driver.
Market makers play a critical role in financial markets, including crypto like CRYPTOCAP:ETH , by providing liquidity and facilitating trades. However, their tactics can sometimes tilt the game in their favor, especially in less-regulated spaces. Here’s a breakdown of common strategies they might use to manipulate price action, potentially aligning with the CRYPTOCAP:ETH chart behavior you’re observing:
Spoofing: Market makers place large buy or sell orders with no intention of filling them, creating fake walls of supply or demand. This tricks retail traders into buying or selling prematurely. On CRYPTOCAP:ETH , you might see sudden order book depth vanish as price approaches key levels, like a Fibonacci retracement, only for it to reverse abruptly.
Wash Trading: They execute rapid buy-sell trades with themselves to inflate volume, signaling artificial momentum. This can lure traders into chasing a “breakout” on CRYPTOCAP:ETH , only for the price to stall—say, short of your 3.618 Fib target around $15.3K—leaving late entrants holding the bag.
Stop Hunting: Market makers often push prices just past common stop-loss zones (e.g., below a support like $2K or above resistance) to trigger liquidations. In CRYPTOCAP:ETH ’s case, a dip below a psychological level followed by a quick recovery could signal this, padding their pockets with liquidated positions.
Momentum Ignition: By placing strategic trades, they kickstart a trend—up toward your $15.3K target, for instance—drawing in FOMO-driven retail. Once the herd piles in, they dump their positions, capping the move before it hits the levels you’re watching.
Order Book Fading: They thin out liquidity at key price points, making it easier for CRYPTOCAP:ETH to swing wildly. If the chart shows low-volume pumps or dumps around strong indicators, then it’s a sign they’re controlling the pace to shake out weak hands before the real move.

Bullish ETH theories I think this could be a possible scenario for ETH's next breakout. I think it's possible because of the ETH ETFs that will most likely gain some traction over time, and retail will have to play "catch up" due to the price consolidation over these past years. The winds will turn, and I think everything will play out quite quickly when it happens.
I also think the FED will announce the end of QT today at the FOMC, which COULD trigger the next ETH bull run.
Looking at the ETH/BTC chart, I think this will trigger the next leg up and complete the pattern when looking at the weekly chart, testing the previous highs.
When I look at ETH relative to SOL/USD, it also looks bullish in the short term. I think this is quite reliable, but we will see over time. Although I think ETH will outperform both BTC and SOL and play catch-up with them both.
Conclusion: I have deployed most of my crypto portfolio to ETH now, believing ETH will give me the most beta in this bull run over the coming months. I know the sentiment looks quite bad at the moment for ETH, but I believe there is a saying: "Buy when others are fearful, sell when everybody is greedy." I think this is quite similar to value investing, and I believe there is a lot of value in BTC, ETH, and SOL.
Good luck! And share your thoughts, I like to discuss things like this. =)

buying@Eth ...Ethereum's correction structure is complete, and this could lead to a strong upward push toward $8,000 or $9,000.
This is just an analysis, not financial advice.
Ethereum (ETH/USD) Breakout – Next Targets $2,328 & Beyond!
Overview:
Ethereum has been in a downtrend, forming a descending channel, but it recently found strong support at $1,764 and has now broken out of a range-bound consolidation. This could be the beginning of a bullish move towards higher resistance levels.
Key Market Structure Analysis:
🔸 Previous Downtrend: ETH was trading within a bearish channel, creating lower highs and lower lows before bottoming out.
🔸 Accumulation Phase: A sideways consolidation range between $1,764 - $2,017 formed after the downtrend, signaling potential accumulation.
🔸 Breakout Confirmation: ETH has broken above the $2,017 resistance, suggesting that buyers are stepping in.
Potential Trade Setup:
✅ Bullish Scenario:
A successful breakout retest around $2,000 - $1,950 could provide an entry opportunity.
Upside targets:
🎯 $2,328.95 – Major resistance level from previous price action.
🎯 $2,559.17 – Next key resistance if momentum continues.
⚠️ Bearish Scenario (Invalidation):
A drop below $1,950 - $1,900 could push ETH back into the previous range.
Losing the $1,764 support could lead to a retest of $1,600 or lower.
Final Thoughts:
Ethereum is showing strength after breaking out of a key consolidation range. If the breakout holds, ETH could be gearing up for a strong rally toward $2,328 - $2,559. However, a retest of the breakout zone may provide a better risk-to-reward entry.
What do you think? Will ETH push toward $2,328 next? Drop your thoughts below! 🔥📈

Swing Trade - Long for market reversal?Watch ETH closely at $1800, this is a good risk to reward trade for the bounce. Stop loss in place in case the golden pocket Fibonacci ratio doesn’t hold. I have this has the final 5th wave correction. I’m also seeing signs of support on the Nasdaq on the 0.382 fib and somewhat of a bounce on the 15 min chart.
Not financial advice, purely for educational purposes.

ETHUSD INTRADAY downtrend continues below 2,171The ETH/USD pair is exhibiting a bearish sentiment, reinforced by the ongoing downtrend. The key trading level to watch is at 2,171, which represents the current intraday swing high and the falling resistance trendline level.
In the short term, an oversold rally from current levels, followed by a bearish rejection at the 2,171 resistance, could lead to a downside move targeting support at 1,872, with further potential declines to 1,770 and 1,670 over a longer timeframe.
On the other hand, a confirmed breakout above the 2,171 resistance level and a daily close above that mark would invalidate the bearish outlook. This scenario could pave the way for a continuation of the rally, aiming to retest the 2,272 resistance, with a potential extension to 2,345 levels.
Conclusion:
Currently, the ETH/USD sentiment remains bearish, with the 2,171 level acting as a pivotal resistance. Traders should watch for either a bearish rejection at this level or a breakout and daily close above it to determine the next directional move. Caution is advised until the price action confirms a clear break or rejection.
This communication is for informational purposes only and should not be viewed as any form of recommendation as to a particular course of action or as investment advice. It is not intended as an offer or solicitation for the purchase or sale of any financial instrument or as an official confirmation of any transaction. Opinions, estimates and assumptions expressed herein are made as of the date of this communication and are subject to change without notice. This communication has been prepared based upon information, including market prices, data and other information, believed to be reliable; however, Trade Nation does not warrant its completeness or accuracy. All market prices and market data contained in or attached to this communication are indicative and subject to change without notice.

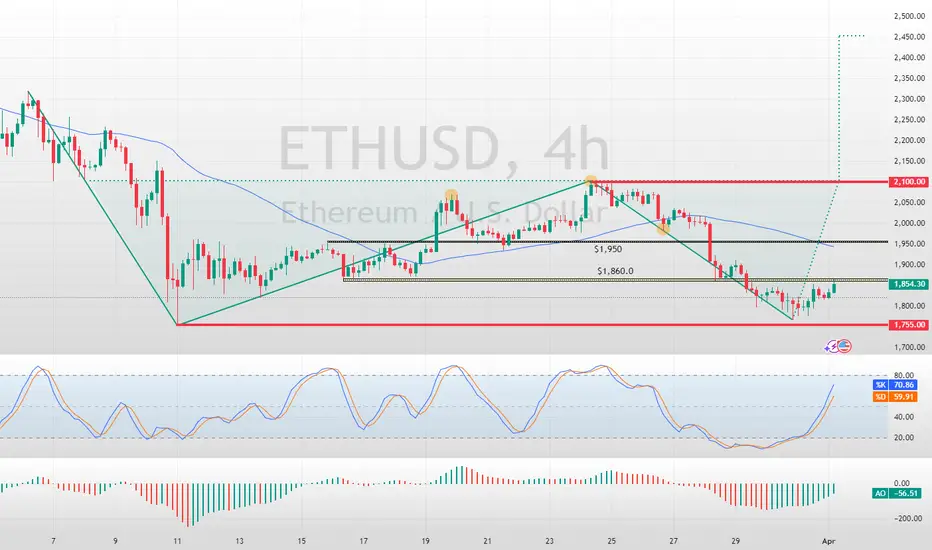
Ethereum Price Rebounds: Key Levels to WatchFenzoFx—Ethereum's downtrend stabilized at $1,755, a key support level. Currently, ETH/USD trades at $1,854, testing resistance.
A double bottom pattern on the 4-hour chart suggests potential growth if bulls secure a close above $1,860. The next target could be $1,950, supported by the 50-period moving average.

day four eth price prediction date: 3/31/2025ethereum is looking like it could be bouncing off of the bottom resistance and could be starting a triangle wave if so we should look for a breakout of those two lines


LONG ON ETHEREUM (ETH/USD)Ethereum has given a change of character (choc) to the upside on the 4 hour timeframe...
followed by a nice sweep of engineered liquidity!
Its currently respecting a key demand are and I believe it will now rise for 300-500 points this week.
I am buying Eth to the next level of resistance.

ETH keep diggging It continues to search for a fair price. And as long as there is no change in sight, we will see lower and lower levels.

ETHUSD SELLSETHUSD is bearish. Price is consistency making LHs & LLs. 1539.00 area will be the next support hit.


