Market Crashing? How to Profit from the Dips?Every time the market crashes, do you feel like it's over?
What if those red candles are exactly what pros are waiting for?
In this post, I’ll show you how fear can become profit.
Hello✌
Spend 3 minutes ⏰ reading this educational material.
🎯 Analytical Insight on Ethereum :
After a strong recent surge, ETH maintains its bullish momentum, backed by solid trading volume and a well-defined upward structure. A crucial daily support zone—aligned with both a Fibonacci area and a rising trendline—continues to hold firm. My primary target is the psychological $3,000 mark, offering around 14% potential upside if the current momentum persists. 🔍
Now , let's dive into the educational section,
💥 Market Psychology: Why Traders Panic in Crashes
When red candles start stacking up, most traders go into “exit” mode. Emotions like fear of losing money, social pressure, and FUD override logic. The average trader sells at the worst possible moment. Why? Because no one taught them that corrections are part of a healthy market. Meanwhile, seasoned players understand that bear markets are not the end — they're prime territory for growth. Fear is not a warning; it's often a signal.
📊 TradingView Tools to Catch Gold in the Red
TradingView is more than just a charting platform — it's a full toolkit for reading the market’s emotional state. One of the most effective tools during dips is the Volume Profile . It reveals where big money is stacking up. When prices fall but volume spikes, it often signals accumulation by whales. Another useful resource is the Fear & Greed Index , which, while external, can be embedded in custom TradingView dashboards to gauge sentiment.
Then there's RSI on lower timeframes , which helps spot oversold conditions and potential reversals. MACD Divergences also offer golden entry signals when paired with price action. And here’s the real kicker: you can use Pine Script to create custom alerts for all these indicators — so you’re not just reacting to fear, you're stalking opportunity.
🧠 Flip the Script: Discount or Danger?
Perspective is everything. If you see dips as danger, your instincts will push you to run. But if you see them as discounts, you’ll start planning your moves. Simple price action tools work wonders here. Look for double bottoms on the 4H, or Pin Bars on strong support zones. But be patient — always wait for confirmation. The real difference between losing and winning traders? One waits. The other guesses.
🛠 Smart Entry Strategies During Bloody Markets
Let’s get practical. If the market has dropped 20%, consider using a DCA (Dollar Cost Averaging) strategy. Break your capital into 3–5 parts and enter at different key support levels. Another strong setup is the Breakout-Retest Entry: wait for a key level to break, then re-enter after a pullback. Stop losses? Use the ATR to calculate realistic SL zones — and yes, you can display this dynamically on TradingView. Alerts, backtests, and auto-calculations make your game clean, not lucky.
🧩 Recap & Final Suggestion
When fear floods the market, the smart see opportunity. With the right mindset and TradingView tools in hand, you can shift from panic-driven reactions to data-driven decisions. Discipline, proper tools, and a fresh perspective — that's your winning trio during a crash. Open your charts, prep your indicators, and get ready to do what the pros do: profit from fear.
always conduct your own research before making investment decisions. That being said, please take note of the disclaimer section at the bottom of each post for further details 📜✅.
Give me some energy !!
✨We invest countless hours researching opportunities and crafting valuable ideas. Your support means the world to us! If you have any questions, feel free to drop them in the comment box.
Cheers, Mad Whale. 🐋
ETHUPUSDT trade ideas

Ethereum Breakdown Ahead? Classic Head & Shoulders Pattern Hello Guys!
Ethereum looks like it’s setting up for a potential drop after forming a textbook Head & Shoulders pattern on the 4H chart.
This pattern (marked clearly with a left shoulder, head, and right shoulder) is often seen before a price reversal. Right now, ETH has already broken below the neckline (around $2,480), confirming the bearish pattern, and is currently retesting that level from below.
📉 What’s Next?
If the pattern plays out, we could see ETH drop toward the projected target zone around $2,200–$2,250, which is highlighted in blue on the chart. This zone also lines up with a previous area of interest and sits near a broken trendline, adding confluence to the setup.
✅ What I see:
Resistance: ~$2,500 (neckline retest)
Target: ~$2,200 support zone
Broken trendline adds downside pressure
Unless bulls reclaim the neckline quickly and push above the right shoulder (~$2,650), this looks like a bearish continuation setup.

ETH - Finally Support!Hello TradingView Family / Fellow Traders. This is Richard, also known as theSignalyst.
📈ETH has been overall bullish trading within the flat rising channels marked in blue.
Moreover, the green zone is a strong support zone!
🏹 Thus, the highlighted blue circle is a strong area to look for buy setups as it is the intersection of support and lower blue trendlines acting as non-horizontal support.
📚 As per my trading style:
As #ETH approaches the blue circle zone, I will be looking for bullish reversal setups (like a double bottom pattern, trendline break , and so on...)
📚 Always follow your trading plan regarding entry, risk management, and trade management.
Good luck!
All Strategies Are Good; If Managed Properly!
~Rich

Ethereum, Guessing The Next Move ($1,500 or $2,000?)The million dollars question; What about Ethereum, lower or recovery?
And this is truly a million dollars question because knowing the answer can make you millions. It can either safe you lots of money or it can make you lots of money.
👉 Ethereum is going lower.
The 18-May low happened at $2,323, and this low wasn't challenged, the drop yesterday ended as a higher low. But, there is something... We lost some important support levels.
ETHUSDT lost the 0.236 Fib. retracement, when this happens, the action tends to move to the next lower-level which is below the 18-May low.
Looking at the 4H TF, ETHUSDT lost EMA55 and MA200, so these are also pointing lower.
Just a few days back I mentioned $2,000 entry LONG opportunity for Ethereum, this price might be possible but it is still really early.
The market has been sideways and this breakdown is new. It would be good to wait for the weekly session close to see what prices we will get, without this information, I can say that it is still too early to say, but I can still make my guess. My guess is that it is going lower.
Thank you for reading.
Namaste.

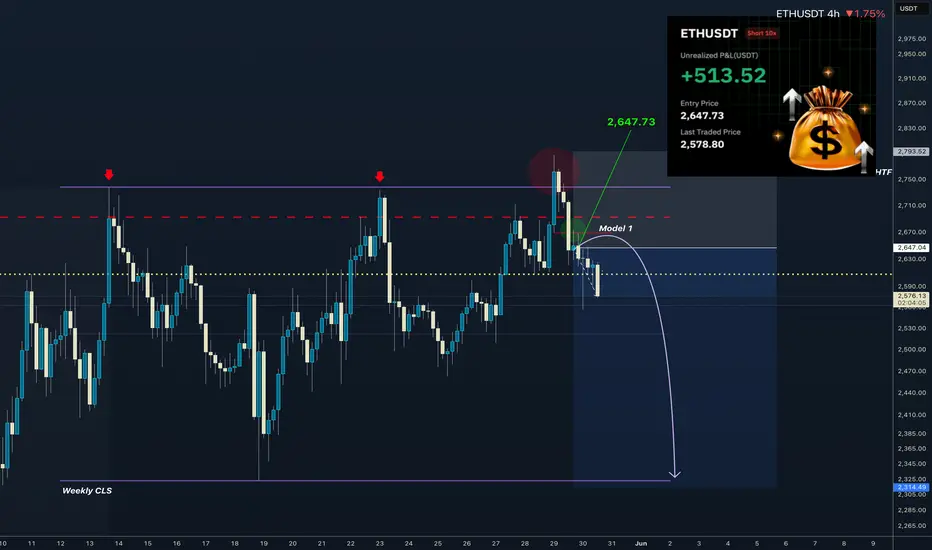
ETHUSD I Weekly CLS I Model 1 I Target CLS LowHey, Market Warriors, here is another outlook on this ETH , Im already in at 2647.73, lets go !!
If you’ve been following me, you already know every setup you see is built around a CLS Footprint, a Key Level, Liquidity and a specific execution model.
If you haven't followed me yet, start now.
My trading system is completely mechanical — designed to remove emotions, opinions, and impulsive decisions. No messy diagonal lines. No random drawings. Just clarity, structure, and execution.
🧩 What is CLS?
CLS is real smart money — the combined power of major investment banks and central banks moving over 6.5 trillion dollars a day. Understanding their operations is key to markets.
✅ Understanding the behavior of CLS allows you to position yourself with the giants during the market manipulations — leading to buying lows and selling highs - cleaner entries, clearer exits, and consistent profits.
📍 Model 1
is right after the manipulation of the CLS candle when CIOD occurs, and we are targeting 50% of the CLS range. H4 CLS ranges supported by HTF go straight to the opposing range.
"Adapt what is useful, reject what is useless, and add what is specifically your own."
— David Perk aka Dave FX Hunter ⚔️
👍 Hit like if you find this analysis helpful, and don't hesitate to comment with your opinions, charts or any questions.
ETHEREUM → Consolidation amid a bull marketBINANCE:ETHUSD is consolidating in the range of 2400-2750, and locally, the coin looks quite promising even against the backdrop of Bitcoin forming a correction...
ETH is forming a strong consolidation within which it confirms a bullish market structure. After a false breakout of resistance, there is no sharp decline and the price returns to retest resistance.
If the bulls hold their defense above 2530-2550, then in the short and medium term, ETH may demonstrate growth towards the intermediate target.
Resistance levels: 2738, 2855
Support levels: 2525, 2470, 2400
A retest of support at 2525 - 2470 is possible, and if the price holds above this support zone, ETH may try to surprise us. There are good chances for growth.
Best regards, R. Linda!

Ethereum: No Sellers, No Bears, No Pressure; Bullish ConfirmedTo put it simple, there is absolutely no selling pressure on ETHUSDT. And this is reasonable, Ethereum is now so cheap that not many people are looking to sell.
Let's dive into this chart and see what we can find.
Spoiler alert: I am no longer bearish on ETHUSDT. "The retrace" simply isn't a thing on this pair. There is no bearish action. Let's read the chart and see what it has to say.
The low 7-April... Ok.
8-May ETHUSDT produced a very strong green candle to break above EMA55 and EMA89. Volume was also high on this date. These levels tend to work as strong resistance and the fact they broke decisively, means that the bullish bias is confirmed and Ethereum isn't likely to move back below again. Whenever there is a drop, these lines will work as support.
The peak soon happened and Ethereum went sideways, it has been sideways in a small phase of consolidation. The lowest point came 18-May. There was a failed attempt by the bears to push prices lower but this ended as a big fail. Ethereum continues strong.
Here we have again EMA55 and EMA89, magenta and blue lines on the chart. These levels remain untested as support which is a signal of strength. While some pairs went down 20%, 30%, 50%, Ethereum's maximum drop has been 14%, now, that's strength.
As seen from the diagram on the chart, we are about to enter the third wave of a bullish impulse. There can be a correction after the third wave ends followed by additional growth.
The break of EMA55/89 as resistance confirms that Ethereum is bullish mid- to long-term. This means 3-6 months of growth.
Once MA200 is broken as resistance, we have at least six months of bullish growth confirmed, this will happen later this month.
No bears means the bulls are in control.
A very small retrace means buyers are strong.
It all makes sense, who would be willing to sell their Ether when there is so much room left for prices to grow?
No one, that is why prices remain strong.
Adapt to market conditions fast and live.
Some pairs are going down while others are going up.
Some pairs are sideways; some are growing strong.
This is the early stage of the 2025 bull-market, just wait and watch... Just watch! It will get wild faster than you think and it will become so wild that you won't be able to handle the market at all. Everything will become so good, so fast, that you will feel blessed for deciding to enter the Cryptocurrency market during April's low.
It is still early though, remember, $7,000 is the minimum price for Ethereum in late 2025. $11,000 is also possible.
Thanks a lot for your continued support.
Namaste.

ETH/USDT – Breakout Brewing?Ethereum is currently consolidating within a bullish ascending triangle on the 4H chart. The price is coiling just below the key resistance, so a breakout could ignite the next leg up.
RSI hovering near 50 shows room for momentum buildup.
Setup Analysis:
Structure: Bullish ascending triangle
Momentum: Healthy consolidation after strong rally
RSI: Mid-range, potential to climb
Key Levels:
Resistance: $2,849
Support: $2,430 | $2,243
Breakout Target: ~$3,200 and possibly $3,420 if momentum sustains
Entry (Breakout Play):
Above $2,850 on strong volume
Target Zones:
$3,200, $3,420
Longer-term: $4,050
Stop-loss:
Below $2,430 (pattern invalidated)
Watch closely — breakout confirmation could present a solid bullish opportunity.
This is not financial advice, please do your research before investing, as we are not responsible for any of your losses or profits.
Please like, share, and comment on this idea if you liked it.
#Ethereum #ETH #CryptoTrading #TechnicalAnalysis #Altcoins #Breakout #ETHUSDT #BullishSetup

ETH/USDT – Short-Term Bearish SetupETH/USDT – Short-Term Bearish Setup
Ethereum is struggling to break through resistance and showing signs of exhaustion.
I'm watching a short opportunity with a near-term target at $2,575.
🧠 Clean structure – potential pullback on the table.
📉 Let’s see if the bears take control. Follow for live setups & smart trades.

ETH/USD long | 15m intradaytaking a long from this area for a short term day trade. Price is losing bearish momentum near 2480 in an inverse head and shoulders pattern (15m) and diverging on the RSI. I believe we retest 2550

ETH Ascending TriangleETH has formed a clear ascending triangle pattern with a possibility of imminently breaking out to the upside. If rejected, we could see a breakdown to the ~2,300 support and subsequent rebound.
My bias is still bullish. We'll let the market tell us what happens and respond accordingly. Worst case scenario is more boring consolidation.
Stay patient.
Happy trading,
Melonfarmer

ETH/USDT 1DAY CHART UPDATE !!ETH has broken out of a long-term downtrend (black diagonal trendline) and is now in a consolidation phase below the $2,800–$2,850 resistance.
The price is currently $2,612, showing hesitation below the key horizontal resistance.
Resistance Zones:
$2,800–$2,850: Key horizontal resistance. Breaking above this confirms bullish continuation.
$3,200 and $3,600: Medium to long-term bullish targets.
Support Zones:
$2,000–$2,200: Strong horizontal support + ascending trendline + 50 EMA (red line)
$1,410: Key long-term support (unlikely to be tested soon unless the market reverses)
ETH breaks and closes above $2,850 ➝ $3,200 → $3,600 → $3,800+ likely to rise
The structure suggests that a higher low will likely form before the breakout.
If ETH rejects at $2,850, expect a retest of $2,000–$2,200 (golden zone)
This would create a bullish higher low setup and could be a strong buy-dip opportunity.
Thanks for your support!
DYOR. NFA

ETH update 9.06.2025Hello everyone, many of you asked me to publish my vision for ETH.
Here you go!
I believe that the previous impulse movement was only the first upward movement, and now we are in a sideways correction movement — call it what you will, but the fact is that the exit from this flat will be upward.
1. End of the year
2. ETH is accumulating on the Onchain
3. Liquidity overflow from BTC can be seen on the ETHBTC chart, and the overflow began at the very bottom
4. What else can large conservative players accumulate?
5. We are going after liquidity from above and should break 4100 by September
Best Regards EXCAVO

ETH/USDT – Quick Long OpportunityETH/USDT – Quick Long Opportunity
Ethereum is showing bullish momentum from support.
Looking for a short-term long setup with a target at $2,509.
📈 Clean structure, tight risk — watching for a push toward resistance.
🚀 Follow for real-time trade setups, no fluff — just sharp charts!

Ethereum vs SolanaIn 2025, the competition between Ethereum and Solana is no longer just a rivalry — it’s a pivotal chapter in blockchain evolution.
We are witnessing a clash of two philosophies:
Ethereum — maturity, security, and deep ecosystem
vs.
Solana — speed, efficiency, and adaptability.
📈 Price Resilience vs. Market Legacy
While Ethereum still holds the crown in market cap and institutional trust, Solana is rewriting the rules with superior transaction speed and cost-effectiveness.
The question is no longer "Who is better?"
It’s "Who is evolving faster?"
⚡ Key Drivers Shaping the Ethereum-Solana Rivalry
1️⃣ Scalability vs. Stability
Solana leads with up to 65,000 TPS, attracting high-frequency traders, NFT creators, and DeFi innovators.
Ethereum, relying on its Layer-2 solutions, tries to balance security with scalability.
2️⃣ Institutional Shifts
Funds like Galaxy Digital and Ark Invest are reallocating capital towards Solana, betting on efficiency and growth.
Ethereum, meanwhile, is waiting on ETF approvals to regain momentum.
3️⃣ Technological Innovation
Ethereum focuses on sharding and Layer-2 expansion.
Solana pushes aggressive ecosystem growth but pays the price with occasional network instability.
📊 Market Performance Snapshot — 2025
Ethereum: ▼ 56% YTD | ~$1,600
Solana: ▼ 40% YTD | ~$135
Solana’s DEX market share jumped to 39.6% in Q1, driven by meme coins and retail traders.
Ethereum’s dominance continues to erode under macro pressures and rising competition.
But don’t be fooled — Ethereum's foundation remains strong. Institutional adoption and infrastructure upgrades still offer potential for a rebound.
📉 ETH/BTC Looks Like a Meme
ETH/BTC:
SOL/BTC: Potential -50% in next 160 weeks ➡️
ETH/SOL:
⚡ Where Did the Liquidity Go?
The real question isn’t why ETH is dropping —
It’s why no one cares.
Layer 2 solutions — Arbitrum, Optimism, Base — have drained liquidity from Ethereum’s mainnet.
DeFi activity? → Migrated to L2
Users? → Choosing lower fees and speed
Ethereum L1? → A blockchain for whales and archives
No liquidity = No rally
No narrative = No attention
Funds are betting on Solana and L2, not Ethereum’s base layer.
🎯 When Could ETH Take Off?
Only if we see:
A strong “Liquidity Returns to L1” narrative (RWA could be a trigger)
Spot ETH ETFs launching with institutional accumulation
A new DeFi wave on L1 (unlikely with current gas fees)
Or simply — when the market decides to pump forgotten assets
For now, Ethereum is about patience.
Smart money is flowing into L2, Solana, and high-risk narratives.
🕒 But Time Will Tell...
Today, we debate ETH vs. SOL.
Tomorrow — the bull market ends, and we’ll be discussing entirely different narratives.
Are you SOL or ETH?
As always, stay one step ahead.
Best regards,
EXCAVO
______________________________
Disclosure: I am part of Trade Nation's Influencer program and receive a monthly fee for using their TradingView charts in my analysis.

Eth long to $2575Eth long
tp: $2575
Stop: $2492.95 or lower
Roughly 2.5R .. Can use tighter stop if desire to get up RR to 3.
Anticipating smooth push to upside soon. More of a sclap
Time sensitive

ETH/USDT – Short-Term Bearish SetupETH/USDT – Short-Term Bearish Setup
Ethereum is losing momentum near resistance and showing signs of weakness.
I’m entering a short position, targeting $2,481 in the near term.
🔻 Clean structure, strong rejection – watching for continuation.
📉 Follow for more high-conviction setups and sharp entries!

ETH NEW UPDATE (4H)This analysis is an update of the analysis you see in the "Related publications" section
Inside the red zone from the previous analysis, there was also a SWAP zone that price reacted to. The pullback trendline has also been broken. After re-evaluating the chart, the best area for a potential re-entry is the $2,165 to $2,250 range.
Do not enter a position without a proper setup and risk management | you could easily become market maker bait.
A daily candle close above the invalidation level would invalidate this bearish scenario.
For risk management, please don't forget stop loss and capital management
Comment if you have any questions
Thank You

ETH is testing its resistance ETH may reject from its resistance line as ETH is showing weakness at around $2550 mark level, lets see and if it does it may go down to $2200 level. #ETH #BTC #crypto

Ethereum Prediction update 7% PUMP and Targets HIT! Whats Next?Ethereum hit both of our targets, and pumped by 8% without any leverage!! What is going to happen next?

ETHUSDT - Rare Flat Range + Potential Wyckoff SpringUnusually flat range – ETH has spent -30 days- oscillating between ≈ $2 470 (support) and $2 780 (resistance). Tight “boxes” of this length are uncommon in crypto and often precede explosive moves.
Spring attempt – Price just dipped below the range low on elevated volume. If it snaps back inside, Wyckoff theory calls this a Spring (Phase C of Accumulation).
Liquidity grab – The wick beneath support flushed late longs & triggered stops, handing larger players cheap inventory—classic shake-out behavior.
Confirmation Criteria
Volume Reclaim on high buy volume
Retest Behavior Low-volume retest into $2,470 = healthy
Structure 1H higher low (HL) during reclaim
Sentiment Perps short-heavy = fuel for squeeze

Ethereum (ETH/USDT) Breakout Watch ! Hello traders here is KingPro's analysis on Ethereum
📈ETH is at the critical resistance level strong closing above it could tiger a bullish move.
Current Price: $2,628
EMA 70 Support: Price is holding above the 70-period EMA ($2,577), showing bullish structure.
Support Zone: The area around $2,320–$2,400 is acting as a strong historical support, confirmed multiple times.
Supply Zone: Consolidation occurred near $2,570–$2,620, but price has broken above it — indicating accumulation.
Critical Resistance Area: Around $2,780–$2,800. This is a key level — a breakout above could lead to strong bullish continuation.
Next Target: $2,782.93 – price may retest this resistance as indicated by the projection arrow.
📊 Trade Idea:
If ETH sustains above $2,620 and breaks the short-term channel resistance, a move toward $2,782+ is likely.
🔒 Risk: A breakdown below the EMA or the supply zone (~$2,570) could invalidate the setup.

$ETH - New ATH This Year! But it takes time (as usual)I tend to believe the patience pays off
A sharp growth of almost X2 earlier this year granted #Ethereum an opportunity to take hold above major support levels and CRYPTOCAP:ETH gladly took this chance. Now the price is staying above the $2100 - $2400 support zone.
If you are looking for a safe way to X2 your capital this year, you should definitely consider buying Ethereum in this price range.
In fact, there are two possible options of further price movements:
Orange path (~33%) : light touch of the support zone, followed by a sharp pump upwards towards the $3200 resistance by the month of August 2025. Then some consolidation there and continuation with the coming of Autumn (traditionally bullish season for crypto) .
Red path (~66%) : a full-fledged dive in the support zone, down to $2150 (shadows can even reach $1950ish zone) . It will take more time, but allow people to build more proper positions, if they have not done so already. This dive can also help in gathering liquidity (from liquidating early LONGs with high leverage, everything with lev. higher than x6 will be washed down) that will later be used for pushing the price higher .
As you could understand, I'd prefer the second option , but those who know Ethereum erratic behaviour they just... know. I will start accumulating CRYPTOCAP:ETH once it reaches $2450 and will continue doing it down to $2100 using x5 leverage (if such price will ever be achieved) .
Target is $4500 - $5000. Being realistic here.
