ETH/USDT : Gearing Up for a Major Breakout? (READ)By analyzing the Ethereum chart on the weekly timeframe, we can see that the price has started rising just as expected and is now approaching the first target. For now, ETH faces major resistance in the $2,600–$2,900 zone.
If price breaks above this key area, I expect a strong bullish move from Ethereum!
Based on the main analysis, the short-term targets are $2,700 and $2,890, while the mid-term targets are $3,100 and $4,100.
Please support me with your likes and comments to motivate me to share more analysis with you and share your opinion about the possible trend of this chart with me !
Best Regards , Arman Shaban
ETHUPUSDT trade ideas

Lingrid | ETHUSDT Price Compression and Expansion PhasesBINANCE:ETHUSDT is struggling to hold gains after a rejection from the top of the range, with price retracing back toward the breakout point and key trendline support. The structure remains intact above 2,363, where bulls may attempt another rebound. A sustained move above the blue ascending trendline would open the way toward the 2,650 target, completing the projected rebound path.
📈 Key Levels
Buy zone: 2,363–2,400
Sell trigger: breakdown below 2,363
Target: 2,650
Buy trigger: breakout and retest of 2,475–2,500 with volume
💡 Risks
Failure to hold the trendline could push price toward 2,159
Weak follow-through may stall near 2,550
Bearish engulfing from current range top can trap early buyers
If this idea resonates with you or you have your own opinion, traders, hit the comments. I’m excited to read your thoughts!

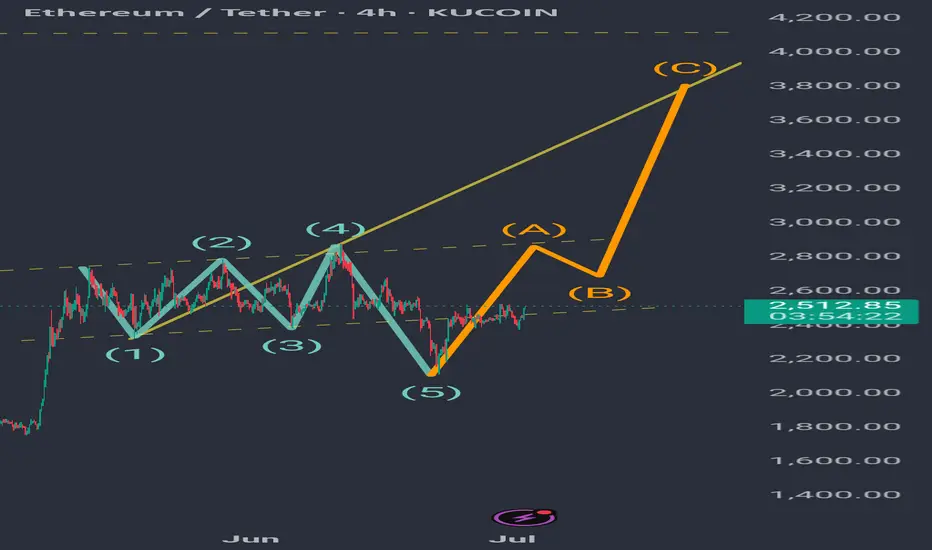
A probability: Bullish Wolve Wave on ethEth hit a low near $1,400 in early April and from there charted a sharp rise, doubling its price. Around $2,800, it clearly encountered resistance corresponding to the 0.5 Fibonacci of the previous downward movement. From that point, it moved sideways in a range whose downward breakout reached the 0.5 Fibonacci of the current upward movement, $2,113, where it found strong support and has returned to the range. So far, this appears to be forming a bullish Wolve wave, whose target would be reached at the yellow line, which is the projection of waves 1 and 4 connecting. If Eth manages to break through the range and consolidate above it, it is very likely to achieve that target.
ETHUSDT SWING TRADE SetupWait for the entry and must use sl, if sl hits then wait for candle closure, candle managed to close above the SL, still there is lot of supply zone for eth till 2.7k, So fakeout also possible. I will comment the update, SO closely follow me.
ETH 30min: Bearish Triangle Forming After RSI Divergencehelo guys
Ethereum is currently trading within a clear range, and recently formed a bearish triangle pattern near the top of the consolidation. A visible RSI divergence confirmed the loss of bullish momentum as price made a higher high, but RSI printed a lower high — a common sign of exhaustion.
Now, ETH is moving downward within the triangle, and pressure is building near the lower edge of the range. If the pattern breaks down as expected, the next likely move is a drop toward the support zone around $2,370–2,380, which marks the bottom of the range.
This setup shows a typical structure:
Divergence → Triangle → Breakdown toward range low
Unless price reclaims the triangle top quickly, bears have the upper hand in the short term.

ETH ANALYSIS🔮 #ETH Analysis 🚀🚀
💲💲 #ETH is trading between support and resistance area. There is a potential rejection again from its resistance zone and pullback from support zone. If #ETH closes above 2500$ then we would see a bullish move
💸Current Price -- $2,462
⁉️ What to do?
- We have marked crucial levels in the chart . We can trade according to the chart and make some profits. 🚀💸
#ETH #Cryptocurrency #DYOR

Ethereum (ETH): Good Start, Seeing Buyside DominanceEthereum has done well, where we have established a proper support area near the local buy zone, which should be enough for us to have a proper bounce from here towards our target of $2800.
As long as buyers keep the dominance near the buy area, we are bullish!
Swallow Academy


ETH needs support now. ETH is holding up by a thread. There are signs of weakness in the market, and if the Ethereum price breaks below support, it is likely we will see follow-through.
Full TA: Link in the BIO
Q3 Could Be Big for #ETH, Breakout Watch ON#ETH bounced exactly from the 0.5 level of Fib Retracement, as expected.
Now it appears to be gearing up for its next breakout move!
After weeks of chopping inside a falling channel, ETH is showing signs of strength. It's reclaiming key levels and slowly pushing toward the breakout zone near $2,520.
A breakout above this resistance could trigger a sharp move toward $2,880 and beyond.
However, bulls need to hold the $2,300 zone, a drop below might delay the pump.
Structure is bullish, just needs confirmation.
IMO, Q3 could be massive for ETH.
Like & retweet for more updates.
#Ethereum

Ethereum (ETH): Hovering Near EMAs | Might Be Good Buying SpotEthereum is still hovering near local lines of EMAs, where we are expecting to see a volatile breakout very soon.
Now we have 2 buy entries, where the best option is after breaking the local resistance area, which is above the EMAs but overall, with the current buyside dominance we have had, we are seeing good chances for the price to reclaim the $2800 within days from here on.
Swallow Academy

HolderStat┆ETHUSD fixed above the supportBINANCE:ETHUSDT broke out from a triangle and is holding above the 2,447 zone. The current ascending structure targets 2,700 in the near term. Reclaiming short-term resistances confirms a bullish reversal from recent lows, similar to past triangle breakouts.

ETH | H12 Supply Rejection & Demand Bounce PlanSELL ZONE $2,520–2,560
→ Short from supply, rejection expected
Triple tap + SFP = short trigger
↓
EQ LOWS $2,380–2,400
→ TP1 / watch for bounce
↓
BUY ZONE $2,280–2,320
→ Main long zone, enter on confirmation (bullish candle/SFP)
STOP below $2,250 = cancel idea
↑
TP1 $2,500
TP2 $2,900–3,000 (if strong bounce)
Main scenario — short from supply zone, target demand at $2,280–2,320. Long only if bounce is strong. Stop below $2,250. No confirmation — no trade.


FRD/FGDFRD happen when there is a red day after 2 or more breaks of daily high to the up side. after the trigger to the downside, it will be highly likely to continue to breakdown

false break set upafter 2 higher highs or more has been made then a day trades above the previous day's high but close back inside the range, it is D1. after the break of previous day low, it is high probable that it will continue the reversal

3 days of breakoutafter three days of break out and a break of daily level to the opposite side. it high probable that it will continue the break

doing the homeworktesting 3days of breakout, frd,fgd, day one false break with the break of daily level as trigger to start to build position. for entry . buy if it dip below daily vwap during the sessions. stop is above the high or the low of the signal day. targeting the second push. for inside day, trying to capture the false break back to the other side or daily high or low 90% winrate. let see when I apply it in real time

ethusdt no trade zoneETH is stuck in a range, wait for the sweep of range high, then closing below the range high and take the short, target weekly low. 2nd scenario is wait for to take out the weekly low and any daily candle closing failed to close below this level take the long entry and target the range high. Otherwise expecting this week choppy mean sideways. no major move. Will update if found any good trade.

Weekly trading plan for EthereumBINANCE:ETHUSDT Last week, price mostly traded in a range. For this week, I've updated key levels, marked them on the chart, and modeled several scenarios. We can expect a pullback—possibly a deeper correction—before another push toward resistance levels. If price breaks the local low but then reclaims the weekly pivot point, I'll consider opening long positions without waiting for a deeper pullback.
Write a comment with your coins & hit the like button and I will make an analysis for you
The author's opinion may differ from yours,
Consider your risks.
Wish you successful trades ! mura

ETHUSDT WEEKLY UPDATE — PART 1
When Conviction Fails: Apex Rejection, Hidden Redistribution, and the Illusion of Demand
Good morning, good afternoon, good evening, wherever you're tapping in from. Now, as always, I’m not here to waste your time with unnecessary waffle. Let’s get straight into it and unpack this mess step-by-step.
THE APEX REJECTION | MORE THAN JUST A WICK
So picking up from last week's update, we find ourselves right at the crossroads, and not the romantic kind either. What we’re looking at right now so far, is a clean yet 100% conclusive rejection from the apex of a key macro structure.
This isn’t just any level. This is the intersection of vertical momentum and horizontal memory, the apex of a triangle that’s been forming for months. This is where bullish intent was supposed to hold, supposed to assert dominance, but instead, what did we get? A strong push into resistance, a failure to fix above it, followed by exhaustion and signs of institutional unloading.
Now, to the untrained eye, this may look like a pullback, or even a healthy correction. But we’re not here to look at charts with retail goggles. We’re here to track the true intent behind the price action, and if you know your schematics, this is screaming redistribution. And not just any redistribution, the kind that happens right before the market changes its personality.
WHERE ARE WE IN THE SCHEMATIC?
If we overlay Wyckoff logic on top of this structure, it's very clear:
We’ve had our PSY (preliminary support).
Followed by a spring, a shakeout, and a fake rally.
Now we’re dancing around what appears to be the UTAD (upthrust after distribution) — but weaker.
This isn’t classic distribution, it’s redistribution masked in macro confusion.
Here’s the thing this range isn’t just price consolidation, it’s behavioural conditioning. This long, choppy sideways movement is designed to wear out both bulls and bears, making them question their bias, mismanage their risk, and either overstay or exit too early.
The market is methodical, not random. These candles aren’t accidents, they are footprints of algorithmic trap setting, and right now, it looks like the net is about to close.
VOLUME TELLS THE TRUTH
Let’s not forget volume. Look at the weekly volume through this recent push:
Decreasing volume on the rallies,
Higher volume on the red closes,
And multiple spikes that failed to carry price past resistance.
That’s your dead giveaway. You don’t need to be a wizard, just follow the clues. Price is being pushed, not lifted. Demand isn’t stepping in, liquidity is being removed. This isn’t smart money accumulation, if confirmed by the endd of this week, this most recent move up cout be doing of smart money unloading, Quietly and Efficiently.
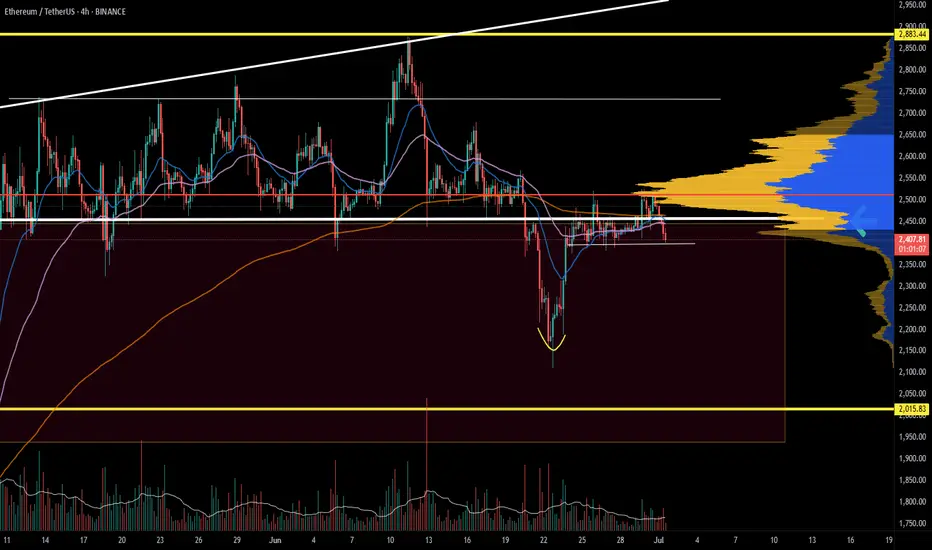
THE MARKDOWN IS PRIMED
Let’s now address the elephant in the room, the range low and point C of the triangle on the 4H.
T hat’s where liquidity is sitting.
That’s where the market’s next objective lies.
We’ve now failed to reclaim the apex, the wick was slapped down, and unless something significant shifts, the next logical move is to sweep that C point, take out the emotional support, and either:
Tap into true demand (if it exists), or
Begin the cascade toward the final green demand zones between 2,150–2,070, which we marked weeks ago.
And don’t forget, this sweep may not be clean. We could get a fakeout bounce mid-range — enough to bait in more longs, only to roll over again.
PSYCHOLOGICAL LAYER
What’s happening here isn’t just technical, it’s emotional warfare. This entire range has been one long gaslight for the average trader. Between the failed breakouts, failed breakdowns, and chaotic intraday behaviour, retail has been turned into liquidity.
And if you’re still trying to long blindly at the top of this, hoping for 3k ETH without a confirmed structure reclaim, then respectfully, you’re the product right now.
Coming next in Part 2:
A full breakdown of the 4H macro setup
Analysis of the internal range mechanics
Recalculated fib zones
Where the liquidity pockets are
What the most probable path is short, medium, and long-term
Stay tuned — I’ll keep the flow coherent, structured, and aggressive. No fluff. No hopium. Just structure, psychology, and execution.

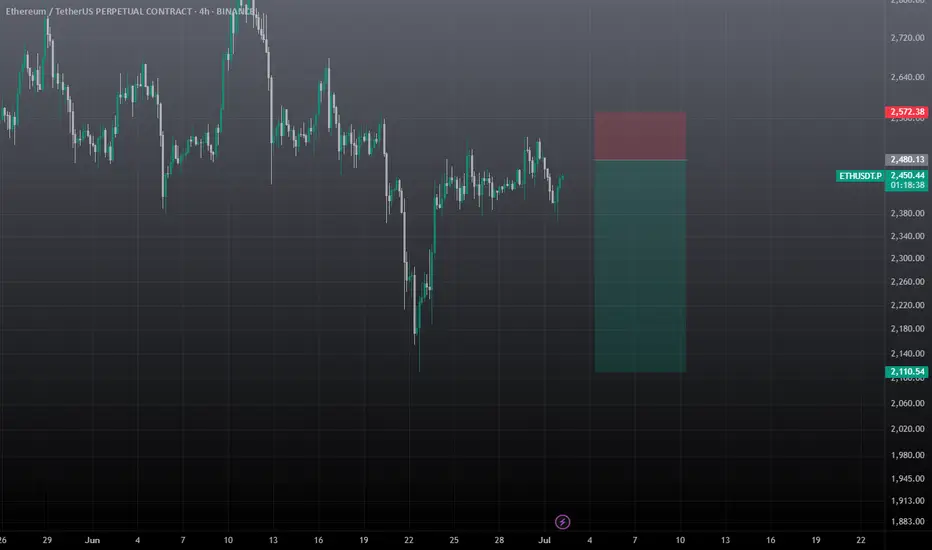
Ethereum Leveling Map — ETH/USDT 1DNo directional bias for Ethereum, but will use levels to spot entries for intraday.
Right now located at POC and seems balanced for both sides.
Potential Adam&Eve setup in development.
Quality levels for support $2150, 2000, 1800, 1500.
Resistances $2700, 3000, 3500, 4000
Keep in mind it will follow BTC price action by most of time.
Happy trading
