Ethereum ETH price analysis💰 The price of CRYPTOCAP:ETH tested the strength of the bottom support and failed to consolidate above it.
This means that there will be another correction wave
🔥 Considering that #ETHETF is steadily "bying" every day, it would be a good idea for us/you to buy OKX:ETHUSDT in the range of $1850-1975 for investment portfolio before further growth.
👌 And you can also place a “bucket” with a pending order to buy #Ethereum at $1700, and maybe they will even "draw fall" the price at the moment to break all stops.
_____________________
Did you like our analysis? Leave a comment, like, and follow to get more
ETHUPUSDT trade ideas

HolderStat┆ETHUSD formed the rising bottomBINANCE:ETHUSDT on the 16h chart is pressing upward inside a steep channel after reclaiming $2,300. Momentum is driving the price toward $2,800 and possibly $3,400. Previous breakouts from consolidation zones support the bullish bias.

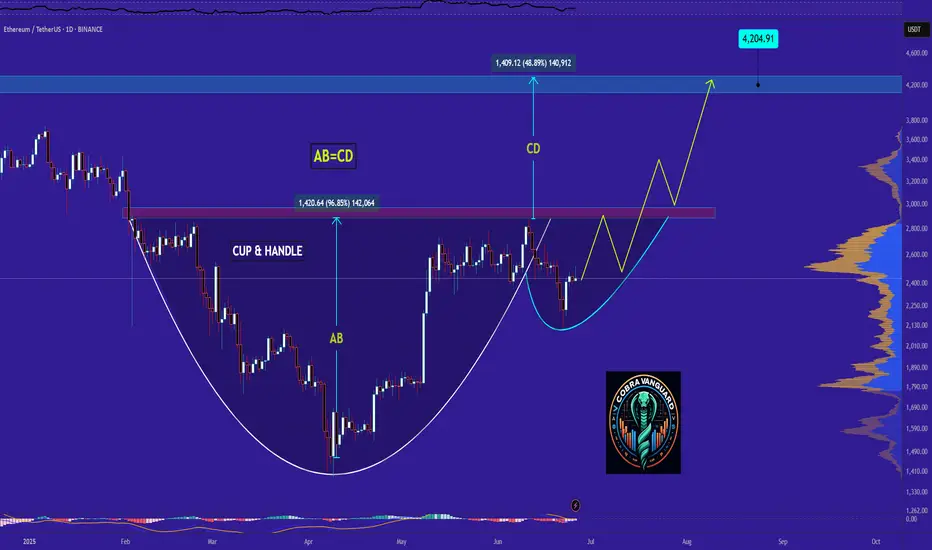
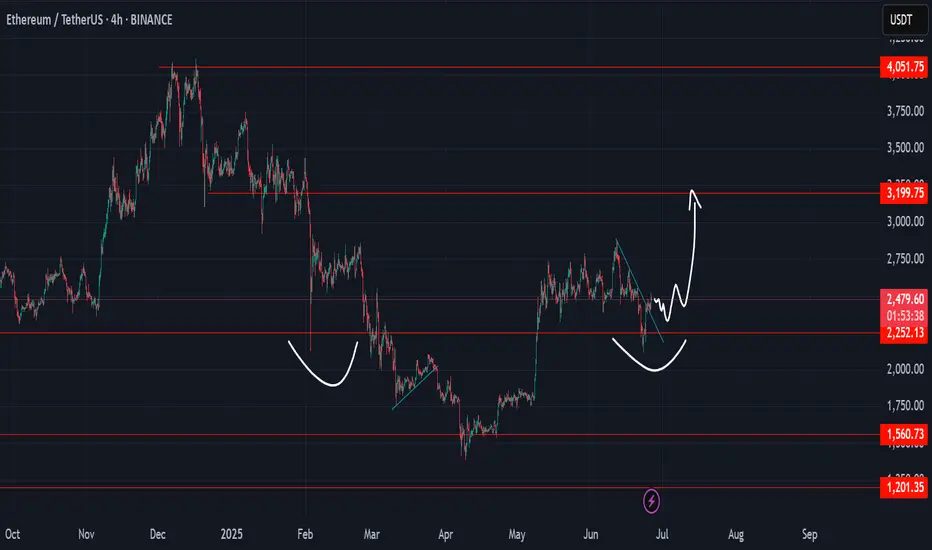
ETH It will grow soon...It can be said that the price has formed a cup and handle pattern, which it is completing soon. If the price follows this pattern, it can be expected that Ethereum will reach its peak again.
Best regards CobraVanguard.💚
Ethereum big chance for BIG drop#ETH Price is at key resitance. POC of the entire range.
In a case of big sell volume price can continue dropping toward $2000 area
I wait for confirmation to take a trade


ETHUSD📊 ETH/USD 4H Trade Setup For Long
🔍 Watching an Inverse Head & Shoulders 🫱🫳👤
🔼 Entry: At Fib levels or marked zone
🛡️ Stop Loss: Below support / right shoulder
⏳ Time to Move: ~4 to 5 days from Support ➡️ Resistance
🚪 Tried to break major resistance 4 times
🌍 Geopolitical tensions 🌐 caused pullback
⚡ Now, resistance is weakening —
💥 Breakout likely
🎯 High Risk:Reward setup
📈 Get ready for the move!


ETHUSDT Short Setup from Local Resistance and Rising ChannelETHUSDT has reached a key local resistance zone at $2,562.00, which aligns with the upper boundary of a rising channel. This area has historically acted as dynamic resistance, and price action is showing signs of stalling after a strong upward move.
A short position is taken at $2,562.00, anticipating a move down to the lower channel support near $2,337.16.
This setup leverages both horizontal and diagonal resistance, ideal for traders looking for a mean reversion setup within a rising structure.
🧩 Trade Parameters :
- Entry: $2,562.00
- Stop Loss: $2,636.73
- Take Profit: $2,337.16
🔢 Risk:Reward Calculation:
- Risk: 2,636.73 - 2,562.00 = $74.73
- Reward: 2,562.00 - 2,337.16 = $224.84
- Risk:Reward Ratio: 1 : 3.01 ✅ (Very favorable)
✅ Bias:
- Bearish rejection from channel top and prior resistance
🔄 Confirmation:
- Look for rejection wicks, bearish engulfing patterns, or a break of lower timeframe support levels
❌ Invalidation:
- Strong breakout and hold above $2,636.73
This is a high-RR short setup with clear structure and invalidation — well-suited for traders aiming for precision entries on rejection zones.

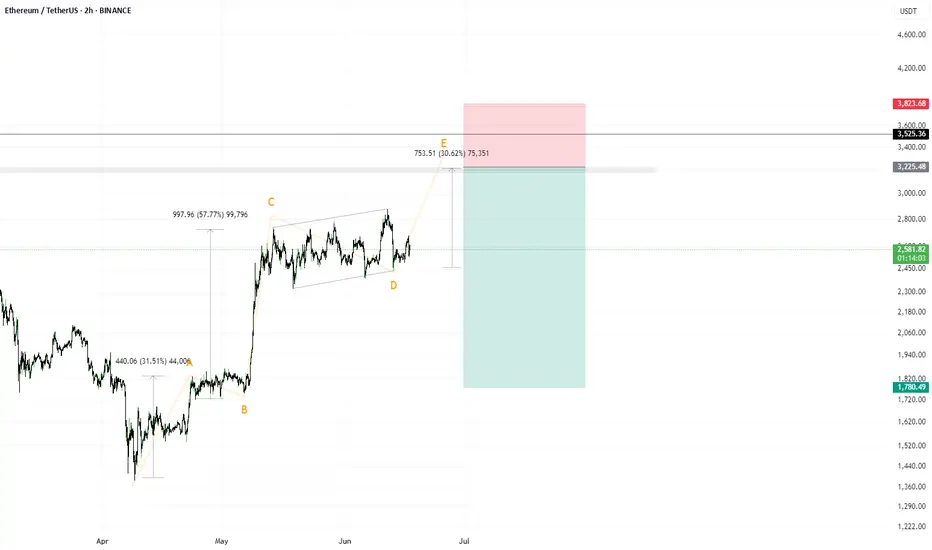
Short idea on $ETHJudging by the structure, if the vector is correctly identified, then on the ETH instrument, a rise to 3400–3600 remains relevant until the first serious correction (this idea would be invalidated in that case).
As for the potential trade — a breakout of the local highs amid global chaos and during the formation of wave 4 of a 5-wave structure. Typically, during the formation of wave 4, there is more media involvement, more noise, and panic.
I’m observing and planning to enter this trade.
Do not follow my vision blindly, as it could be detrimental to you.
Important midweek ETH update.In just four days, ETH has impressively climbed 19.37%, achieving a substantial trading volume of 34.9 million, indicative of both renewed interest and heightened speculative activity. This sharp move follows two intensely impulsive trading days that thrust price upwards aggressively, followed immediately by two days of intermittent volatility and macro consolidation—perfectly manifesting the anticipated Bart Simpson pattern previously identified and traded with clinical precision.
Our initial boundary of the macro distribution zone at 2470 marked a critical juncture. ETH faced vehement rejection here, forming a violent wick as price sharply retraced, providing us with the ideal entry for our hedge short. This level—keenly highlighted in prior analyses—initiated a cascade of rapid selling pressure, driving price down with impressive velocity and ferocity directly into the pre-established supply zone. This pullback validated our short, subsequently propelling price downward into demand territory at approximately 2380, where immediate liquidity absorption occurred, confirming demand strength.
Notably, ETH’s rapid recovery during the early Asian session surged back towards the optimal trade entry (OTE) region of the redistribution zone, affirming both market efficiency and the dynamic liquidity interplay present. This cyclical behavior reinforces the significance of clearly defined supply and demand zones, which have acted as robust reference points throughout this trading period.
At this juncture, ETH finds itself at a critical crossroad—a profound decision point characterized by considerable uncertainty. Three distinct scenarios now dominate trader psychology and technical rationale:
Liquidity Hunt Scenario: ETH could swiftly retrace to retest the mean, specifically targeting liquidity pools located near the spring wick from the latest impulse. Such a move would serve to shake out weak longs and solidify the market structure before another upward thrust.
Continuation Scenario: A bullish advance could propel ETH towards testing the upper boundary of the overarching macro symmetrical triangle, aligning with continued momentum and suggesting further bullish intent supported by current oscillatory readings.
Worst-Case Scenario (LL Scenario): The alternative, more extreme scenario involves ETH breaching structural integrity, aggressively flushing out late entrants with a sharp lower low (LL). While perceived as unlikely given recent volume and market resilience, this outcome cannot be discounted—particularly given global macroeconomic uncertainty and geopolitical tensions.
Several exogenous factors compound this uncertainty, most notably ongoing international conflicts and recent market sensitivities tied to off-the-cuff comments from influential figures such as former President Donald Trump. These events amplify volatility potential, exerting tangible influence upon investor sentiment and market positioning.
Analyzing the market structurally, ETH price action is now interacting directly at the apex of the current triangle structure, precisely aligning with the 50% Fibonacci retracement of the recent range—a pivotal area frequently respected by both algorithmic and discretionary traders. Complementing this technical view, oscillators such as the Relative Strength Index (RSI) currently hold a neutral stance at exactly 50%, highlighting equilibrium in buying and selling pressure and reinforcing the indecisive nature of the current market environment.
However, adding weight to bullish sentiment in the near term, the Commodity Channel Index (CCI) presently indicates upward momentum, suggesting possible further upside if sustained during today's London and subsequent New York sessions. Consequently, immediate trading decisions should remain sensitive to intraday price behavior around these critical junctures.
If you've closely tracked my analyses—especially the detailed insights shared in the recent macro Bart Simpson formation update—you'll likely have secured the short precisely at the 2503 rejection point, efficiently hedging against any potential drawdown from open long positions established lower down. This strategy exemplifies disciplined trading, strategically balancing risk and reward, capitalizing on clearly defined market structures and critical levels.
Summarizing the current state of play with utmost clarity, ETH stands delicately poised between bullish confirmation and bearish capitulation. Intraday sessions in the coming hours, notably London open and subsequently New York open, are expected to provide the decisive directional impulse. Traders should actively monitor price response at these critical levels, maintaining protective hedges where necessary while remaining flexible and adaptive to emerging market dynamics.
In conclusion, ETH’s immediate trajectory hinges upon nuanced market reactions at this strategically significant confluence point. Stay vigilant, as ETH approaches a potentially transformative decision—one offering both substantial opportunity and considerable risk, contingent upon disciplined execution and strategic clarity in your trading approach.

Ethereum at Key Resistance After Short Squeeze BounceEthereum recently found a local bottom at $2,111, triggering a sharp bounce that resembles a short squeeze. However, the rally has met a significant resistance zone—a former support level now flipped into resistance. This zone is technically loaded with multiple confluences: the point of control, the VWAP, the 0.618 Fibonacci retracement, and the $2,550 weak resistance area. Reclaiming this zone is essential for Ethereum to regain bullish momentum.
Structurally, the daily market structure has shifted. The previous trend of consecutive higher highs and higher lows has been broken with the recent drop, signaling a bearish structural shift unless key levels are reclaimed.
If Ethereum fails to break and hold above $2,550, the current move may confirm as a bearish retest, increasing the likelihood of a rotation back to $2,227 in the near term. A loss of $2,227 would open the door for a much deeper correction, targeting the $1,790 support zone—a critical level that acted as a base during previous consolidations.
At this point, Ethereum sits at a pivotal juncture. The reaction at current resistance will determine whether bulls can regain control or if bears will drive the next leg lower.

ETH and iHnS SpeculationETH in candle stick mode create iHnS pattern
if we can hold above 2k its still positive if we can retest to 3.2k
ETH Eyes FVG Fill — Buy Dips Toward Confluence Support✅ Multiple confluences: 1h MSS, range lows, FVG, and OB cluster at $2,273–$2,319
✅ High probability of FVG ($2,529) being filled before new lows
⚠️ Downside sweeps are buys, not sells — use zone for bids
Active Setup:
Long Entry: Bids in $2,273–$2,319 zone (on confirmation: SFP/reclaim or strong bounce)
Targets: First TP at FVG ($2,529), next at range high ($2,787)
Stop: Below $2,185 (invalidate on close below sweep low)
🔔 Triggers & Confirmations:
Only enter on strong reversal/bounce in blue box
No FOMO above FVG, wait for clean setup
🚨 Risk Warning:
Avoid chasing into resistance (FVG), wait for dip entries with confirmation

Everyone sees consolidation. I see positioningETH is holding just above a key fib cluster, showing signs of controlled distribution, not weakness. Smart Money doesn’t chase — they build positions while the crowd second-guesses.
The Structure:
Current Price: ~2,419
Local High (Premium): 2,482.09
Fib Retracements:
0.236 → 2,394.72 (mild correction)
0.382 → 2,340.68 (initial re-entry zone)
0.5 → 2,296.99 (ideal discount)
0.618 → 2,253.31 (deep entry, high confluence)
0.786 → 2,191.11 (structure last line)
Key Zones:
FVG already filled during the move up — imbalance mitigated
Order block (OB) at 2,191.11: high-probability reaction zone
Strategy Outlook:
Scenario A (Shallow pullback):
ETH tests 2,394 → 2,340, then continues the push to 2,482
→ Aggressive buyers step in early
Scenario B (Deeper sweep):
A drop to 2,296 → 2,253 opens the door for reaccumulation
→ Classic Smart Money trap before the next rally
Invalidation:
A break below 2,191 (and OB failure) kills this bullish narrative
Execution Logic:
Accumulation Zones:
Light: 2,340–2,296
Strong: 2,253–2,191 (discount reload)
Target:
2,482
Extension optional if momentum builds above recent highs

[SeoVereign] ETHEREUM Bearish Outlook – June 27, 2025We are the SeoVereign Trading Team.
With sharp insight and precise analysis, we regularly share trading ideas on Bitcoin and other major assets—always guided by structure, sentiment, and momentum.
🔔 Follow us to never miss a market update.
🚀 Boosts provide strong motivation and drive to the SeoVereign team.
--------------------------------------------------------------------------------------------------------
Hello,
I would like to present a bearish outlook on Ethereum as of June 27, 2025.
In the most recent Bitcoin idea I shared on the 22nd, I explained the reason for setting the take-profit zone at 98,875 and mentioned the possibility of a short-term rebound. Amidst the ongoing war risks in the Middle East that are shaking the overall crypto market, the market has shown a successful rebound, with Bitcoin at the center of this movement.
However, this upward movement has been limited to Bitcoin alone, while other major altcoins have shown weak and sluggish rebounds. In such a situation, when predicting a future decline and considering short positions, I believe it is strategically more advantageous to target altcoins rather than Bitcoin. The inability to properly rebound suggests a momentum issue, which is likely to lead to relative weakness in the market.
Many investors tend to short Bitcoin simply because it has risen significantly in price, but this is a beginner-level mistake. Taking a short position solely based on a large price increase carries high risk, and it is more rational to base strategies on altcoins that are failing to gain upward momentum.
From this perspective, I was preparing the basis for a short position in this idea, and as a technical confirmation signal has appeared, I now present a short strategy for Ethereum. The first target is set around the 2,357 level.
If the movement unfolds, I will further explain the analytical thinking that made it possible to anticipate this decline, along with additional key points to monitor in the market.
Thank you.

ETH: Short 25/06/25Trade Direction:
ETH: Short
Position Strategy:
- Risk approx 0.5%
Reason for Entry:
- Daily FVG
- Big resistance level
- Critical level of resistance, until flipped bias on eth must remain bearish intraday
- H4 Liquidity Swept

Ethereum (ETH): Buyers Dominating | Going For $3000Ethereum is pushing, and we are back near EMAs and possibly going for another breakout attempt from here.
We are looking for a proper breakout, which would then trigger for us an opportunity for a long position towards the $3000.
Swallow Academy

ETHEREUM is having a bearish retest?#ethereum price has been moving in a distribution zone and needs to breakout at least 3000$ to be optimistic and 3300$ to be bullish. #eth price is now having a bearish retest where broke the former support zone and now testing the current resistance zone. 4H ichimoku cloud must be broken out. A heavy declination from this zone may cause heavier dumps.

ETH Retracement 50% FibHi there, I think there will be a retrace at ETH to 50% fib. My new buy zone will be 2300 and I am short at the moment to 2300. Hope this helps you out. Do your research and this is no financial advice, just an idea. Oh and by the way, I got my SL just above the current high (~2490).
Let me know what your thoughts are in the comment below!

ETH/USDT | ICT Price Delivery Model: AMD📍 ETH/USDT – Daily Timeframe | ICT Smart Money Framework
This analysis outlines a clean execution of the ICT Price Delivery Model:
🔹 Accumulation Phase:
Price consolidates in a defined range, building liquidity above and below the zone.
🔹 Manipulation Phase:
Liquidity sweep to the downside taps into the Balanced Price Range (BPR) — engineered to trap late sellers.
🔹 Repricing Phase:
Price reacts sharply from the Daily Fair Value Gap (D FVG), confirming bullish intent.
🔹 Distribution Objective:
Smart Money likely targeting external liquidity resting above the $3,400 level.
Key ICT Concepts Applied:
✔ Break of Structure (BOS)
✔ Market Structure Shift (MSS)
✔ Fair Value Gap (FVG)
✔ Balanced Price Range (BPR)
✔ External Liquidity ($$$)
📈 Directional Bias: Bullish
🎯 Primary Target: $3,400 (Distribution Zone)
🕒 Chart Type: Daily (1D)
📉 Invalidation: Break and close below BPR without mitigation
📊 Shared by SeenForex – Precision Analysis through ICT Methodology

ETH/USDT Bullish Reversal Analysis Chart Overview:
Ethereum (ETH) has shown a strong bullish reversal from the support zone near $2,200, forming a V-shaped recovery pattern. The price is currently trading around $2,450, with upward momentum targeting the next key resistance level.
📌 Key Technical Highlights:
✅ Support Zone:
Clearly respected at $2,200 – $2,300 range
Multiple candle wicks suggest strong buyer interest
✅ Resistance Zone:
Major resistance expected around $2,900
Historical rejection indicates potential selling pressure
✅ Target Level:
Short-term target marked at $2,610 🟣
If momentum sustains, price could push towards this zone before facing resistance
📈 Bullish Momentum:
Strong breakout from downtrend channel
Formation of higher highs and higher lows
Price action respecting upward trend structure
🛠 Pattern Structure:
Reversal pattern after corrective phase
Bullish engulfing candles suggest continuation
📊 Forecast Path:
Two potential scenarios are outlined:
📈 A clean push to the $2,610 target, followed by consolidation
🔄 A short pullback to $2,374 before continuation to the target
⚠️ Conclusion:
ETH/USDT is showing bullish signs with potential to reach $2,610. Watch for consolidation or pullbacks as buying opportunities, but be cautious of heavy resistance above $2,900. Ideal for short- to mid-term bullish setups

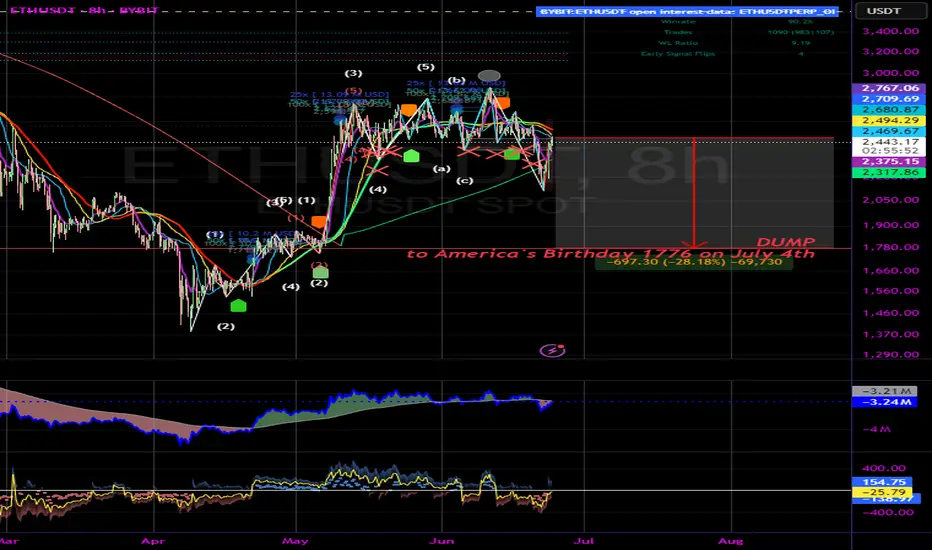
ETH Dumping to 1776 in honor of America's birthdayBART express incoming. Nice liquidity grab down there as well.
Not financial advice.
Happy July 4th!
ETH - SHORT SET-UPBINANCE:ETHUSDT
Short Setup Summary (ETH/USDT Weekly):
Resistance Zone: $2,590–$2,720
View: Expect rejection from this zone
Target: $2,150
Stop-loss: Above $2,914
Setup Type: Supply zone rejection (bearish setup)
Confirmation: Watch for reversal candles in the zone
