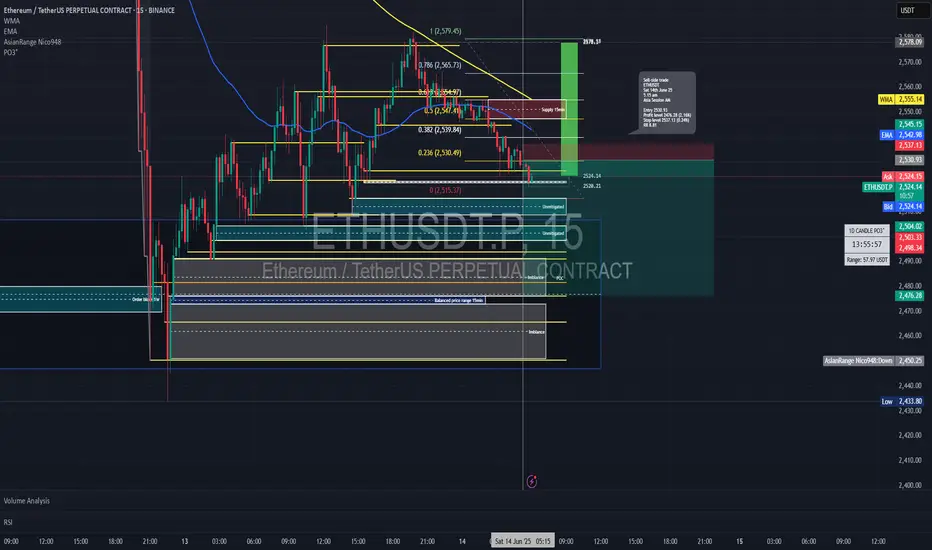
ETH-----Sell around 2525, target 2475 areaTechnical analysis of ETH contract on June 14:
Today, the large-cycle daily level closed with a small negative line yesterday, the K-line pattern continued to fall, the price was below the moving average, and the attached indicator was dead cross. The decline in the big trend is still very obvious, but we still have to pay attention to the stimulus brought by the news data. The low support is still around the 2300 area; the short-cycle hourly chart yesterday's European session rose and corrected the US session. The price began to retreat under pressure in the Asian morning today. The current K-line pattern is continuous and the price is below the moving average. The attached indicator is dead cross, so it is likely to continue to fluctuate downward during the day.
ETH short-term contract trading strategy:
The current price is 2525, directly short, stop loss in the 2565 area, and the target is the 2475 area;
ETHUPUSDT trade ideas

ETH UPDATE 🛡️ Ethereum Holds the Line — Critical Support Zone Tested Again
Because Ethereum has plummeted over 14% since Wednesday, traders and long-term holders are worried. Bullish investors expected ETH to break over $3,000 and confirm a wider cryptocurrency rise days earlier.
However, global turmoil has slowed markets. Israel's assaults on Iran and retaliations shook global markets on Thursday, causing crypto asset volatility and risk-off.
Historical trends between August 2021 and early 2024 suggest that keeping $2,500 has led to rallies reaching $4,000. Rekt believes Ethereum must maintain consistency around this zone to prevent a deeper retreat and maintain bullish momentum.
ETH has held $2,500 over five weeks, proving its stability despite numerous testing. In the weeks ahead, altcoins and the crypto market will depend on whether Ethereum can maintain this footing again.
Ethereum fell sharply from $2,830 this week to $2,556. On the daily chart, ETH has been rangebound between $2,500 and $2,830 for weeks. Ethereum has held above the 50-day and 100-day moving averages, which are rising, despite international threats.
The red 200-day moving average at $2,642 has provided resistance. A retracement followed ETH's short break above this level, which it failed to keep. Recent volumes have increased due to heightened attention and emotive price responses in the Israel-Iran conflict.
The $2,500–$2,520 support zone is important. This region has been a floor before and might rocket bulls if they recover control. A clear fall below $2,500 might turn sentiment negative and lead to $2,300.

ETH/USDT Technical Overview – June 14, 2025📝 ETH/USDT Technical Overview – June 14, 2025
Timeframe: 1D (Daily)
Exchange: Bybit Spot
Current Price: $2,538.97
Daily Change: -1.55%
🔍 Market Structure Overview:
Primary Trend: Still bearish on the macro (lower highs from November to April).
Change of Character (CHoCH): Detected around mid-April → first signal of bullish intent.
Short-term Trend: Bullish structure formed from April to early June (marked "UP TREND").
Recent Break: Price has broken the bullish trendline and is currently pulling back.
🧠 Smart Money Concepts:
Fair Value Gap (FVG):
Noted below the current price zone – acting as a potential draw for liquidity. Price may fill this imbalance before deciding on further direction.
CHoCH Confirmation:
The change in character initiated a shift, but without a BOS (Break of Structure) above $3,034, macro bearish bias remains intact.
🛠️ Key Levels:
Type Price ($) Notes
Resistance 3,034.26 Key swing high, trendline confluence
Support 2,397.35 Minor support
Support 2,313.92 Local liquidity zone
Support 2,200–2,104 Strong demand zone + FVG area
Support 1,537.55 Major historical support
🔮 Potential Scenarios:
📉 Bearish Scenario:
Continuation of rejection from downtrend resistance.
Pullback into the FVG around $2,200–$2,100.
Potential bullish reaction from there.
If broken, next major support lies around $1,537.55.
📈 Bullish Scenario:
Support holds at $2,313–$2,200, bounce begins.
Break and close above $2,800–$3,034 would confirm a macro trend shift.
⚠️ Bias Today:
Neutral to Bearish
Until we see a strong bullish reaction from the FVG or a reclaim of the trendline, pressure remains to the downside.

Short trade Sell-side trade
ETHUSDT
Sat 14th June 25
5.15 am
Asia Session AM
Entry 15min TF
Entry 2530.93
Profit level 2476.28 (2.16%)
Stop level 2537.13 (0.24%)
RR 8.81
Sell-side trade idea narrative based on the ICT seek and destroy indicator, taking session liquidity into account for directional bias, along with unmitigated price zones and imbalanced price ranges for confluence.
ETH - AnalysisEvery time Ethereum has broken through $2,800,
it triggered a massive move.
Over the past two years, this level has acted as key support or resistance 7 times.
Once we break through and get a clean, sustained close above, the next major rally is likely to follow.
Keep a close eye on this price level — it will be the turning point.
LFG

ETH LONG TRADE PLAN.ETH long below the liquidity line in demand zone. Below sell side liquidity is our entry zone.

ETHUSED TREND WEAKER Price has been ranging between approximately 2500 and 2900 and the major trend is strongly bearish.Price recently attempted to break above previous highs but got rejected. Price is at a critical support level in a larger range structure. A break below 2500 could lead to a deep correction correction

Eth longSimple idea here, if BTC gets stuck between the weekly range, then maybe ETH gets some traction.
There hasn't been a meaningful pullback since the last move up so we may see that move down soon or we follow BTC and move straight up fairly quickly after a shallow move down to sweep the lows
That whats I'm illustrating here, small sweep of the recent lows and then a move up to previous highs

Ethereum Weekly: Bullish & Bearish ExplainedEthereum has been sideways five weeks straight. Market conditions here are bullish and bearish short-term. Let me explain.
The market has bearish potential because of resistance. Ethereum has been facing resistance and fails to move forward for more than one month, but the bias isn't bearish, this is just a potential based on short-term price action.
The market has bullish potential because of a strong recovery after the 7-April low; because it trades above the August 2024 low and because there is very little retrace since the 5-May break of resistance in the form of EMA34 and MA200.
Ethereum is bullish because it trades above MA200 and remains above this level.
We are seeing bullish consolidation. There was an advance recently and after this advance the market went sideways. This means bullish.
While there can be a retrace short-term, market conditions remain bullish for this pair; ETHUSDT.
The bulls have the upper-hand and the majority of signals are bullish. Ethereum will continue to grow.
There is no scenario where Ethereum moves and closes weekly below its 3-Feb and 24-Feb lows ($2,075). It is simply consolidating before additional growth. It is going to go up, sooner rather than later.
Thanks a lot for your continued support.
Namaste.

Ethereum (ETH) is still looking bullish"Spring" breakout, retest of the range low. Textbook price action on ETH!

"Bearish Reversal Opportunity Following Supply Zone Rejection"1. Double Top Formation (Resistance Level Identified)
The chart displays a clear double top structure at the 2,760–2,800 USDT level.
This level has acted as a strong supply zone (highlighted in red), where price previously reversed, indicating heavy selling interest.
Current price action has retested this resistance zone and shown signs of rejection.
2. Liquidity Sweeps & False Breakouts
On the left side of the chart, an aggressive downward wick (marked with a blue arrow) suggests a liquidity sweep below a key low before strong bullish momentum returned.
This type of price action indicates smart money involvement, designed to remove weak hands before pushing price higher.
3. Accumulation Phases (Sideways Consolidation)
Multiple accumulation ranges are highlighted with blue rectangles.
These ranges show horizontal consolidation, where price builds up energy before breakout.
The most recent breakout led to a vertical rally toward the resistance zone, signaling an end of the accumulation and a start of distribution.
4. Double Bottom Support Structure
Identified near the 2,480 level, marked by red circles.
This level has historically acted as demand/support, evidenced by multiple bounces from this price zone.
Now highlighted with a grey zone, it is projected to act as the next key support area.
5. Bearish Projection
A large black arrow suggests a forecasted bearish move from the current high (~2,800) back to the support zone (~2,480).
This aligns with the idea of a mean reversion or pullback after a strong bullish impulse.
---
Conclusion & Trade Idea:
🔻 Bias: Bearish (Short-term)
The chart presents a classic reversal pattern with a double top at a well-defined supply zone.
Entry could be considered after confirmation of rejection from this level.
🧠 Trade Plan Suggestion:
Entry: Short near 2,780–2,800 after bearish confirmation (e.g., bearish engulfing candle or break of structure).
Target: 2,480 (support zone).
Stop Loss: Above 2,820 (recent high).
Risk-Reward: Approximately 1:2.5 or better depending on execution.

ETH rang is being respected. ETH is holding strong within range. As long as the price stays in range, a bullish bias is supported. If the price breaks below, there is a volume gap sub 2k. Be ready with the plan.
Full TA: Link in the bio

ETH: Next ATH on the Horizon? My Elliott Wave Analysis Says YESMy latest Elliott Wave count on TradingView points to a significant bullish impulse for ETH, suggesting we're gearing up for a fresh All-Time High! The wave structure looks clean, indicating strong momentum ahead.
Check out my chart and let me know your thoughts on this potential move!
#ETH #ElliottWave #TradingView #ATH #Crypto #MarketAnalysis #Bullish

ETH ANALYSIS📊 #ETH Analysis : Update
✅As we said earlier, #ETH performed same. Now we can see that #ETH is trading in a bullish flag pattern and its a bullish pattern. We could expect around 10% bullish move if it sustain above its major support.
👀Current Price: $2555
🚀 Target Price: $2815
⚡️What to do ?
👀Keep an eye on #ETH price action and volume. We can trade according to the chart and make some profits⚡️⚡️
#ETH #Cryptocurrency #TechnicalAnalysis #DYOR

HolderStat┆ETHUSD above the consolidation zoneCRYPTOCAP:ETH
→ Basing above 2 400 while probing triangle apex
↳ Crack 2 550–2 600 for runway to 2 850–3 150
⇢ Trend guard sits at 2 650 → 2 500
⤴ Close < 2 650 drops Ether back into old range
ETH - Another Take - When in Doubt, Zoom OutETH on the multi day time frame appears to have been respecting this ascending series of support / resistances since its inception.
If this resistance holds, this is a major breakdown of ETH’s last support - assuming the chart does work best on these ascending channels (certainly has historically).
Due to this I am shorting ETH at 2550 appx - and my targets are marked on the chart (3 purple levels).
I don’t see why any formation on the chart should be dismissed if it has a strong interaction historically.
Let’s see what happens.
Happy trading
Ethereum (ETH): Back at 200EMA | Buyers Trying To Gain Control A strong selloff happened recently, which led the price to the 200EMA line, where, similar to last time we touched that area, we are seeing some kind of bullish overtake happening.
Now, as markets are very unpredictable currently, we are looking for a full buyside takeover to happen near the current zone, which would then mean that our game plan will remain the same: movement to $3000.
Now, if sellers continue to show dominance, we might be seeing a very nasty drop from here so keep your eyes wide open at the 200EMA line.
Swallow Academy

eth in 45minas you can see we have a bullish trend and strong support for eth.the price will go up and push for orders in higher price.follow me for more....

ETH - Medium-Term Bulls Confirmed Control!Hello TradingView Family / Fellow Traders. This is Richard, also known as theSignalyst.
📈 As per our previous ETH analysis (shown on the chart), ETH rejected the green support zone and pushed higher, reaching our target near $2,750.
What’s next?
After breaking above the $2,750 structure marked in red, the bulls have confirmed medium-term control.
🏹 As long as the last major low at $2,700 holds, ETH is expected to remain bullish, with a potential move toward the $3,500 resistance zone.
📚 Always follow your trading plan regarding entry, risk management, and trade management.
Good luck!
All Strategies Are Good; If Managed Properly!
~Rich
Ethereum VS $2800The 20MA on monthly timeframe for Ethereum is still working as a strong resistance, and Ethereum is running out of time to break it.
Maximum June or July..

Ethereum (ETH/USDT) Breakout Watch ! Hello traders here is KingPro's analysis on Ethereum
📈ETH is at the critical resistance level strong closing above it could tiger a bullish move.
Current Price: $2,628
EMA 70 Support: Price is holding above the 70-period EMA ($2,577), showing bullish structure.
Support Zone: The area around $2,320–$2,400 is acting as a strong historical support, confirmed multiple times.
Supply Zone: Consolidation occurred near $2,570–$2,620, but price has broken above it — indicating accumulation.
Critical Resistance Area: Around $2,780–$2,800. This is a key level — a breakout above could lead to strong bullish continuation.
Next Target: $2,782.93 – price may retest this resistance as indicated by the projection arrow.
📊 Trade Idea:
If ETH sustains above $2,620 and breaks the short-term channel resistance, a move toward $2,782+ is likely.
🔒 Risk: A breakdown below the EMA or the supply zone (~$2,570) could invalidate the setup.

ETH 3D – Between Panic and Balance
When panic hits, zoom out and try to find balance.
ETHUSDT on the 3D timeframe just had its strongest rejection from the 200MA in this rejection series that started on May 13—exactly one month ago.
Price is now once again retesting the 0.5 Fib, continuing the same retesting pattern that began on May 13.
Touching the 200MA often triggers profit-taking from traders.
On the macro side, recent events are causing panic and prompting sell-offs.
Now let’s see if hitting the 0.5 Fib will bring buyers back in.
Looking at the volume bars from the past month, buying volume is increasing while selling volume is declining . This could suggest that in this choppy range, sellers are stepping back while buyers are starting to build strength.
MLR = SMA = BB center, confirming the current sideways environment.
The 50MA hasn’t even started to flatten—it’s still pointing down.
Always take profits and manage risk.
Interaction is welcome.

ETHUSDTIt will go to 2000 FVG after consolidating I might go back to 3000.
It probably will not come to 1600. More likely Go to 3000.
