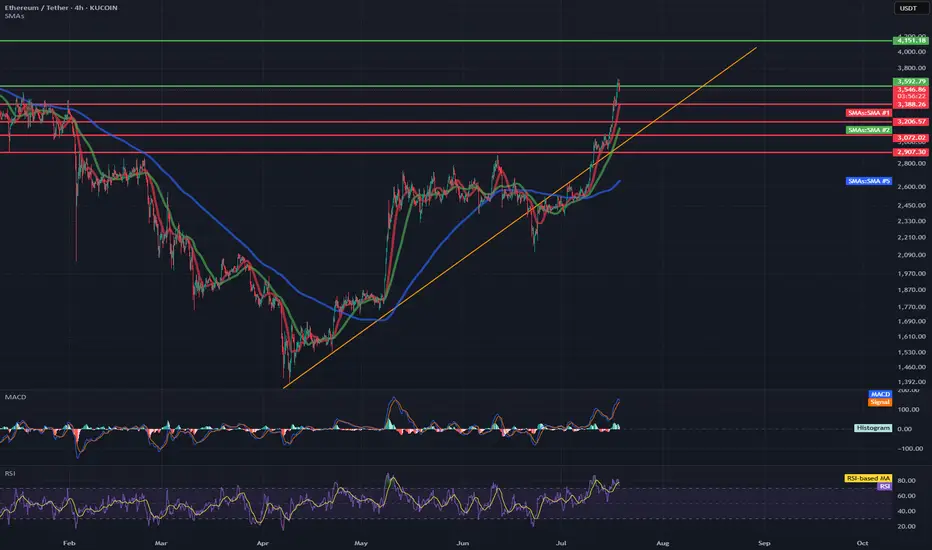
ETH/USDT 4H Chart✅ Market Trend and Structure:
Uptrend: The highlighted orange trend line shows continuous growth since mid-April. The price is trading above the 50- and 200-period moving averages (EMA and SMA), confirming bullish sentiment.
Current price: around 3556 USDT – very close to local highs.
Resistance break in the 3200–3300 USDT area, which now acts as support.
📈 Technical Levels:
Resistance (red horizontal lines):
3600–3650 USDT – local resistance resulting from market reaction.
3888 USDT – next historical resistance level.
4133 USDT – established long-term target (green dashed line at the top).
Support:
3300 USDT – strong support after a previous breakout.
3080 USDT – previous high, now the next support level.
3070 / 2900 USDT – key technical support levels in the event of a larger correction.
📊 Indicators:
MACD:
The MACD is in a strongly bullish zone, but:
The histogram is flattening.
A bearish crossover pattern is possible in the following candles – a signal of weakening momentum.
RSI:
RSI ~74 – is in the overbought zone, which often heralds a correction or at least consolidation.
A value above 70 confirms the bullish trend but may suggest that momentum is overheated.
📌 Conclusions and Scenarios:
🔼 Upside Scenario (trend continuation):
If the price remains above 3300–3350 USDT, it could move towards 3888, and then 4133 USDT.
A break above 3650 USDT on heavy volume will be a strong continuation signal.
🔽 Corrective scenario (short-term pullback):
The RSI and MACD suggest a possible correction.
Potential pullback to:
3300 USDT (retest of previous resistance as support).
SMA 200 (~2600 USDT) with a deeper downward move.
ETHUPUSDT trade ideas
Don't miss Ethereum todayHello friends
Given the good rise we had, you can see that the price has entered a correction and has provided us with a good opportunity to buy in steps, of course with capital and risk management.
*Trade safely with us*

ETH - Confirmed target is 4100- After successfully breakout from the major resistance price is heading towards the next resistance line.
- From the previous all time high, we have a clear resistance around 4100 range.
- We can expect this bullish trend to continue easily and reach the next resistance around 4100.
Stay tuned for more updates
Cheers
GreenCrypto

eth buy longterm"🌟 Welcome to Golden Candle! 🌟
We're a team of 📈 passionate traders 📉 who love sharing our 🔍 technical analysis insights 🔎 with the TradingView community. 🌎
Our goal is to provide 💡 valuable perspectives 💡 on market trends and patterns, but 🚫 please note that our analyses are not intended as buy or sell recommendations. 🚫
Instead, they reflect our own 💭 personal attitudes and thoughts. 💭
Follow along and 📚 learn 📚 from our analyses! 📊💡"

tahlile eth baye in mahHere is the English translation of your analysis:
---
**Comprehensive Analysis of Ethereum**
Ethereum is currently at a critical point and is experiencing significant volatility. It is attempting to break through key resistance levels to continue its upward trend. However, failure to break these levels could lead to a price decline. Various factors, such as whale activity and the break of key resistance levels, can influence Ethereum's future trend.
### **Technical Analysis**
**Current Trend:**
Ethereum is currently trading in a range, fluctuating between support and resistance levels.
**Support Levels:**
Key support levels are at **\$1,750** and **\$1,650**.
**Resistance Levels:**
Key resistance levels are at **\$1,930** and **\$2,100**.
### **Possible Scenarios**
* **Bullish:** If Ethereum can break above the \$1,930 resistance level and hold above it, it could move toward higher targets.
* **Bearish:** If Ethereum fails to break through the resistance levels, it may decline toward lower support levels.
### **Whale Activity**
Whale activity currently has the potential to significantly impact Ethereum's price trend. If whales continue to accumulate Ethereum, it could support a reversal of the bearish trend.
---
### **Fundamental Analysis**
**Correlation with Bitcoin:**
Ethereum remains heavily influenced by Bitcoin, and its price movement is largely dependent on Bitcoin’s trend.
**New Projects:**
The development of new projects within the Ethereum ecosystem can drive demand and increase its price.
**Regulations:**
New regulations in the cryptocurrency space can affect Ethereum’s future.
---
### **Recommendations**
* **Monitor Whale Activity:**
Investors should pay close attention to whale behavior in the Ethereum market.
* **Watch for Resistance Breakouts:**
Breaking through key resistance levels could signal the beginning of a bullish trend.
* **Risk Management:**
Given the high volatility in the crypto market, effective risk management is crucial in investment strategies.
* **Further Research:**
Conducting additional research on Ethereum and the factors influencing it is highly recommended for better decision-making.
> **Note:** This analysis is a general overview of Ethereum’s current status and should not be considered as investment advice.
---
Let me know if you'd like this formatted as a PDF, presentation, or infographic.

YET AGAIN!! ~~ ETH to $3200!!My shitposting 3 times for eth because it happens!! It happenss! ITT HAPPENS!!! I said it

Eth $2,500 Resistance — Will Harmonic Pattern Trigger a Rally?Ethereum Stuck at $2,500 Resistance — Will Harmonic Pattern Trigger a Rally to $3,400?
Ethereum has been trading in a prolonged consolidation phase around the $2,500 level — a region that has acted as resistance for several weeks. This extended period of sideways action could signify either accumulation or distribution, depending on what comes next. Technically, Ethereum remains capped below major resistance and has yet to confirm a bullish breakout. However, a deeper corrective move followed by a reclaim of key levels could activate a larger harmonic pattern, which presents a potential rally scenario toward the $3,400 region.
-$2,500 Resistance Zone: Price continues to stall at this critical area, signaling indecision
-$2,200 Support Level: A potential bounce zone where bulls may re-enter the market
-Harmonic Pattern Forming: Possible C-to-D leg expansion targeting $3,400, pending confirmation
Ethereum’s price has remained stuck around the $2,500 region, which has evolved into a high time frame resistance. Price has yet to show a decisive breakout, and this extended stay near resistance typically signals one of two things: stealth accumulation before a breakout, or distribution before a breakdown. The direction will become clearer once price action reacts to either a support retest or a break of the current range.
From a bullish perspective, a potential corrective move toward the $2,200 region — a well-established support — would provide a healthy reset for price action. This zone has previously acted as a demand area and aligns closely with the value area low. If Ethereum bounces from this level and reclaims the point of control (POC) around $2,550 — which also aligns with weekly resistance — it would be a strong structural signal.
This sequence of moves could activate a larger harmonic pattern currently visible in Ethereum’s price action. If valid, the market could enter the C-to-D expansion phase of the harmonic setup, targeting the $3,400 region. While this pattern remains speculative and unconfirmed, its structure is valid and aligns with both historical Fibonacci extensions and support/resistance dynamics.
For this pattern to be confirmed, Ethereum must hold the $2,200 support level and produce a strong reclaim of $2,550 backed by volume. Without this confirmation, the idea remains purely speculative and should be approached with caution.
If Ethereum corrects to $2,200 and reclaims $2,550, a bullish C-to-D harmonic expansion may play out targeting $3,400. Until then, ETH remains range-bound and capped under major resistance.

BUY ETHUSDT 16.7.2025Confluence order: BUY at M15
Type of order: Limit order
Reason:
- M15~FIBO 0,5-0,618 (same position)
Note:
- Management of money carefully at the price of sub key M15 (3152)
Set up entry:
- Entry buy at 3137
- SL at 3127
- TP1: 3152
- TP2: 3164
Trading Method: Price action (No indicator, only trend and candles)

ETH Flash Crash Setup – Gaps Below to WatchEthereum broke out fast, too fast. In the process, it left two clear value gaps around $2850 and $2690 — areas where price barely traded. These usually get revisited.
I’m watching those zones for a potential flash crash setup. If we get a sharp wick down, that’s where I want to be a buyer. No chasing.
Limit orders layered in. Plan is simple:
$2850 — first tap
$2690 — full imbalance fill
Stops below $2600 if triggered
Not saying it has to happen, but if it does, I want to be ready. Mark your levels.
—
Trade safe. This is just my setup, not advice.

Ethereum to $12,000The chart, spanning from mid-2021 to projected levels into 2027, showcases Ethereum's price in a classic ascending channel, characterized by higher highs and higher lows. This is indicative of sustained buyer control and a maturing bull cycle.
Price Action and Key Levels: Ethereum bottomed out near $880 in June 2022 (close to the S2 support level around $900), forming a strong base. Since then, it has rallied through multiple resistance zones, with the most recent breakout above the R1 level at approximately $3,471. This breakout, confirmed by a close above the line on higher volume, flips R1 into new support and opens the door for further gains. The pivot point (P) sits around $2,800, providing a safety net, while lower supports at S1 (~$2,400) and S2 (~$1,200) have held firm during previous pullbacks. On the upside, the next targets include R2 (~$4,700), R3 (~$6,000), R4 (~$8,500), and R5 (~$11,000). Extending this using Fibonacci projections from the 2022 low to the 2024 high (a common tool for measuring bull runs in crypto), we arrive at a target of $12,000, which aligns with the upper channel boundary and historical cycle multiples.
Volume Confirmation: The bottom panel shows volume bars spiking during uptrends, particularly in the recent push above R1. This indicates accumulation by institutional investors and retail buyers alike, with declining volume on pullbacks suggesting limited selling pressure. Increasing volume on breakouts is a hallmark of sustainable rallies, reducing the risk of a false move.
Momentum Indicators: The blue line in the sub-chart appears to be the Relative Strength Index (RSI), currently hovering above 50 and trending upward without entering overbought territory (above 70). This signals building bullish momentum with room to run. Additionally, the lack of divergence between price and RSI further supports the strength of the current uptrend. If we see the RSI push toward 60-70, it could coincide with acceleration toward higher resistance levels.
Overall, the chart reflects a multi-year consolidation phase transitioning into expansion, similar to the 2020-2021 bull run. A measured move from the recent range (from ~$2,200 low to ~$4,000 high) projects an upside of roughly 3x, landing near our $12,000 target.
Fundamental Catalysts
Ethereum's technical strength is bolstered by robust fundamentals, making the bullish case even more compelling:
Network Upgrades and Adoption: Recent upgrades like Dencun (2024) have drastically reduced layer-2 fees and improved scalability, driving real-world usage in DeFi, NFTs, and gaming. Ethereum's dominance in smart contracts remains unchallenged, with total value locked (TVL) surpassing $60 billion and continuing to grow.
Institutional Inflows: The approval of spot Ethereum ETFs in 2024 has opened the floodgates for traditional finance, with billions in inflows expected to continue. Major players like BlackRock and Fidelity are ramping up exposure, providing a steady bid under the price.
Macro Environment and Crypto Cycle: With Bitcoin's post-halving rally typically leading altcoins like Ethereum, we're in the midst of a favorable cycle. Easing global interest rates and a weakening USD (as seen in recent Fed signals) further support risk assets like crypto. Ethereum's deflationary mechanics via EIP-1559 (burning fees) create scarcity, enhancing its store-of-value narrative.
Risk Considerations and Entry Strategy
While the outlook is bullish, no analysis is complete without risks. A broader market downturn (e.g., due to regulatory hurdles or economic recession) could push ETH back toward S1 at $2,400, invalidating the short-term breakout. However, the chart's structure suggests strong support there, making dips buyable opportunities.
For entry, consider positions on a pullback to the new support at $3,471 (former R1), with a stop-loss below $3,000 to manage risk. Position sizing should account for volatility—aim for 1-2% risk per trade.
In summary, Ethereum's chart screams bullish continuation, with technical breakouts, rising volume, and positive momentum aligning for a push to new all-time highs. Targeting $12,000 represents a realistic extension of the current trend, potentially delivering 3x returns from current levels around $3,500. This isn't just speculation; it's a confluence of data-driven signals in one of the most innovative assets in the market. Stay long, stay vigilant.

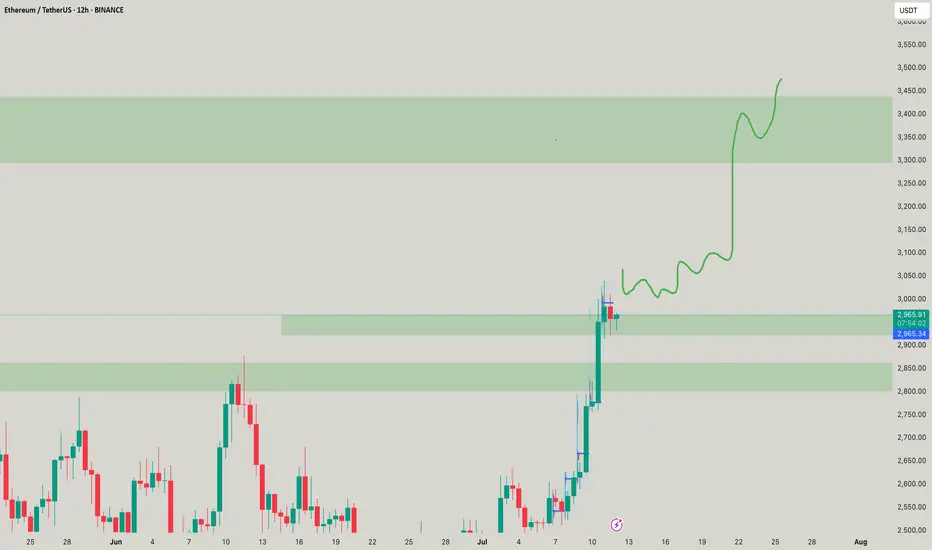
Resistance zone: 3265.0-3321.30
Hello, traders.
If you "Follow", you can always get the latest information quickly.
Have a nice day today.
-------------------------------------
(ETHUSDT 1D chart)
It is showing an upward breakout of the important zone of 2419.83-2706.15.
We need to see if the price can be maintained by rising above the Fibonacci ratio of 0.5 (2788.93).
If so, it is expected to rise to the resistance zone of 3265.0-3321.30.
The important zone of 2419.83-2706.15 is the support and resistance zone that can lead to a full-fledged uptrend.
Therefore, if it falls below this zone, we should stop trading and watch the situation.
-
Thank you for reading to the end.
I hope you have a successful trade.
--------------------------------------------------
- This is an explanation of the big picture.
(3-year bull market, 1-year bear market pattern)
I will explain more details when the bear market starts.
------------------------------------------------------

ETH Short OpportunityETH Short Opportunity 🟥 | Watch 3428 Closely
Ethereum is approaching a key resistance at $3428 — this zone could offer a great short setup if confirmed.
First target on the downside: $3340 📉
High R/R potential if price rejects this level.
Stay sharp and manage your risk!
🔔 Follow me for more real-time trade ideas and technical insights.

$ETH IS GOING TO MAKE ATHsBitcoin amd Etheureum will continue to rise until Ethereum clears these highs. The market is not done yet.
Although, I expect Bitcoin to retrace and consolidate more, i expect more bullish scenario’s than Bearish.

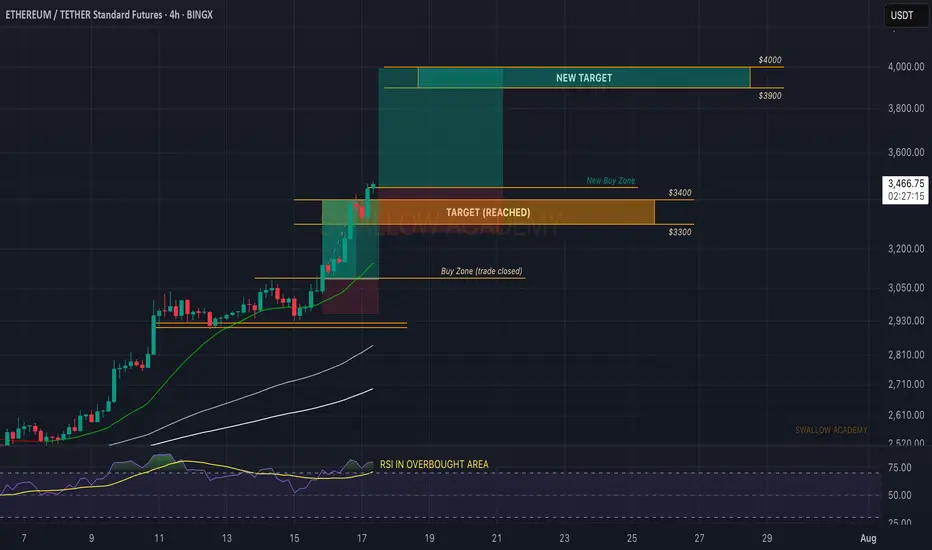
Ethereum (ETH): Yesterdays Target Reached | Now Looking at $4000Ethereum is on fire, where our yesterday's target was reached without any hesitation.
Now we shared a TA this week on a weekly timeframe where we showed that one of our major targets is $4000. So we are aiming to see that one to be reached now; momentum is good so we might as well fill it quite quickly.
Swallow Academy
ETH Price Forecast: Keep Bullish Above 2519ETH Price Forecast: Keep Bullish Above 2519
Finally, ETH is holding strong above 2520. Over the previous days, ETH lost momentum and was about to invalidate the pattern, as it reached 2475.
However, the uncertain situation from geopolitical tension and tariffs is still supporting the bulls on the crypto market.
On the other hand, ETH still has room for growth and as long as the price respects this flag pattern, the chances of ETH rising further remain high despite the developments in BTC.
You may find more details in the chart!
Thank you and Good Luck!
PS: Please support with a like or comment if you find this analysis useful for your trading day

Ethereum Analysis – Vitalik’s Gas Cap Proposal Adds PressureToday, I want to show you the possible moves for Ethereum ( BINANCE:ETHUSDT ) this week.
Please stay with me .
Let’s first take a look at the important news that has come for Ethereum in the last 24 hours :
Ethereum’s Gas Cap Proposal Sparks Concerns
Ethereum co-founder Vitalik Buterin recently proposed EIP-7983 , introducing a gas limit cap to prevent potential DoS (Denial of Service) attacks on the network.
Bearish Takeaways:
This proposal reveals a current vulnerability in Ethereum’s infrastructure. If gas limits grow unchecked, nodes may fail to sync, leading to possible network instability.
Imposing a gas cap could temporarily reduce transaction throughput, affecting DeFi protocols and NFT platforms that rely on Ethereum’s scalability.
The market tends to react cautiously to core protocol changes, and this uncertainty could trigger short-term selling pressure.
Bullish Counterpoints:
The cap aims to strengthen the network’s long-term stability against spam and DoS attacks.
It’s still in the proposal stage, with no immediate impact on users or network performance.
Conclusion:
While the long-term impact may be positive, the short-term uncertainty and exposed risks provide a bearish narrative for Ethereum, especially amid growing competition from alternative chains.
--------------------------------------
Now let's take a look at the Ethereum chart on the 4-hour time frame .
Ethereum is currently trading near the Heavy Resistance zone($2,929-$2,652) and Resistance lines , and is also trying to break the Support line .
In terms of the Elliott Wave theory , it seems that Ethereum has completed the Zigzag Correction(ABC/5-3-5) , so we can expect the next bearish wave .
I expect Ethereum to fall to at least $2,433 AFTER breaking the Support line, and if the Support zone($2,491-$2,323) is broken, we should expect further declines.
Second Target: $2,374
Note: Stop Loss (SL) = $2,689= Worst Stop Loss(SL)
Please respect each other's ideas and express them politely if you agree or disagree.
Ethereum Analyze (ETHUSDT), 4-hour time frame.
Be sure to follow the updated ideas.
Do not forget to put a Stop loss for your positions (For every position you want to open).
Please follow your strategy and updates; this is just my Idea, and I will gladly see your ideas in this post.
Please do not forget the ✅' like '✅ button 🙏😊 & Share it with your friends; thanks, and Trade safe.

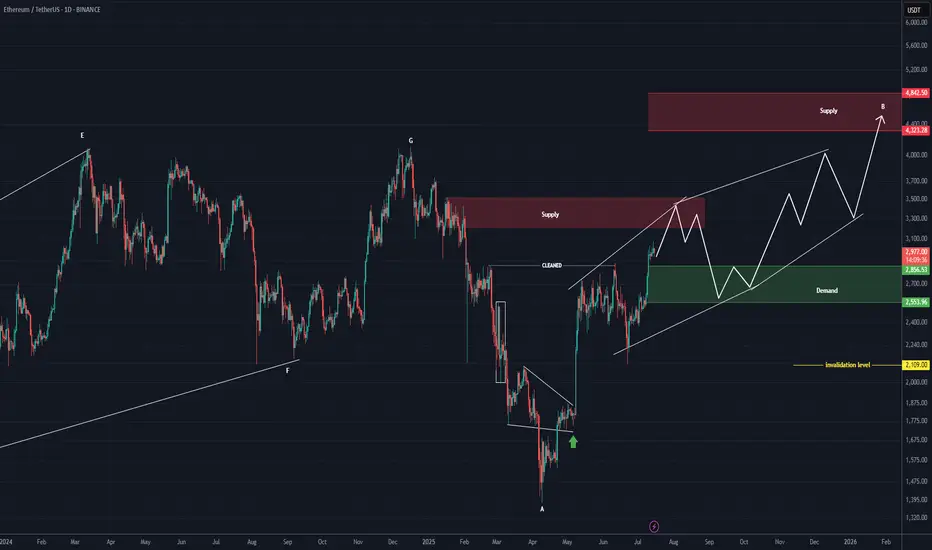
ETHEREUM Roara Map (1D)The previous phase of Ethereum appears to have been a completed diametric, and now it seems we are in a flat pattern.
It can be said that we are currently in wave B of the flat, which itself appears to be a diametric.
This diametric could even extend to the 4300–4800 range.
The green zone is the rebuy area.
A daily candle close below the invalidation level would invalidate this analysis.
For risk management, please don't forget stop loss and capital management
Comment if you have any questions
Thank You

ETH Pullback Before Next Rally? Hello guys!
Ethereum is currently testing a strong resistance zone around the $2,678 level, which has previously acted as a key barrier. Price action has been climbing steadily within an ascending channel, indicating a clear bullish trend in play.
However, since ETH is right at the resistance, we could see a short-term correction or pullback toward the $2,560–$2,580 support range (highlighted zone), which also aligns with the midline of the channel and previous consolidation structure.
If this support holds, a healthy bounce from this area would likely push ETH toward the next bullish target around the $2,760–$2,800 zone, which sits near the upper boundary of the current channel.

#ETH is about to reach the resistance zone 📊#ETH is about to reach the resistance zone ⚠️
🧠From a structural perspective, we are about to reach the resistance zone at the daily level, so we need to be wary of the risk of a pullback. If your cost price does not have much advantage, then please remember to lock in profits in time.
➡️New long trades need to wait patiently for a pullback to occur before participating, or the trend is relatively strong, and continue to consolidate sideways to form a new long structure to continue the long trend, otherwise we can't chase the rise near the resistance zone.
Will we start a pullback from here? Let's see 👀
🤜If you like my analysis, please like 💖 and share 💬
BITGET:ETHUSDT.P

ETH ~ Ready for $3400?Its time foe eth the more time it stays up the more time it goes beautifully! Understand! Such a good move to be coming soon to your doorstep lol
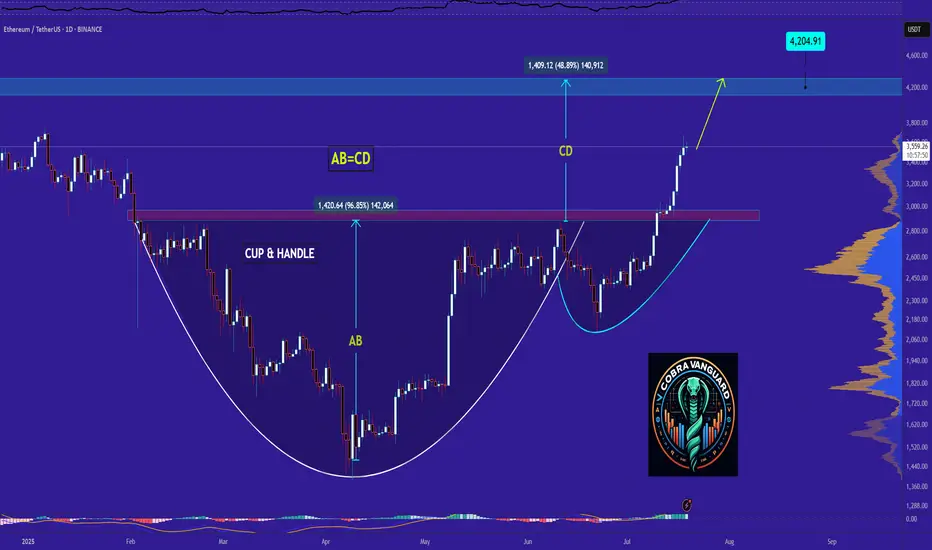
Ethereum - Time to buy again!Exactly, based on previous analyses, the price is rapidly approaching $4,000. But we need to be cautious because whenever it hits round numbers, something big usually happens!!!
previous analysis
Best regards CobraVanguard.💚
ATH FOR Ethereum!!!Hello friends🙌
As you know, Ethereum has been on an upward trend these days and we can say that buyers have entered, but not completely...👀
🔊Now, considering the resistance that Ethereum is facing, namely the number 3900 to 4100, we need to see what reaction the price will see this time when the price reaches this resistance for the 4th time?
✔We will most likely make a small correction and this time this major resistance will be broken again and we will witness a higher ceiling.
✔Otherwise, I have an important and key support that we have identified for you and if the price drops, this support is a good area to buy again.
And finally, observe risk and capital management⚠
🔥Follow us for more signals🔥
*Trade safely with us*
