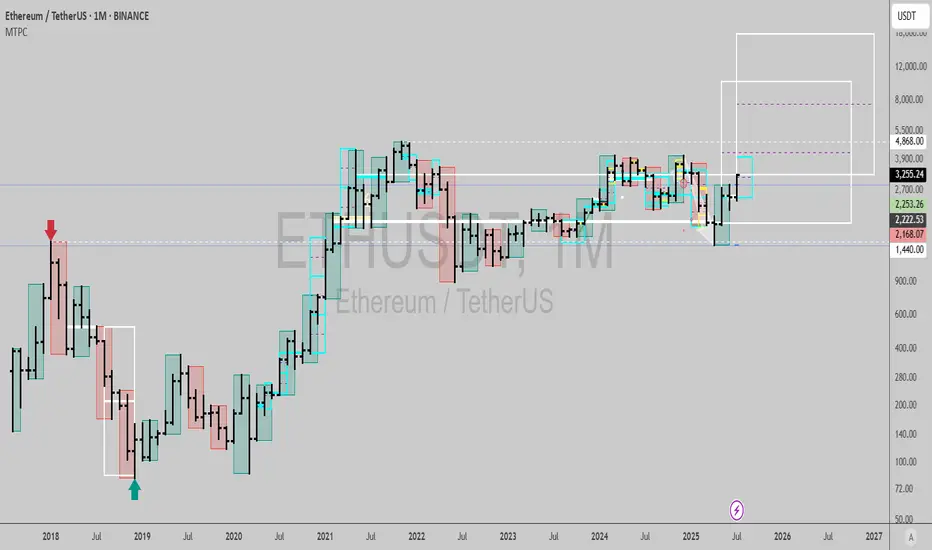
$ETHUSDT: Time at mode trend signalMonthly chart signal gives me a 17,975 United States of America Dollars per Vitalik Coin target🎯, within 19 months from now...
I don't think many people can fathom this but it is entirely possible, and probable now. (few bulls and those bullish mention 10k as a target, but nothing as high as this)
Best of luck!
Cheers,
Ivan Labrie.
ETHUPUSDT trade ideas
NEoWave Analysis of Ethereum 2025 Cash data chart shows that Ethereum is in a corrective phase and the wave structure from (A) to (C) has been completed. Initially, we expected a flat pattern to form; however, the wave structure-(C) was not an impulse and the flat was not confirmed.
As a result, given that the wave structure (A)-(B)-(C) is corrective and the waves differ in time, it seems that a contracting triangle pattern is forming and we are currently in wave-(D) of this triangle. Furthermore, wave-(D) could rise to $3630-3880 and end. Then a price correction in the form of wave-(E) may occur. This correction could end between $2900-3086 and if this range is broken downwards, wave-(E) could decline to $2000-2230, after which the main bullish move for Ethereum is expected to begin.
Good luck
NEoWaveChart

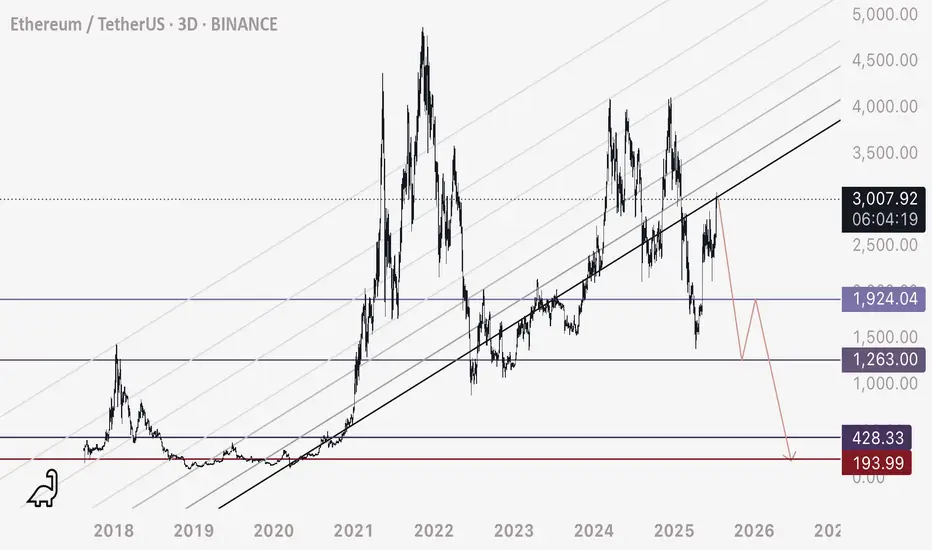
ETH - Potential Cycle Top hereETH is showing a potential cycle top per this parallel ascending channel.
Resistance would be around 3020 zone - if the channel breaks down, we may see these ultra low zones get hit if the macro landscape supports such a drastic fall.
Happy trading.
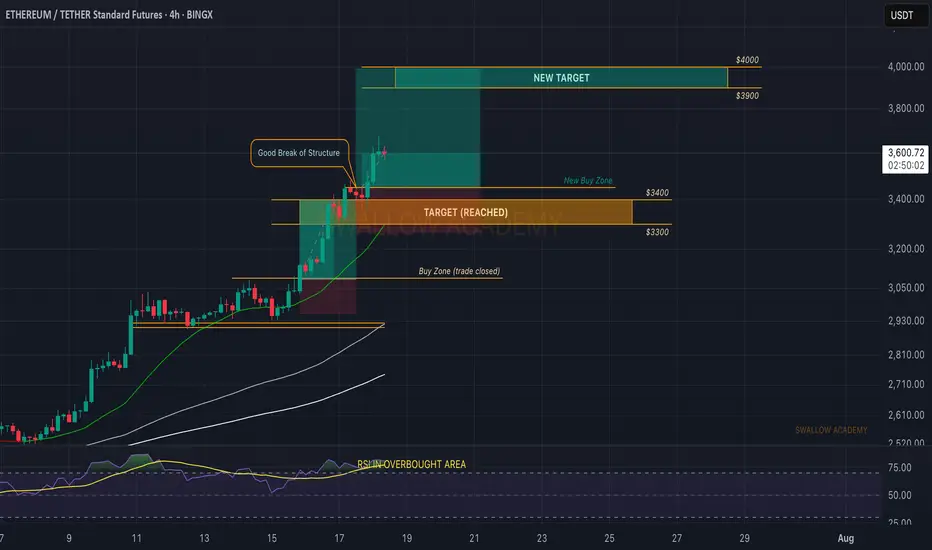
Ethereum (ETH): Buy Entry 2 Reached | $3300-$3400 IncomingNo remorse from buyers on ETH, where the price is pushing further and we are looking now at our new target, the $3300-3400 area, to be reached within this week.
There is not much more to talk about here, other than that we keep our bullish view (that we shared on a weekly timeframe).
Time for Ethereum to shine.
Swallow Academy

Altseason Starts Here? ETH Hits Critical Resistance!Ethereum has finally reached the upper resistance zone — and this could be the decisive moment for Altseason.
This level has historically acted as a major turning point for ETH. If it breaks and holds above this zone, we could see capital start flowing aggressively into altcoins.
🧠 Why it matters:
ETH reaching resistance usually signals a rotation phase from BTC to ETH.
If ETH breaks above, altcoins tend to follow with explosive momentum.
If it gets rejected, we may see a short-term cool-off.
This is the zone where narratives shift. Eyes on the breakout — or the rejection.

ETHEREUM ETHEREUM DAILY CONFIRMATION FOR LONG IS NOT APPROVED YET.BE PATIENT
Ethereum Approximately $2,930.55-2,925$ per ETH, watch for 30754 ascending trendline breakout or pull back into 2680 zone ,if we keep buying then 4100 zone will be on the look out as immediate supply roof break and close will expose 4900.my goal in this context is to see ETHUDT buy into my purple supply roof,it will happen .
Market Capitalization: Around $358 billion, making Ethereum the second-largest cryptocurrency by market cap.
Circulating Supply: About 120.7 million ETH.
Recent Performance: Ethereum has gained roughly 17.3% over the past week and about 7% over the last month, though it is down about 4% compared to one year ago.
Market and Technical Overview
Ethereum remains a key player in the blockchain ecosystem, supporting decentralized finance (DeFi), NFTs, and smart contract applications.
The price is consolidating near the $3,000 level, with technical indicators suggesting moderate bullish momentum but some short-term volatility.
Trading volume in the last 24 hours is around $29 billion, indicating strong liquidity and active market participation.
Ethereum continues to be a foundational blockchain platform with strong institutional interest and ongoing development, maintaining its position as a major digital asset in 2025.
#ethusdt #btc #bitcoin

ETHEREUM DAILYETHEREUM DAILY CONFIRMATION FOR LONG IS NOT APPROVED YET.BE PATIENT
Ethereum Approximately $2,930.55 per ETH, watch for 30754 ascending trendline breakout or pull back into 2680 zone ,if we keep buying then 4100 zone will be on the look out as immediate supply roof break and close will expose 4900.my goal in this context is to see ETHUDT buy into my purple supply roof,it will happen .
Market Capitalization: Around $358 billion, making Ethereum the second-largest cryptocurrency by market cap.
Circulating Supply: About 120.7 million ETH.
Recent Performance: Ethereum has gained roughly 17.3% over the past week and about 7% over the last month, though it is down about 4% compared to one year ago.
Market and Technical Overview
Ethereum remains a key player in the blockchain ecosystem, supporting decentralized finance (DeFi), NFTs, and smart contract applications.
The price is consolidating near the $3,000 level, with technical indicators suggesting moderate bullish momentum but some short-term volatility.
Trading volume in the last 24 hours is around $29 billion, indicating strong liquidity and active market participation.
Ethereum continues to be a foundational blockchain platform with strong institutional interest and ongoing development, maintaining its position as a major digital asset in 2025.
#ethusdt #btc #bitcoin

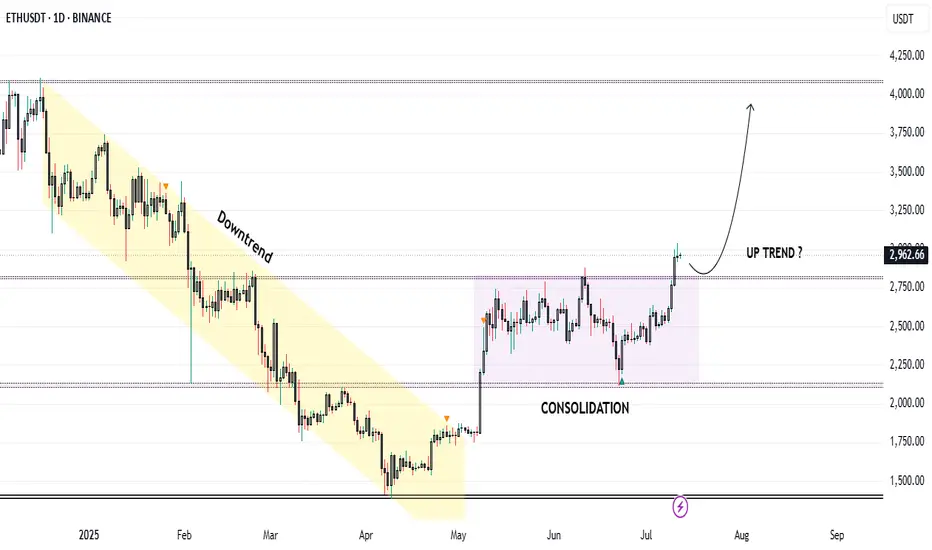
Trend Resumes: Ethereum Breaks Consolidation, Eyes $4050Market Structure Overview:
Markets typically move in two major phases:
🔹 Trend Phase (directional movement)
🔹 Consolidation Phase (sideways movement or accumulation/distribution)
These phases repeat as: Trend → Consolidation → Trend → Consolidation
Ethereum Price Action Breakdown (Daily Timeframe):
Mid-December to End-April: Clear downtrend phase.
May to Early July: Entered a consolidation zone, forming a tight range.
Current Status (July):
🔹 Ethereum has broken out of the consolidation range.
🔹 Currently trading around $3000, confirming strength.
🔹 This breakout may potentially signal the start of Altcoin Season.
Trade Setup – Long Position Idea:
Entry (Buy Zone): Around $2850 (retest of breakout resistance).
Target:
🔹 Primary Target: $4050
🔹 This aligns with a major resistance and Fibonacci extension zone.
Stop Loss: $2600 (below key structure support).
Technical Confluences:
* Breakout above multi-week range.
* Retest of resistance turned support at \$2850.
* Psychological round level near \$3000 acting as a magnet.
* Volume confirmation on breakout (optional to mention if on chart).
Risk Note:
⚠️ Caution: The Market may turn volatile due to unexpected geopolitical or macroeconomic news. Always follow risk management and avoid overleveraging.
Conclusion:
Ethereum’s breakout from a multi-month consolidation phase indicates a potential shift in momentum. If retest levels hold, this could be the beginning of a strong upside rally, possibly leading to a broader Altcoin Season. Traders can position themselves accordingly with a well-defined risk-reward setup.
Ethereum (ETH): Will Overtake The Bitcoin Soon? Ethereum has been moving much better compared to Bitcoin, which confirms our theory that ETH will now head for its ATH, just like Bitcoin did before.
We are looking for further movement to $4000 area, but be careful as we are entering weekends market, we should keep an eye on our entry area.
Volatility can happen but nevertheless, we are very bullish on ETH.
Swallow Academy
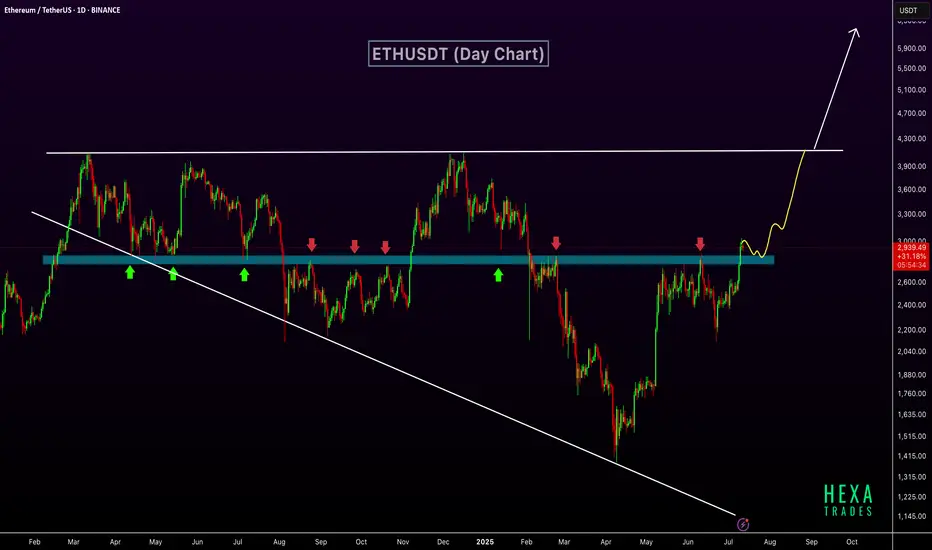
ETH Breaks Key Resistance – $6K Possible if Wedge BreaksETHUSDT has broken out above a key horizontal resistance zone that has historically acted as a strong support and resistance level. This zone, marked in blue, has seen multiple rejections and bounces over the past year, confirming its significance.
The recent breakout above this zone indicates a shift in market structure and suggests growing bullish momentum. The price action shows a clean move above resistance, with potential for a retest before continuing higher. The market is also forming a long-term broadening wedge pattern. The next target lies near the upper resistance of the wedge, around $4,000. If the price breaks above this broadening wedge, it could open the path toward the $6,000 level.
Regards
Hexa
ETH/USDT 30m Signal📉 ETH/USDT 30m Signal
Pair: ETH/USDT
Timeframe: 30-minute
Trade: SELL
📍
📊 Level
Pips
R:R
💵 Entry
3,610 USDT
🚫 Stop-Loss
3,650 USDT
🎯 Target 1
3,570 USDT
1:1
🎯 Target 2
3,530 USDT
2:1
🎯 Target 3
3,490 USDT
3:1

ETH Healthy Retest Before Next Rally!Ethereum continues to trade within a strong uptrend on the 1-hour chart, respecting the 100 EMA consistently throughout the rally. After a strong impulse move, the price is now consolidating near the recent highs.
ETH price could retest the 0.382 Fibonacci level and the 100 EMA before continuing upward. A successful retest would signal strength and could lead to a bullish continuation toward the $3900 - $4000 range.
Similar historical retests of the 100 EMA led to strong rallies, and we could see a repeat of that pattern if support holds.
Cheers
Hexa
BITSTAMP:ETHUSD CRYPTOCAP:ETH

Lord MEDZ ETH Trading Setup For Personal Journaling – Not Financial Advice
Asset: Ethereum (ETH)
Analysis Techniques Used:
Wyckoff Accumulation Phase
ICT Fibonacci Extension
Goldbach Projection Model
Thesis:
Based on confluence from Wyckoff schematic interpretation, ICT fib extension zones, and mathematical projection via Goldbach logic, Ethereum (ETH) appears poised for a significant upward move.
Accumulation signals suggest smart money positioning, with price respecting historical support levels and consolidating in a reaccumulation range.
The Fibonacci extensions and Goldbach theory projection align on the following bullish targets:
Projected Take Profit Zones (TPs):
TP1: $8,000 – First extension target post-breakout.
TP2: $17,000 – Macro-level expansion target in line with Wyckoff Phase E markup.
TP3: $19,700 – Final speculative cycle top target (Goldbach-based projection).
Narrative & Confluence:
Wyckoff Accumulation: ETH has shown signs of a spring and test, followed by higher lows and supply absorption.
ICT Fib Extension: Expansion zones line up with 8000 as TP1, consistent with ICT’s market maker models.
Goldbach Theory: Historical symmetry and prime pair modeling projects extreme but technically plausible TP2 and TP3 ranges.
Notes:
This thesis is part of Lord MEDZ's personal trading journal and is not to be taken as financial advice. Cryptocurrency markets are highly volatile. All readers should do their own research and only invest what they can afford to lose.
Trade safe. Protect capital. Stay sharp.
Lord MEDZ

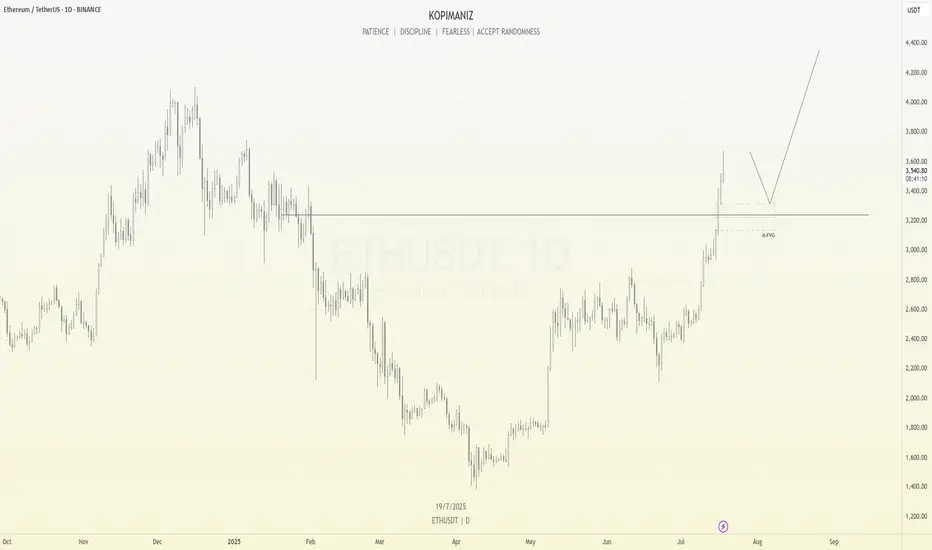
ETHUSDT Analysis – Potential Pullback Before ContinuationAfter a strong bullish rally, ETHUSDT may be ready for a short-term correction. The price has broken a key structure and is now trading well above previous resistance.
I'm expecting a potential pullback into the Fair Value Gap (FVG) area around $3,200, which also aligns with a retest of the previous resistance now turned support. If this level holds, it could act as a springboard for the next bullish leg, possibly targeting the $4,000+ region.
This setup follows a typical market behavior where price fills imbalance zones before resuming its trend.
Key levels:
Support zone: $3,200 – $3,300
Bullish continuation target: $4,000 – $4,400
Let’s see how price reacts at the FVG zone. Patience and discipline are key.
From now on, be careful!!Hello friends..
We are back with a new analysis of the Ethereum cryptocurrency, from the area I had previously specified, we are currently in profit by about 120%. (We gave a buy signal to the good cryptocurrencies in the market at the peak of market disappointment, you can enter the page to view.)
Now we have reached the resistance area where correction is possible, there is a strong resistance from the $3400 to $3600 area, you can sell 50% of your assets in this area if confirmed and add to your assets if corrected (I will indicate the buy areas in the next analysis).
If you have a cryptocurrency that you want us to analyze for you, you can write the name of the cryptocurrency in the comments, and wait for the analysis post (priority is given to the cryptocurrency that gets the most likes)
Don't miss our page in these bullish days of the market. (You won't lose

Ethereum (ETH): Looks Good, We Are Going For $3300-3400 EasilyWe are flying; Ethereum seems strong, so we are bullish on it. Our target of $3K was reached and broken easily, and now we are looking for the next resistance area to be reached, which is $3300-3400.
Targets are set; the first one got reached, and now we're heading towards the other 2 targets of ours!
Time for BINGX:ETHUSDT.P to shine.
Swallow Academy

Ethereum (ETH): Time For Ethereum To Shine | $3300-$3400The daily timeframe is showing no remorse to sellers, with buyers strongly dominating the zones after a local resistance area near $2800 was broken.
After that breakout we had a smaller sideways consolidation movement, here we formed a proper BOS and now price is heading towarsd the upper zones. we are tergeting the $3300 to $3400 are as of now, where we might see another sideways movement before a breakout.
Swallow Academy

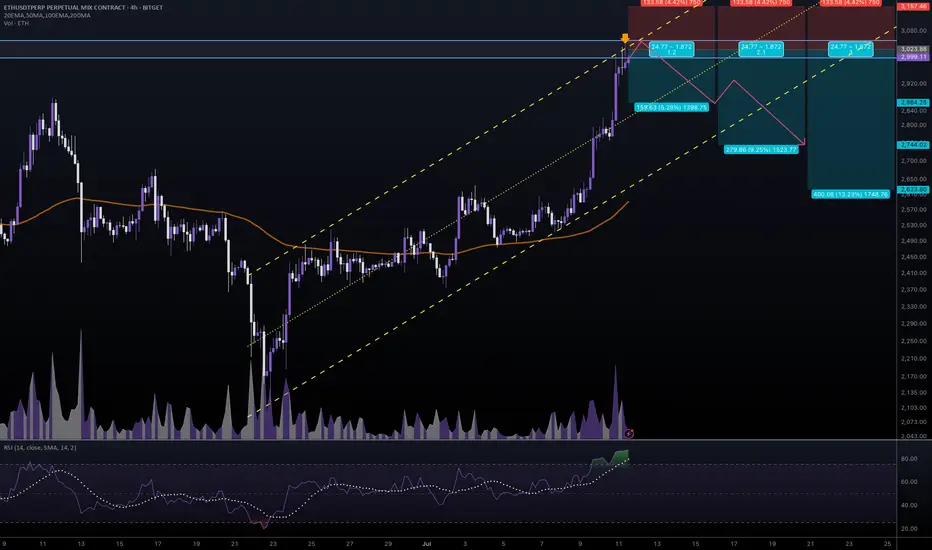
#ETHUSDT #4h (Bitget Futures) Ascending channel on resistanceEthereum printed a gravestone doji followed by a shooting star, RSI is overbought, local top seems in.
⚡️⚡️ #ETH/USDT ⚡️⚡️
Exchanges: Bitget Futures
Signal Type: Regular (Short)
Leverage: Isolated (9.0X)
Amount: 5.0%
Entry Zone:
2996.99 - 3050.49
Take-Profit Targets:
1) 2864.25
2) 2744.02
3) 2623.80
Stop Targets:
1) 3157.46
Published By: @Zblaba
CRYPTOCAP:ETH BITGET:ETHUSDT.P #4h #Ethereum #PoS ethereum.org
Risk/Reward= 1:1.2 | 1:2.1 | 1:3.0
Expected Profit= +47.5% | +83.3% | +119.0%
Possible Loss= -39.8%
Estimated Gaintime= 1-2 weeks
ETH Building Blocks - Keep it Simple🧱 Building Block - ETH Weekly Analysis 🧱
Ethereum has been trading within a well-defined structure, respecting key horizontal zones — each acting as a crucial building block in ETH’s macro journey.
🔹 Zone 1 ($1,700 - $2,100)
A strong demand and accumulation zone. ETH bounced from here multiple times, proving itself as the foundation of the current bullish attempt.
🔹 Zone 2 ($2,400 - $2,600)
We're currently hovering around this key mid-range resistance. A successful break above it would pave the way for the next major leg up.
🔹 Zone 3 ($2,900 - $3,400)
A major historical resistance turned supply area. ETH needs strong momentum and volume to break through this ceiling.
🔹 Zone 4 ($3,800 - $4,200)
The final building block before retesting ATH territory. A retest here could signal full bullish control in the coming months.
📍 As long as Zone 1 holds, ETH remains structurally bullish. Watch for breaks and rejections at each building block to gauge the next move.
Which block will ETH break next? 🔮
📚 Always follow your trading plan regarding entry, risk management, and trade management.
Good luck!
All Strategies Are Good; If Managed Properly!
~Rich

Is ETH overextended and due for a correction?For those holding ETH, this is a good point to set up a hedge using derivatives.
If the price keeps going up (which I think is unlikely at this moment—perhaps it will move sideways), buying at these levels is crazy.
In fact, there’s been a recent rally, full of people on X and YouTube saying this is the big moment to buy… That immediately raises a red flag for me!
And what about the FEDFUNDS? Have you taken a look? Haha, just something to think about.
--
After a long time away from TradingView and the community, I’m back to breathe some life into it!
Missed you all — let’s enjoy life and make the most of what it has to offer!
ETHUSDTThis movement downtrend. If breake 2.790 movr to 3.500$ but breke 2.200 move trend to 1.500$.

eth mini scalp simple trade using order block 15minutes , but its not powerfull ob so maybe can go to our sl , just manage the risk , dyor!

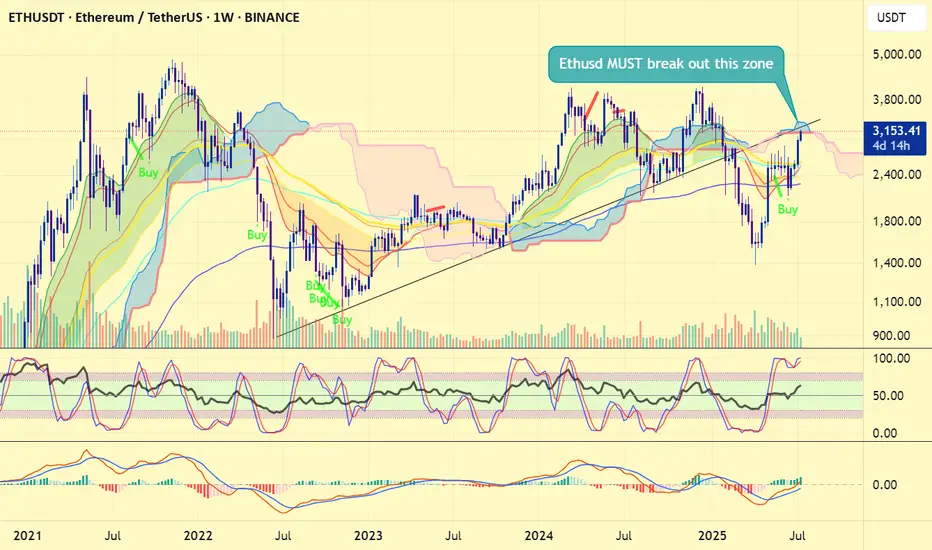
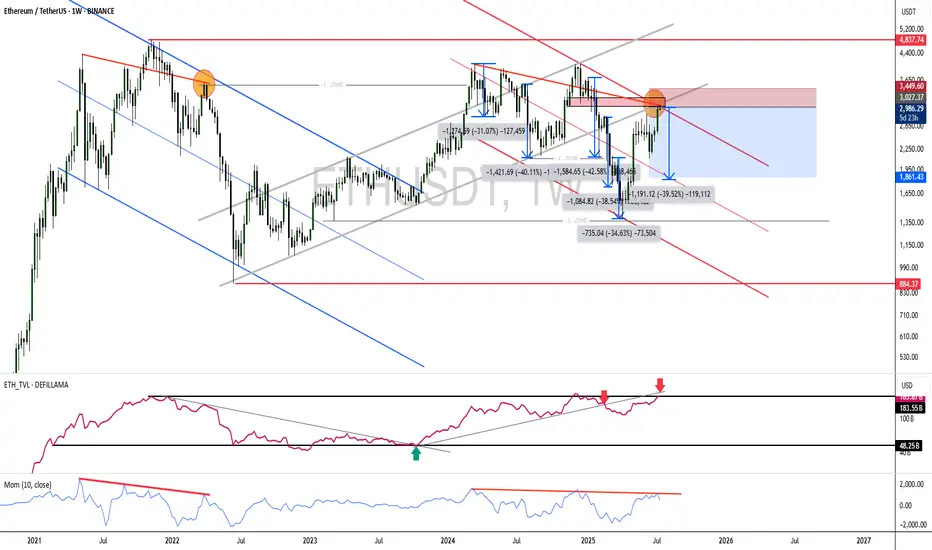
Ethereum price is critical now#ethereum #eth price is now testing very very important resistance zone now and this also the bearish retest if #ethusd fails to leap over 3500 usd. 4 months ago, #ethusdt breakdown the 3 years of trendline, heavily dumped below 1400 usd and bounced. Now, CRYPTOCAP:ETH is testing this 3 years of trendline resistance zone + weekly ichimoku cloud.
Therefore ETH price has no other chance to at least reclaim 3450 - 3500 usd. True bullrun requires a new ATH. Heavy declination at current zone will not be tasty. This week' s close will determine the things i think.
Not financial advice.