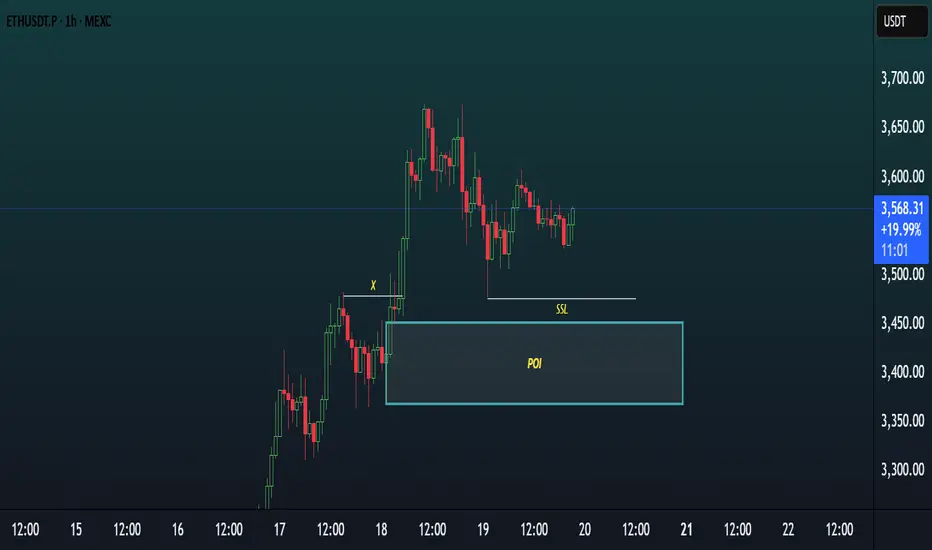
Chart Analysis (ETHUSDT, 1H)This chart showcases a Smart Money Concepts (SMC) style analysis on the 1-hour timeframe of ETHUSDT.P, focusing on a potential bullish setup.
Key Elements:
POI (Point of Interest)
A demand zone is clearly marked around the $3,400–$3,460 area, highlighted as a potential reversal zone where price may react bullishly.
SSL (Sell-Side Liquidity)
Sell-side liquidity has been swept below a recent low, indicating a possible liquidity grab before a reversal.
X (Previous Break of Structure)
Point “X” marks a significant BOS (Break of Structure) indicating bullish intent in prior price action.
Current Price Action
Price recently tapped into the POI, swept SSL, and is now consolidating slightly above the zone — suggesting accumulation or preparation for a bullish move.
Bias:
Bullish — Expecting a possible reversal or continuation to the upside after liquidity sweep and POI mitigation.
ETHUPUSDT trade ideas
Ethereum reached to our target
Ethereum reached to $3400 that we talked about since weeks ago, but now the daily RSI is at overbought area and we might see a correction.

Ethereum trading planBINANCE:ETHUSDT showed a minor pullback compared to Bitcoin. The price attempted to retest the $3,082 level again but faced strong rejection. Right now, $3,043 is acting as our reversal level - if we break through it, we've got a clear shot at our monthly target of $3,259. But as long as we're trading below this level, our immediate target is to test the $2,800-$2,700 range. More details are in yesterday's video analysis
Watch the triggers, and happy trading

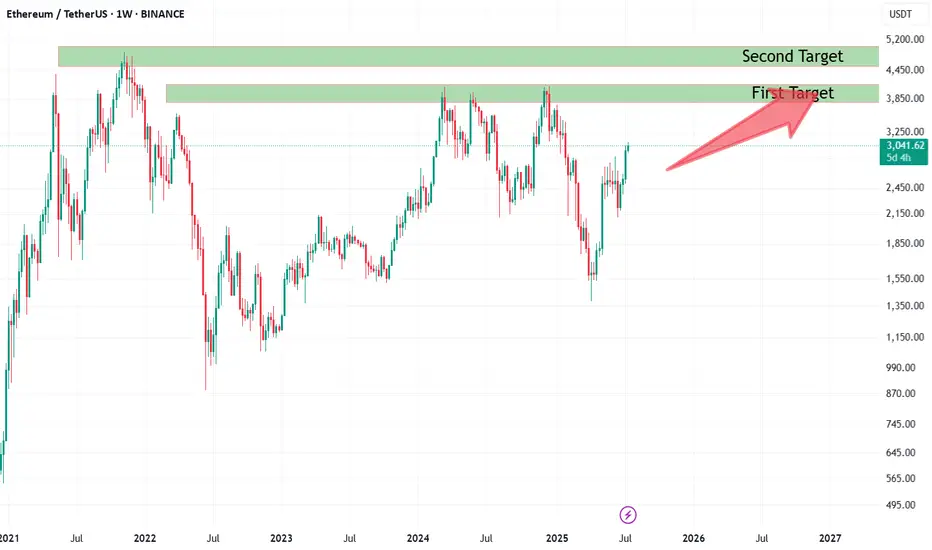
Binance Holds 25% of Exchange ETH: Smart Accumulation?According to cryptoonchain’s analysis of on-chain data from CryptoQuant, Binance now holds about 25% of the total Ethereum reserves across all exchanges. This significant figure could be a sign of smart accumulation by major market participants. Notably, Binance’s rising share has occurred while overall ETH reserves on exchanges have remained stable. In a situation where Ethereum’s price is still below its all-time highs—even as Bitcoin has set new records—this accumulation on Binance may signal that large investors are entering and expecting future price growth.
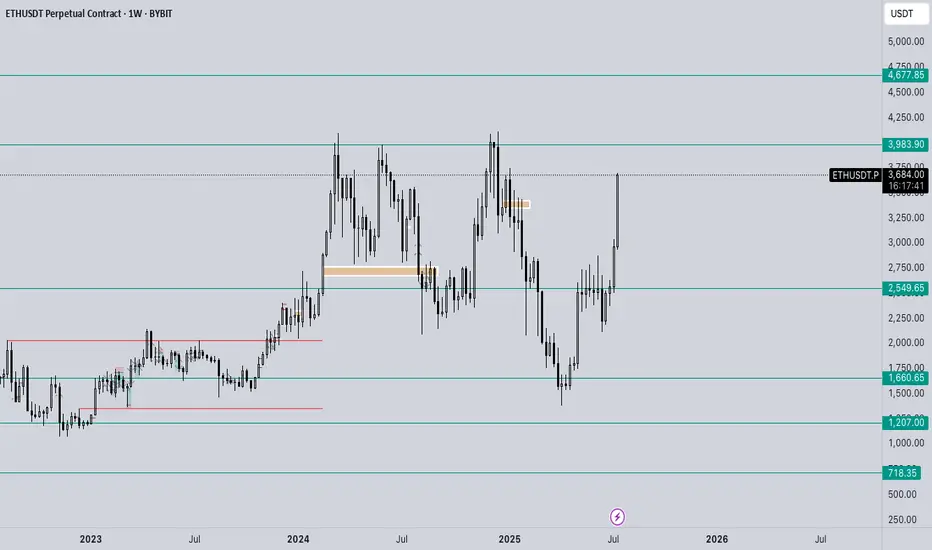
On the weekly chart, Ethereum is showing signs of strength and a possible continuation of its upward trend. If buyers maintain their momentum, the first target lies in the 3,900–4,200 zone, with the second target in the 4,850–4,950 range—close to previous all-time highs.
ETH - Realistic target $13799.6Taking this trade as its normally the first one to run in Alt Season, and although there is higher beta trades, this being a large cap should have smaller pullbacks.
Entry - 2879
Stop - 2111.6
Interval 1 - 3190
Interval 2 - 7405
Target - 13799.6

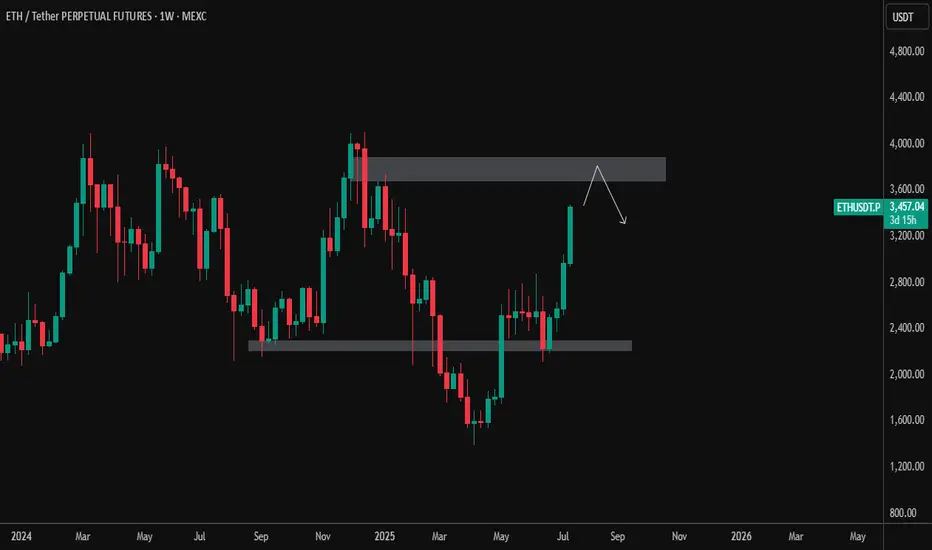
ETH/USDT – Weekly Chart Analysis (July 17, 2025)Ethereum has shown a strong bullish push, breaking above the prior consolidation zone between $2,400–$2,600. Price is now approaching a significant weekly supply zone between $3,800–$4,100 — a region that previously acted as a major reversal point.
🔹 Current Price: ~$3,460
🔹 Resistance Zone: $3,800–$4,100
🔹 Support Zone: $2,400–$2,600
📌 Possible Scenarios:
Rejection from resistance: ETH may test the upper supply zone and face selling pressure, triggering a pullback toward the mid-range or support.
Breakout & Close Above $4,100: Would signal strong bullish continuation with potential targets toward new highs.
📉 Watch for: Bearish price action near resistance or a potential lower high forming.
📈 Bullish Bias Confirmed if: Weekly close above $4,100 with volume support.
🧠 Patience is key at major levels. Let price action guide the next move.
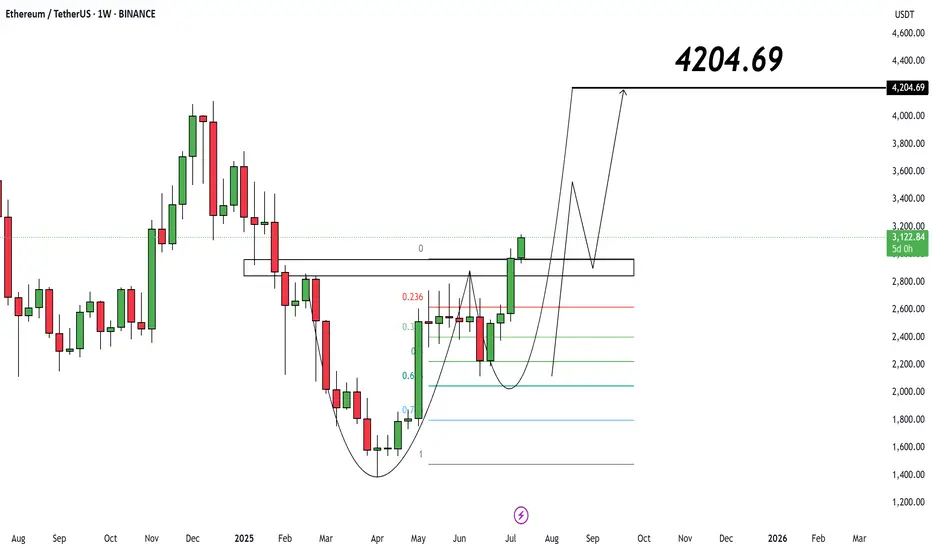
Ethereum ($ETH/USDT) – Weekly Analysis
Current Price: $3,127
📌 As long as ETH holds above $2,950, the bullish structure is intact.
🎯 Target:
• $4,204.69
🔍 Price is building momentum after multi-week consolidation. Pullbacks to $3K are potential re-entry zones.
Weekly trading plan for EthereumBINANCE:ETHUSDT Price has broken through the psychologically significant $3,000 level, but we're now seeing a clear 4-hour RSI divergence. Historical patterns suggest this divergence has a high probability of playing out. Expect potential correction initiation within the next 48 hours
Should the rally continue toward final targets:
The existing divergence may strengthen
A daily timeframe divergence could form
I'll await confirmation before considering short positions
As always, manage your risk wisely

ETH - Ranges overview (update) We've had some nice movements on ETH lately so let's have a look at where we are.
As previously discussed IF we reclaimed 2.5K we should expect the market to aggressively trade towards the HTF buyside (3.4K and 4K).
The buyside at 3.4K has been traded through already so no let's be PATIENT and see IF we get through 4K and higher.
As always WAIT FOR THE MARKET TO SHOW YOU ITS HAND.
Stay safe and never risk more than 1-5% of your capital per trade. The following analysis is merely a price action based analysis and does not constitute financial advice in any form.
$ETH - Scalps to Victory ~ 3011Scalps of eth which is missed and going to $3011 but it already moved from the point of movement! Touching soon!
ETHEREM ETHUSD LONG TECHNICAL CHART IDEAEthereum (ETHUSD) Technical Outlook – Short-Term Levels and Potential Targets
📊 Key Insights:
First Below Support: 2560 USDT
Starting Journey: 2600 USDT
Resistance Zone: 2630–2650 USDT
Target on Breakdown: 2440 USDT
Market Structure:
After a period of consolidation between 2560 and 2600, ETHUSD has initiated a sharp upward move towards the resistance zone near 2630–2650. The chart projects a possible rejection from this resistance area, suggesting a potential pullback targeting 2440 if support fails to hold.
✅ Key Considerations:
Watch for price action confirmation around 2630–2650.
A sustained break above resistance could invalidate the short-term bearish scenario.
The target zone of 2440 aligns with prior support and could offer buying interest

ETHEREUMEthereum Approximately $2,967.55 per ETH, watch for 30754 ascending trendline breakout or pull back into 2680 zone ,if we keep buying then 4100 zone will be on the look out as immediate supply roof break and close will expose 4900.my goal in this context is to see ETHUDT buy into my purple supply roof,it will happen .
Market Capitalization: Around $358 billion, making Ethereum the second-largest cryptocurrency by market cap.
Circulating Supply: About 120.7 million ETH.
Recent Performance: Ethereum has gained roughly 17.3% over the past week and about 7% over the last month, though it is down about 4% compared to one year ago.
Market and Technical Overview
Ethereum remains a key player in the blockchain ecosystem, supporting decentralized finance (DeFi), NFTs, and smart contract applications.
The price is consolidating near the $3,000 level, with technical indicators suggesting moderate bullish momentum but some short-term volatility.
Trading volume in the last 24 hours is around $29 billion, indicating strong liquidity and active market participation.
Ethereum continues to be a foundational blockchain platform with strong institutional interest and ongoing development, maintaining its position as a major digital asset in 2025.
#ethusdt #btc #bitcoin

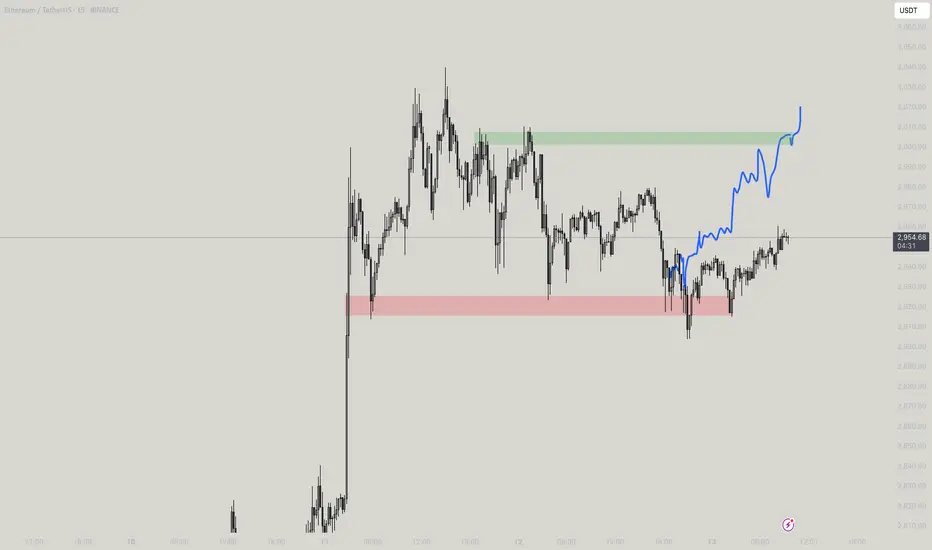
The Loudmouth Pattern: It Yells, We Trade!
On the 30-minute chart, ETH is forming a classic Broadening Formation – or as some traders like to call it, “The Big Mouth Pattern” 😄. It’s noisy, unpredictable at first glance, but when it speaks, you’d better listen.
Right now, price is moving through the bullish leg of this setup, and if momentum holds, we’re eyeing the $4,000 psychological level, followed by the $4,120 – $4,170 supply zone.
🔹 Bullish Scenario (our expected outlook):
🎯 Target 1: $4,000
🟩 Main Resistance: $4,120 – $4,170
❌ Invalidation: Confirmed close below $2,946
If price breaks and holds below that red support zone, this setup gets thrown out the window.
📊 Risk Management:
Scale in on pullbacks – if structure remains valid
No chasing without confirmation
Keep risk under 1% of total capital
📈 The market’s big mouth is open – and until it closes below $2,946, we’re listening for bullish signals. 🤑

$ETH: The 1-week chart is an absolute disaster!Once again, I want to make it clear: I’m naturally a bull. But I live in Thailand, far from the noise of influencers shouting "buy, buy, buy!" I’ve learned my lesson—when they scream buy, you get rekt. That’s why I rely solely on the charts.
Charts are just mathematics—they don’t lie. So here’s my honest interpretation of what I’m seeing for Ethereum:
🕐 Daily Outlook
Yes, we might see a few nice bounces in the short term. But if your plan is to hold ETH, you should be paying attention to higher timeframes, especially the weekly.
📉 Weekly Chart — It's Ugly
We’re clearly in a descending wedge, and overall, ETH is bearish. Don’t be fooled by the hype or the people trying to take your money.
- RSI is bearish, with a strong bearish divergence still unfolding.
- MACD is on the verge of a bearish crossover, and what’s worse, it’s doing that without even touching the neutral zone—a major red flag.
The last time we saw this setup? November 2021. The price crashed below $1,000.
🔍 Where’s the Support?
This cycle, the support zone looks closer to $1,500, mainly due to institutional interest and the ETF narrative. A full retracement seems unlikely, but technically speaking—it’s still a possibility.
🤔 Why Is This Happening Despite Institutional FOMO?
Here’s the key: ETH has staking, and every month, new CRYPTOCAP:ETH is minted to pay stakers. This creates constant inflation. On top of that, many stakers compound their rewards, accelerating the inflation. And guess what? These same stakers are selling as soon as ETH pumps.
So fundamentally, Ethereum is under pressure because of its own staking mechanics—a system flaw that creates long-term selling pressure.
Do your own research (DYOR). I could be wrong—but at least I’m not trying to sell you a course.

DeGRAM | ETHUSD above the resistance area📊 Technical Analysis
● Price burst through the 12-week compression roof, converting the 2 990 supply into support and printing the strongest close since March.
● The pull-back just retested both the purple trend-fan and the 2 960 flip zone; the active rising channel and flag depth map the next magnet at 3 410.
💡 Fundamental Analysis
● SEC’s 12 Jul request for updated spot-ETH ETF S-1s hints at imminent approval, fuelling fresh inflows.
● Glassnode reports the largest daily net-staking deposit since April, reducing exchange float and adding bid pressure.
✨ Summary
Long 2 960-3 000; holding above 2 990 targets 3 110 → 3 410. Bias void on an H4 close below 2 860.
-------------------
Share your opinion in the comments and support the idea with like. Thanks for your support!

ETHEREUM BREAKOUT CONFIRMED!Hey Traders!
If you’re finding value in this analysis, smash that 👍 and hit Follow for high-accuracy trade setups that actually deliver!
After months of consolidation inside this massive symmetrical triangle, ETH finally breaks out on the daily chart—and this could be the spark for the next major rally! 🔥
📈 Structure: Symmetrical Triangle
✅ Breakout Confirmed
📍 CMP: ~$2,760
🎯 Next Major Target: $5,000+
This is the breakout bulls have been waiting for! If momentum sustains, ETH could enter price discovery territory soon. Buckle up—the real move might just be beginning. 🚀
Let’s see how far it runs from here!
Drop your targets in the comments 👇

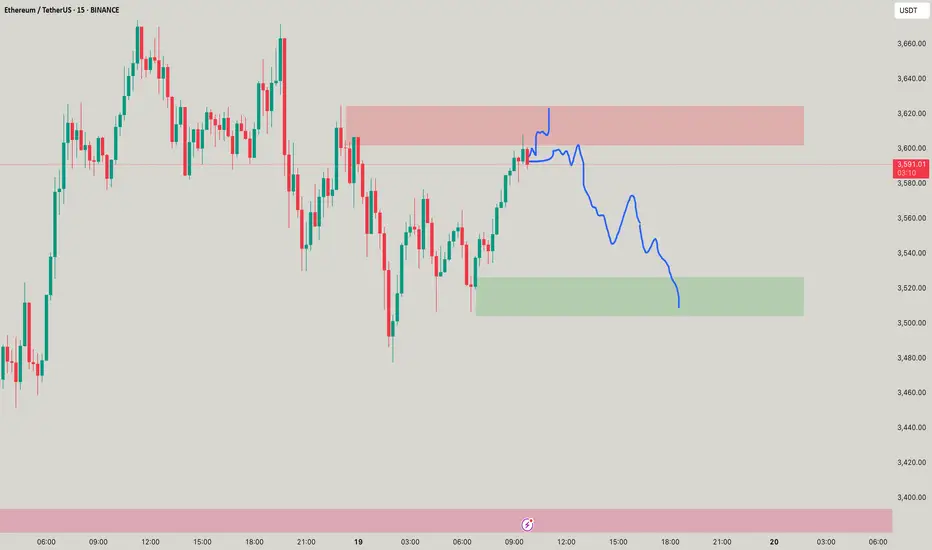
ETH SCALP SHORT RR 3:1 Ethereum just hit weekly level with two 15min lower high and lower low. Rules are telling us to not short against trend, but there can be hedge for long positions.
I don't ask to trade more then 0.5 % capital per trade.

ETH Buy Zone AlertETH Buy Zone Alert 🚨 | Eyes on 3340 & 3291
Ethereum is entering a strong demand zone between $3340 and $3291 — this could be a great long opportunity if price reacts well.
Short-term targets to watch: $3420 and then $3500.
Don’t sleep on this setup — keep it on your radar! 👀
📈 Follow for more actionable trade setups and real-time market updates.

#ETHUSDT: Time For Big Price Distribution! Get Ready $5000ETH is currently in distribution and is on our target list. We expect a smooth price movement, potentially reaching $3100, $3800, and $5000. Use the entry zone to take a position; anything below the entry will invalidate the idea. Please use accurate risk management while trading.
Like, comment, and share this idea to encourage us to post more.
Team Setupsfx_

You need smol Scalps for ETH!ETH SMOL scalps but u know it takes your liquidity on top blowing ur accounf! Keep mindful where the trade goes! good short oppurtunity!
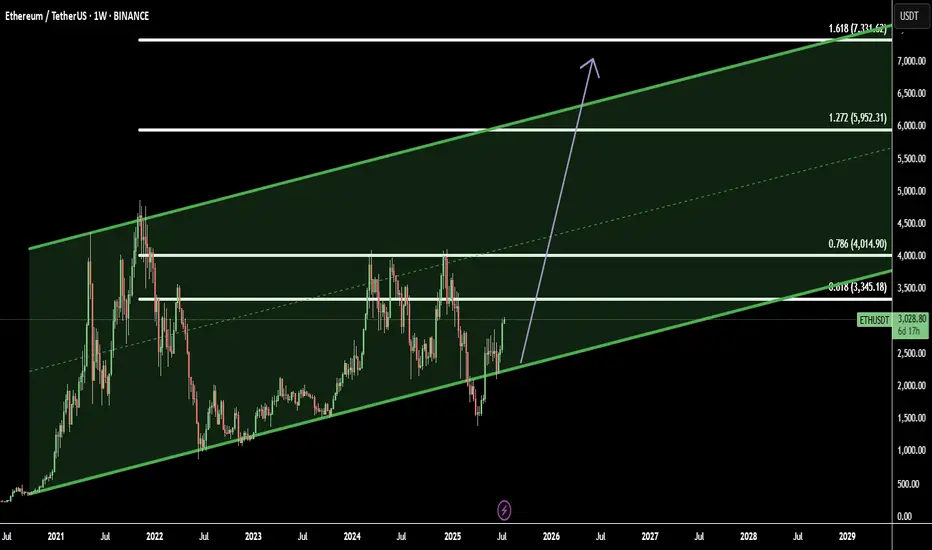
Ethereum in Ascending Channel: Targeting Weekly Breakout ZonesEthereum (ETHUSD) is currently trading within a well-defined ascending channel on the weekly timeframe, indicating sustained bullish momentum. This structure suggests higher lows and higher highs, consistent with a long-term uptrend.
Based on this formation, I’ve identified four key target zones as ETH continues to respect the channel boundaries:
Target 3345.18: Initial resistance area, likely a short-term reaction zone
Target 4014.90: Mid-channel resistance — potential consolidation point
Target 5952.31: Upper bound of the channel — critical breakout test
Target 7331.62: Extension level — price discovery zone if breakout is confirmed
Traders should monitor price action closely near each level. A strong breakout above the channel top could signal continuation toward uncharted highs, while a breakdown may invalidate the pattern.
Disclaimer: This is not financial advice. Please do your own research and manage risk accordingly.
ETHUSDT - Limited Return PriceEthereum is a reliable network for financial transfers and transactions and can be considered the second most popular digital currency after Bitcoin. Currently, this currency has reached the price range of $2,500 with temporary decreases, but this price is at its lowest level and the probability of liquidity entering this price area is very high. This price level can be used for long-term investment. I specify two targets for this price area: $4,000-5,000.
Sasha Charkhchian

#ETH look for the false breakoutany false break out to the area of
2400-2500
will be a good buy sign with stop below 3200 and target 4300
trade safe and follow me 😉
