Important midweek ETH update.In just four days, ETH has impressively climbed 19.37%, achieving a substantial trading volume of 34.9 million, indicative of both renewed interest and heightened speculative activity. This sharp move follows two intensely impulsive trading days that thrust price upwards aggressively, followed immediately by two days of intermittent volatility and macro consolidation—perfectly manifesting the anticipated Bart Simpson pattern previously identified and traded with clinical precision.
Our initial boundary of the macro distribution zone at 2470 marked a critical juncture. ETH faced vehement rejection here, forming a violent wick as price sharply retraced, providing us with the ideal entry for our hedge short. This level—keenly highlighted in prior analyses—initiated a cascade of rapid selling pressure, driving price down with impressive velocity and ferocity directly into the pre-established supply zone. This pullback validated our short, subsequently propelling price downward into demand territory at approximately 2380, where immediate liquidity absorption occurred, confirming demand strength.
Notably, ETH’s rapid recovery during the early Asian session surged back towards the optimal trade entry (OTE) region of the redistribution zone, affirming both market efficiency and the dynamic liquidity interplay present. This cyclical behavior reinforces the significance of clearly defined supply and demand zones, which have acted as robust reference points throughout this trading period.
At this juncture, ETH finds itself at a critical crossroad—a profound decision point characterized by considerable uncertainty. Three distinct scenarios now dominate trader psychology and technical rationale:
Liquidity Hunt Scenario: ETH could swiftly retrace to retest the mean, specifically targeting liquidity pools located near the spring wick from the latest impulse. Such a move would serve to shake out weak longs and solidify the market structure before another upward thrust.
Continuation Scenario: A bullish advance could propel ETH towards testing the upper boundary of the overarching macro symmetrical triangle, aligning with continued momentum and suggesting further bullish intent supported by current oscillatory readings.
Worst-Case Scenario (LL Scenario): The alternative, more extreme scenario involves ETH breaching structural integrity, aggressively flushing out late entrants with a sharp lower low (LL). While perceived as unlikely given recent volume and market resilience, this outcome cannot be discounted—particularly given global macroeconomic uncertainty and geopolitical tensions.
Several exogenous factors compound this uncertainty, most notably ongoing international conflicts and recent market sensitivities tied to off-the-cuff comments from influential figures such as former President Donald Trump. These events amplify volatility potential, exerting tangible influence upon investor sentiment and market positioning.
Analyzing the market structurally, ETH price action is now interacting directly at the apex of the current triangle structure, precisely aligning with the 50% Fibonacci retracement of the recent range—a pivotal area frequently respected by both algorithmic and discretionary traders. Complementing this technical view, oscillators such as the Relative Strength Index (RSI) currently hold a neutral stance at exactly 50%, highlighting equilibrium in buying and selling pressure and reinforcing the indecisive nature of the current market environment.
However, adding weight to bullish sentiment in the near term, the Commodity Channel Index (CCI) presently indicates upward momentum, suggesting possible further upside if sustained during today's London and subsequent New York sessions. Consequently, immediate trading decisions should remain sensitive to intraday price behavior around these critical junctures.
If you've closely tracked my analyses—especially the detailed insights shared in the recent macro Bart Simpson formation update—you'll likely have secured the short precisely at the 2503 rejection point, efficiently hedging against any potential drawdown from open long positions established lower down. This strategy exemplifies disciplined trading, strategically balancing risk and reward, capitalizing on clearly defined market structures and critical levels.
Summarizing the current state of play with utmost clarity, ETH stands delicately poised between bullish confirmation and bearish capitulation. Intraday sessions in the coming hours, notably London open and subsequently New York open, are expected to provide the decisive directional impulse. Traders should actively monitor price response at these critical levels, maintaining protective hedges where necessary while remaining flexible and adaptive to emerging market dynamics.
In conclusion, ETH’s immediate trajectory hinges upon nuanced market reactions at this strategically significant confluence point. Stay vigilant, as ETH approaches a potentially transformative decision—one offering both substantial opportunity and considerable risk, contingent upon disciplined execution and strategic clarity in your trading approach.
ETHUPUSDT trade ideas

ETH: Short 23/06/25Trade Direction:
ETH Short
Risk Management:
- 0.5% risk allocation
Reason for Entry:
- Tagged and rejected from Daily FVG
- Market sentiment remains bearish across macro and crypto
- News flow is strongly risk-off. Qatar has closed flights, UK and US citizens issued shelter in place warnings aswell
- Heightened geopolitical risk from possible Iranian escalation, with largest US base in the region
- 0.718 rejection

ETH/USDT Bullish Reversal Analysis Chart Overview:
Ethereum (ETH) has shown a strong bullish reversal from the support zone near $2,200, forming a V-shaped recovery pattern. The price is currently trading around $2,450, with upward momentum targeting the next key resistance level.
📌 Key Technical Highlights:
✅ Support Zone:
Clearly respected at $2,200 – $2,300 range
Multiple candle wicks suggest strong buyer interest
✅ Resistance Zone:
Major resistance expected around $2,900
Historical rejection indicates potential selling pressure
✅ Target Level:
Short-term target marked at $2,610 🟣
If momentum sustains, price could push towards this zone before facing resistance
📈 Bullish Momentum:
Strong breakout from downtrend channel
Formation of higher highs and higher lows
Price action respecting upward trend structure
🛠 Pattern Structure:
Reversal pattern after corrective phase
Bullish engulfing candles suggest continuation
📊 Forecast Path:
Two potential scenarios are outlined:
📈 A clean push to the $2,610 target, followed by consolidation
🔄 A short pullback to $2,374 before continuation to the target
⚠️ Conclusion:
ETH/USDT is showing bullish signs with potential to reach $2,610. Watch for consolidation or pullbacks as buying opportunities, but be cautious of heavy resistance above $2,900. Ideal for short- to mid-term bullish setups

ETH Update: A Possible Rebound!ETH Weekly Update
ETH has formed a support trendline in the $1500–$1600 range and previously rebounded from it with a 90% gain. After a retest, it’s once again showing signs of a potential rebound from the $2100 level.
If this rebound holds, it could bring relief to price momentum, and we may see ETH retesting the $3500 zone. The RSI still has plenty of room to expand, suggesting further bullish potential.
Strategy:
~ Entry: $2100 to Current Market Price (CMP)
~ Accumulation Range: $1500–$1600
~ Trade Type: Spot
~ Holding Period: Q4 2025
~ Target: $3500
Note: Always do your own research and analysis before making any decisions. This is not financial advice.
Regards,
Dexter

ETHEREUM → Rally and liquidity capture. Up or down?BINANCE:ETHUSDT.P is strengthening following Bitcoin. This is a reaction to developments in the Middle East, namely Trump's comments on peace. But there are doubts...
The crypto market is reacting to the situation in the Middle East, namely Trump's statements about peace. But apart from him, no one else is talking about peace. No agreements have been reached, so the level of risk is quite high.
Another nuance hinting at the general mood in the market: 66% of the largest traders on Hyperliquid are currently shorting crypto — Cointelegraph
ETH, technically, has stopped in the trend resistance zone as part of a local rally in the Pacific session.
If there is not enough potential to break through the trend resistance and the price forms a false breakout of 2390, the local trend may continue
Resistance levels: 2433, 2475
Support levels: 2390, 2313
The inability to continue growth will confirm the fact of bearish pressure (market distrust of the bullish momentum). The past momentum, in hindsight, can be considered manipulation (liquidity capture). Consolidation below 2390 may trigger a decline.
Best regards, R. Linda!

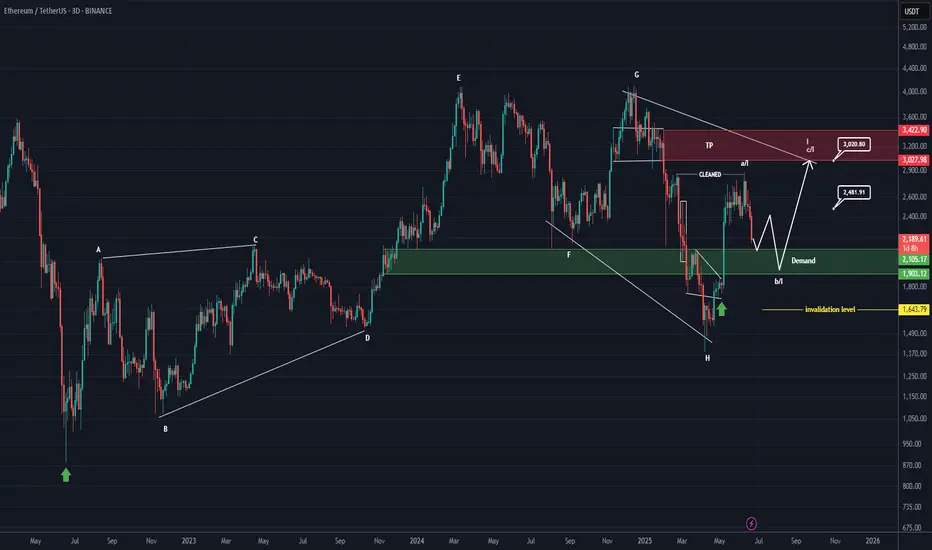
ETHEREUM Analysis (3D)First of all, pay close attention to the timeframe | it's a higher timeframe.
From the point where we placed the green arrow on the chart, Ethereum appears to have entered a bullish phase | specifically, a symmetrical pattern.
It currently seems to be in wave I of this symmetrical structure, which is the final wave. Wave I itself appears to be composed of three parts (ABC). At the moment, Ethereum seems to be in wave b of wave I.
We expect wave b of I to complete within the green zone, after which the price would move into wave c of I.
The price seems inclined to complete wave b of I near the bottom of the green zone.
Targets are marked on the chart.
In the green zone, it’s no longer reasonable to look for Sell/Short positions, especially when the price is approaching the bottom of the green area.
A weekly candle close below the green zone would invalidate this analysis.
For risk management, please don't forget stop loss and capital management
When we reach the first target, save some profit and then change the stop to entry
Comment if you have any questions
Thank You
Ethereum (ETH): Buyers Taking Back Control!Ethereum had a nasty fall both on Sunday and Saturday where price dipped from $2500 to $2100.
Despite that movement took place during the weekends it was harsh one and we are expecting osme kidn of re-test to happen towards the local broken area (near 200EMA).
Swallow Academy

Will ETH be able to return to the key level of $2,500?⚡️ Hello, everyone!
Over the weekend, Bitcoin and the entire market fell sharply due to geopolitical instability. ETH reached $2,120! And now it is trading at $2,440. However, as long as the price remains below the psychological level of $2,500, this is definitely a bearish signal.
❓ And the main question arises: will ETH be able to return to the $2,500 level and above, continuing its growth? Let's figure it out:
As I said in my previous review, ETH began to close the GAP from below at the levels of $2,470 - $1,855. However, there is also a GAP from above at the levels of $2,807 - $3,260. And after closing the current one, the next target will be this one. After all, as we know, 99% of GAPs close sooner or later.
📊 The price is in a flag pattern, and the first squeeze of the sloping support of the figure led to a price increase from $1,390 to $2,880 at its peak. However, the next test is unlikely to go so low, and therefore will not have the same effect. Therefore, the ETH price will likely continue to squeeze until it breaks one of the slopes, setting the direction.
⚙️ Metrics and indicators:
Money Flow - fresh liquidity has been flowing into ETH for almost a year now! Even despite the correction, the inflow has only been increasing since August 2024.
Liquidity Depth - as we know, the price moves from one liquidity zone to another. And now, there is significantly more liquidity concentrated at the top than at the bottom. This means that it is much easier to move the price up.
📌 Conclusion:
I'm not trying to say that ETH will skyrocket right now. But it's definitely not where it should be. And when it goes up, it will go up a lot, and we need to be ready for that.
I don't think we'll see levels of $1,500 and below again. But $1,800 at the end of summer or beginning of fall is quite realistic.
So be patient, we'll definitely get our chance!

HolderStat┆ETHUSD formed the rising bottomBINANCE:ETHUSDT on the 16h chart is pressing upward inside a steep channel after reclaiming $2,300. Momentum is driving the price toward $2,800 and possibly $3,400. Previous breakouts from consolidation zones support the bullish bias.


Long trade
🟢 Trade Journal Entry – Buyside Trade
📍 Pair: ETHUSDT
📅 Date: Monday, June 23, 2025
🕒 Time: 8:00 AM (NY Session AM)
⏱ Time Frame: (Assumed 4Hr TF)
📈 Direction: Buyside
📊 Trade Breakdown:
Metric Value
Entry Price 2422.81
Profit Level 2474.60 (+2.14%)
Stop Loss 2415.04 (−4.08%)
Risk-Reward
Ratio 2.91 : 1
🧠 Context / Trade Notes:
NY Session AM Execution:
Trade entered at the start of the New York session, aiming to capture directional momentum amid strong ETH volatility.
Liquidity Sweep Confirmation:
Clear stop-hunt below prior swing low sets up the reversal conditions

False Breakdown on ETH – Bulls Back in Control?CRYPTOCAP:ETH just pulled a classic fakeout move — breaking below a key support and rising trendline, only to snap right back above it.
This false breakdown caught the bears off guard, and now price has reclaimed the support zone with strength.
As long as ETH holds above this reclaimed level, we could see a short-term push higher. Watch for follow-through, bulls need to keep the momentum alive.

ETHUSDTThis is very easy...
best support level 2300 to 2500 for jump price. but was needed for jump price for get enrgy for movement to high levels by fake breakout.
First level of resistance 2800 to 3000.
⚠️Control Money Management in your capital.

ETHUSDT minor trendsEthereum BINANCE:ETHUSDT is downtrend with lower highs from the bottom is nearly finished 📉 . For a stronger rise, it needs to stabilize above $2500 ⚡. Mid-term targets are $3300 (end of second leg) and $3700 (major resistance) 🎯. Key supports are $2500, $2070, $1800, and $1550, the base where the uptrend began 🛡️.
Supports & Resistances:
Supports: \$2500, \$2070, \$1800, \$1550
Resistances: \$2500 (critical level), \$3300, \$3700

[SeoVereign] ETHEREUM Bearish Outlook – June 27, 2025We are the SeoVereign Trading Team.
With sharp insight and precise analysis, we regularly share trading ideas on Bitcoin and other major assets—always guided by structure, sentiment, and momentum.
🔔 Follow us to never miss a market update.
🚀 Boosts provide strong motivation and drive to the SeoVereign team.
--------------------------------------------------------------------------------------------------------
Hello,
I would like to present a bearish outlook on Ethereum as of June 27, 2025.
In the most recent Bitcoin idea I shared on the 22nd, I explained the reason for setting the take-profit zone at 98,875 and mentioned the possibility of a short-term rebound. Amidst the ongoing war risks in the Middle East that are shaking the overall crypto market, the market has shown a successful rebound, with Bitcoin at the center of this movement.
However, this upward movement has been limited to Bitcoin alone, while other major altcoins have shown weak and sluggish rebounds. In such a situation, when predicting a future decline and considering short positions, I believe it is strategically more advantageous to target altcoins rather than Bitcoin. The inability to properly rebound suggests a momentum issue, which is likely to lead to relative weakness in the market.
Many investors tend to short Bitcoin simply because it has risen significantly in price, but this is a beginner-level mistake. Taking a short position solely based on a large price increase carries high risk, and it is more rational to base strategies on altcoins that are failing to gain upward momentum.
From this perspective, I was preparing the basis for a short position in this idea, and as a technical confirmation signal has appeared, I now present a short strategy for Ethereum. The first target is set around the 2,357 level.
If the movement unfolds, I will further explain the analytical thinking that made it possible to anticipate this decline, along with additional key points to monitor in the market.
Thank you.

Weekly trading plan for Ethereum BINANCE:ETHUSDT After the weekend, the price showed a solid recovery and is now attempting to break above the recent low at $2,436. If the breakout succeeds, we could see a move toward the marked resistance levels. Alternatively, we might get a local pullback before further upside. However, if the Pivot Point is broken to the downside, there’s a chance we’ll see a continuation of the bearish move
Write a comment with your coins & hit the like button and I will make an analysis for you
The author's opinion may differ from yours,
Consider your risks.
Wish you successful trades ! mura

ETH/USDTI think it's time for Ethereum to grow and we should wait for higher targets from Ethereum. Tell me what you think.

Ethereum (ETH): Attentions at 200EMA | Targeting Local HighEthereum is back near EMAs after a nasty drop we had recently due to news we had. Now it is basically the waiting game, where we just wait for confirmations of either a breakout from here or a rejection and movement back to lower zones.
We are looking more for the breakout scenario just based on the buyside volume we had recently, which showed the dominance of buyers!
Swallow Academy

Ethereum (ETH): Lost Control Over 200EMA Ethereum has lost control over the 200EMA, where we had a strong sell-side movement due to the US news.
As this was the movement during the weekends, now we are looking for recovery to happen at least a couple of days from now on, which would mean that buyers will take back the control over the 200EMA.
This line will decide the next major trend area for the coin!
Swallow Academy

ETHEREUM accumulated and ready to goOn a very negative news price is drop to POI of the dealer and well accumulated. We believe that next bullish move about to happen

ETHAs seen on the ETH chart, after breaking the upward trend, it performs a retest on the downward trend and creates the second peak of the downtrend by taking liquidity. All the moving averages (7, 25, 50, 100, 200) have converged, reinforcing and supporting the trend.
We have 3 scenarios here:
Wait for a break of the downtrend and enter a trade with a reversal candle.
Wait for the moving averages to act as support.
Wait for support from the block order zone around the 500 level — this is the worst-case scenario.
If the first two scenarios happen together, it could push us significantly higher.
At this point, only short positions are advisable — but they must be adjusted according to risk.
Everything written here is based on the weekly chart. It is possible to trade on lower timeframes, but don’t forget — the overall trend is still down.

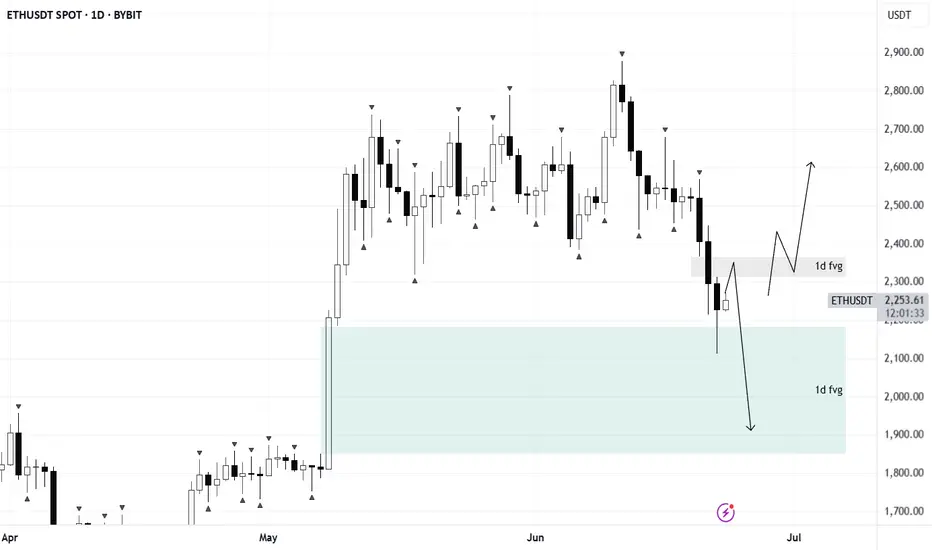
ETH/USDTPrice has entered a daily long FVG zone. For long setups to be valid, we’d like to see a short FVG inversion play out.
If no bullish reaction follows, the bias shifts to shorts — with potential downside targets in the $2000–$1800 range. Wait for confirmation before taking action.