ETHUSDT Long / Buy SetupMust take from the entry and USE tight SL. Can be a fakeout, if real breakout then tps are mentioned. In case sl hit, use the previous setup, it's still valid. While for short I'm still waiting for 3k or above.
ETHUPUSDT trade ideas

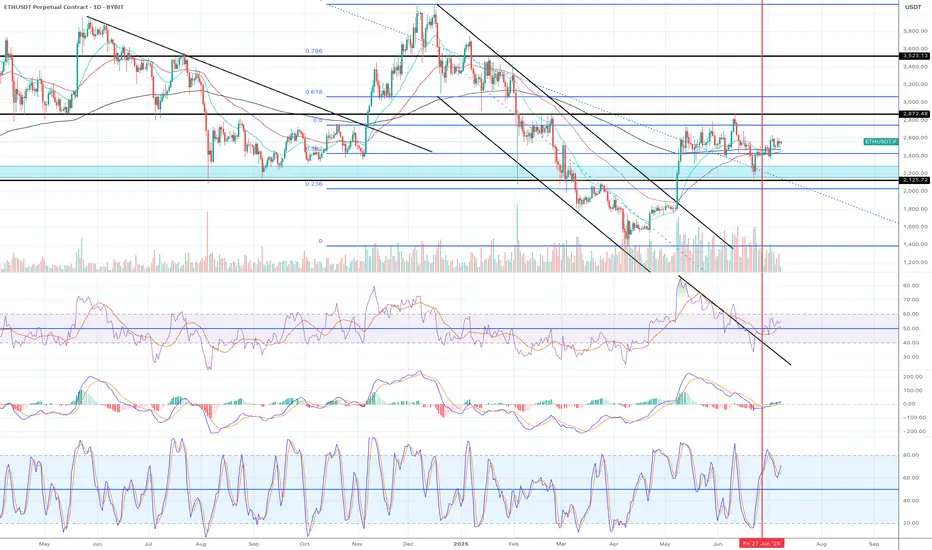
Ethereum Facing Key Resistance, Breakout or Fakeout?ETH is pressing into major horizontal resistance near $2,600 after breaking out from a double-bottom structure. Price is moving within a wide range capped near $2,900 and supported by the 0.5 and 0.618 fib zones.
🟢 Scenario 1 – Bullish:
Clean break and hold above $2,600 opens room to test the top of the range around $2,900. Watch for a higher low retest to confirm strength.
🔴 Scenario 2 – Bearish:
Rejection here could send ETH back toward $2,340 (0.5 fib) or even $2,220 (0.618). The stochastic RSI is approaching overbought, signaling caution.
This chart is for educational purposes only — not financial advice.

Time to go long!!
1) A candle broke out and closed above the descending parallel channel.
2) The price has been consolidating above Fib0.0382 level for weeks.
3) The recent candles are sitting above EMA21.
4) EMA 21 is above EMA55.
5) EMA200 is running horizontally still but it is getting close to cross EMA55.
6) All momentum indicators are in the bull zone and still plenty to go before it hits overbought territory.
There might be a strong breakout to the upside.
It is time to go long.
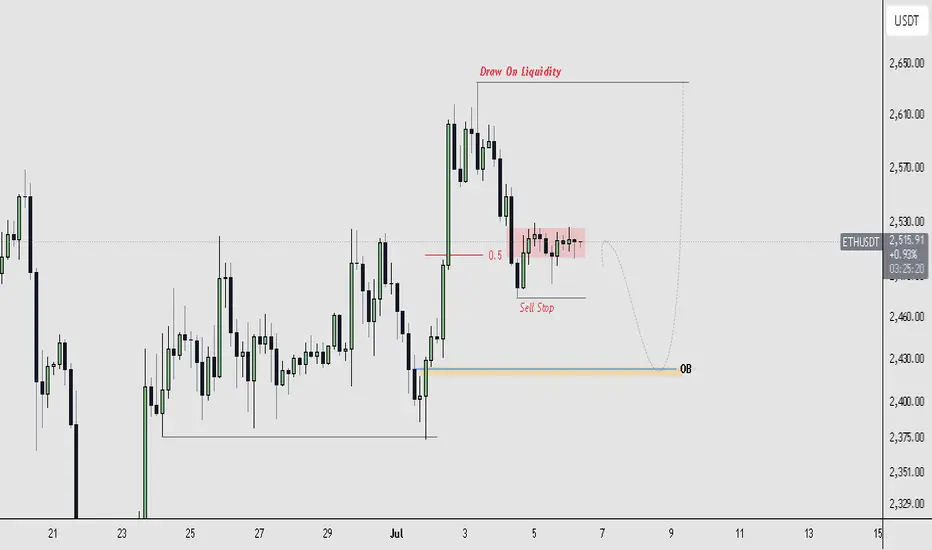
$ETH - SELL to BUY BiasOn the Daily Timeframe, Ethereum cleared the liquidity sitting on the $1755 zone and bounced off the support around $1500 region. It then rallied hard and swept the liquidity at $2800 , doubling and confirming it as a solid Resistance zone.
Using strong buy rejection and good volume as confirmation, a sell from the $2700 - $2750 zone is feasible, with target at the liquidity sitting at $2100 - $2110 zone.
We then, can consider buying from any POI below that zone.
Remember to REACT and not PREDICT. DYOR‼️

Ethereum Faces Key Resistance: Potential Pullback AheadHello Guys!
What I see:
Head and Shoulders Pattern:
Left Shoulder: Formed
Head: Peak, followed by a drop.
Right Shoulder: Formed.
The neckline break around $2,450 initiated a downside move, confirming the bearish setup.
Current Price Action:
ETH is currently trading near $2,519, attempting to reclaim the broken neckline zone, which now acts as resistance.
The price action is showing lower highs, hinting at weakening bullish momentum.
Bearish Retest in Progress:
The chart shows an anticipated bearish retest of the support-resistance flip zone ($2,530–$2,550), with a probable rejection leading ETH back down toward the $2,440–$2,450 support zone.
Demand Zone:
A strong demand area is visible between $2,420–$2,450. Price may revisit this zone before making the next major move.
Trend Channel:
ETH is moving within an ascending channel, and the lower bound coincides with the highlighted demand zone.
________________________
Let's check this deja vu:
You can see that previously the price formed an H&S and after that did a hunting of the head! And after that price experienced a drop there! Same scenario here!

Ethereum Wave Analysis – 9 July 2025- Ethereum broke the resistance area
- Likely to rise to resistance level 2885.00
Ethereum cryptocurrency recently broke the resistance area located between the resistance level 2645.00 (which stopped wave 1 at the start of July) and the resistance trendline of the weekly Triangle from January.
The breakout of this resistance area accelerated the active short-term impulse wave 3 of the intermediate impulse wave (3) from June.
Given the strongly bullish sentiment seen across the crypto markets today, Ethereum cryptocurrency can be expected to rise to the next resistance level 2885.00 (top of wave (1) from June).

ETH Gearing Up for Lift-Off — Eyes on $4,000+ETH Weekly Outlook
ETH is currently trading around $2,660 on the weekly timeframe and holding up well at these levels.
If the momentum continues, the upper resistance zone near $3,550 could act like a magnet — pulling price higher. A breakout above this zone may trigger a strong rally toward $4,000+.
And when ETH starts to move big… altcoins usually follow.
Keep an eye on it. The next few weeks could get interesting.
DYOR, NFA

Weekly trading plan for EthereumLast week's price action followed our bullish scenario perfectly. Currently trading above the weekly pivot point, we've already hit target 1. Now anticipating target 2 - either directly or after a local pullback. However, if we lose the pivot with no buyer recovery, expect downside momentum toward support. Also explained the $2,112 target rationale in the video analysis
Which scenario do you think will play out? 👀

ETH FAST TRADE [15M]📝 My ETH Short Idea (Test Trade)
This is a test idea where I’m simply practicing my analysis and trade execution. It’s built entirely on my own personal strategy, so it’s primarily for self-development and tracking.
💡 The main setup:
I’m looking for a short position on ETH, but this idea will only be valid if all my levels and conditions align exactly.
Otherwise, I’ll skip the trade.
📌 How to enter:
I’ve detailed exactly how to enter the trade:
Wait for my specific trigger conditions to be met (price levels + confirmation by my indicators).
Enter only after the setup is fully formed — no early entries.
Manage risk properly with stop-losses beyond key invalidation levels.
Scale in only if price structure continues to validate my scenario.
⚠️ Important:
This is not financial advice. I’m using this idea mainly to test and refine my strategy. Sharing it here for transparency and to improve my analytical discipline.
✅ Plan:
If the setup completes exactly as planned, I’ll look for targets according to my strategy’s rules, trailing stops along the way.

ETH/USDT Chart Analysis (4H)
ETH has been trading inside a symmetrical triangle (shown by converging black trendlines).
A breakout has occurred above the descending trendline, signaling bullish momentum.
The rising diagonal trendline from late June is acting as strong support.
Ichimoku Cloud:
ETH is above the cloud, indicating a bullish bias.
The cloud below the price is green and fairly thin, suggesting modest support if the price dips back.
Key Levels:
Resistance Zone: $2,650–$2,700 (upper breakout zone).
Immediate Support: $2,550 trendline area.
Major Support Zone: $2,250–$2,450 (large yellow box). This has previously served as a significant accumulation zone.
Potential Scenario:
The price may retest the broken triangle trendline around $2,550–$2,570 (as indicated by the wavy projection on your chart).
Holding above this level could fuel a rally toward $2,750–$2,850 next.
Losing $2,550 would expose ETH back toward the bigger yellow support zone.
Short-Term Outlook:
Momentum favors bulls as long as ETH stays above ~$2,550.
Watch for volume on any move above $2,650 to confirm continuation toward higher targets.
Conclusion:
ETH has broken its triangle resistance and looks poised for further upside. A successful retest near $2,550–$2,570 could launch the next leg higher toward $2,750–$2,850.
Stay tuned for updates and key levels to watch!
Thanks for your support!
DYOR. NFA

Ethereum (ETH): Buyers Showing Dominance | $2800 IncomingBuyers are doing a great job currently, keeping the price above the EMAs (which also have been marked by us as a retest area after we did that break of structure on the 2nd of July).
Now as long as we are above our buy zone, we are bullish on ETH. As many know, we are far away from the potential of ETH and the first target is at $2800-$3000.
Swallow Academy

Ethereum (ETH): Buyers Back in Control | From $2570 to $2800?Ethereum is still strong on the 1D timeframe, we are seeing the EMAs being controlled by buyers and secured, which is opening for us the gap to move towards the $2800 area.
What we want to see now is a proper BOS on the current timeframe at $2600, which would then be an ideal entry for a smaller long position!
Swallow Academy

Ethereum (ETH): Still Cheap Don't You Think? | $2800 NextEthereum is still cheap compared to what is about to happen. Now saying "about to happen" is a little broad, saying as it might be weeks or months until we see the full potential of ETH but we are bullish for sure.
Bitcoin had its moment of money inflow and now money has to flow somewhere else, which should be ETH. This is the next stage for the bull market and that's what we are looking for.
Targeting currently $2800, but overall we want to see at least $4000.
Swallow Academy

#ETH Update #1 – July 7, 2025🟢 #ETH Update #1 – July 7, 2025
Ethereum is currently testing a resistance level that dates back about 30 days . I’m seeing long upper wicks forming here, suggesting a potential rejection from this zone. Price still hasn’t cleared its previous impulsive high, and this resistance could push ETH back toward the $2,480 level.
As long as ETH holds above $2,480, I don’t see any major concern. But if it loses that support, I’ll be watching the $2,375 level next. Below that, there's a visible imbalance around $2,320, which could act as a magnet for price.
For me, a long position becomes valid above $2,635 with momentum and confirmation. On the flip side, if ETH breaks $2,480 to the downside with strength, I may consider a short setup toward $2,327 .
But for now, I’m staying out. No position until the chart speaks more clearly.

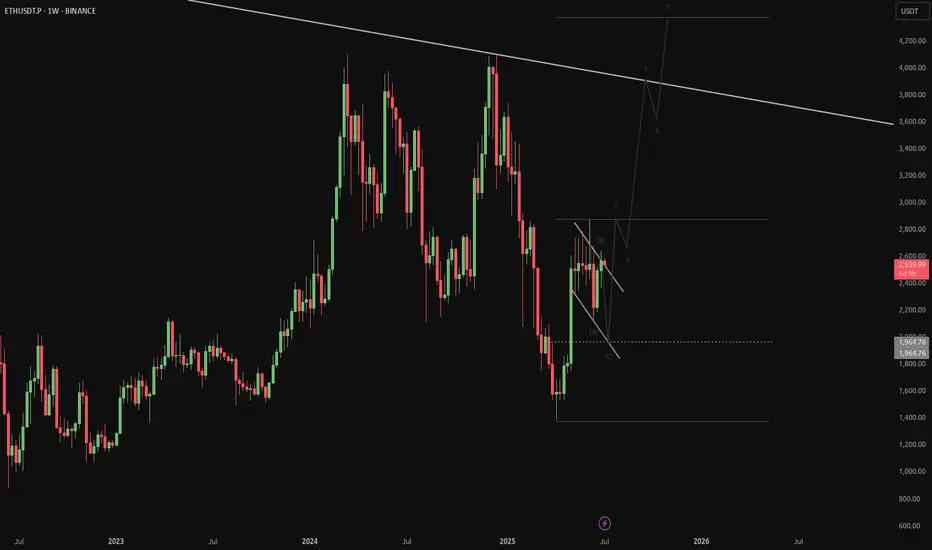
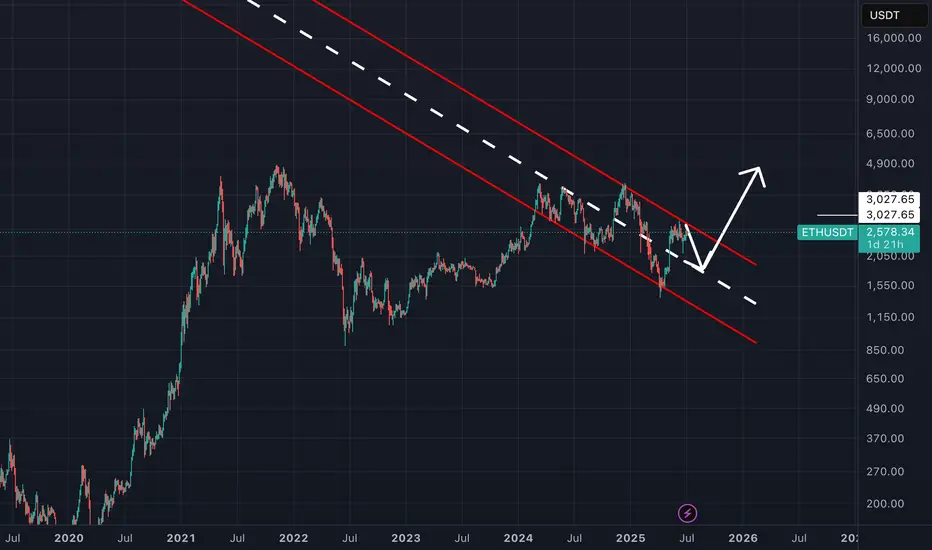
eth is waking upETH is finally waking up, but it is likely that there is still one more weekly dump before the real melt up.
ETH : BUY...Hello friends
Due to the entry of buyers and the breakdown of the trading range, we can buy in the direction of the trend and with capital and risk management within the specified limits and move to the specified targets.
*Trade safely with us*

ETH SHORT LIMIT2510–2525 SHORT
TP - 2465 / 2430
SL - 2545
The old pending order is no longer valid, easy to mistakenly touch the high short, resulting in a reverse stop loss

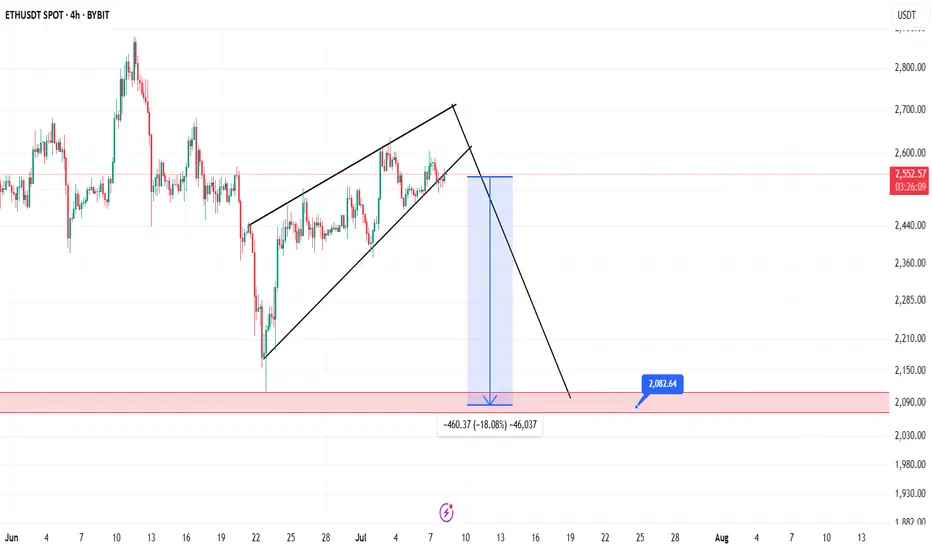
Classic Bear Flag formation on ETH day chartprice has been hovering in a a range for sometime before the last high made was on june 11th when ti touched 2879 and a low was made on june 22nd when it was 2115 since then price has moved up but has made a lower high of 2637 on 3rd july and now is trading around 2550 giving a classic bear flag appearance to the structure if the price breaks down below 2480 then we may see a max down move towards 1900-1800 consolidation in this range can happen and the price will start its upward trajectory as shown in the chart towards 3000-4000 range

ETHEREUM TRADE PLAN!!!Ethereum still remains bullish, especially on the daily timeframe there's a +OB/BISI supporting the price.
My focus is on the "4-Hour TF" I want to see price revisit (BISI) level as a more favorable entry point for continuation. This level aligns with a key bullish order block, which I anticipate will draw price down before resuming the uptrend.
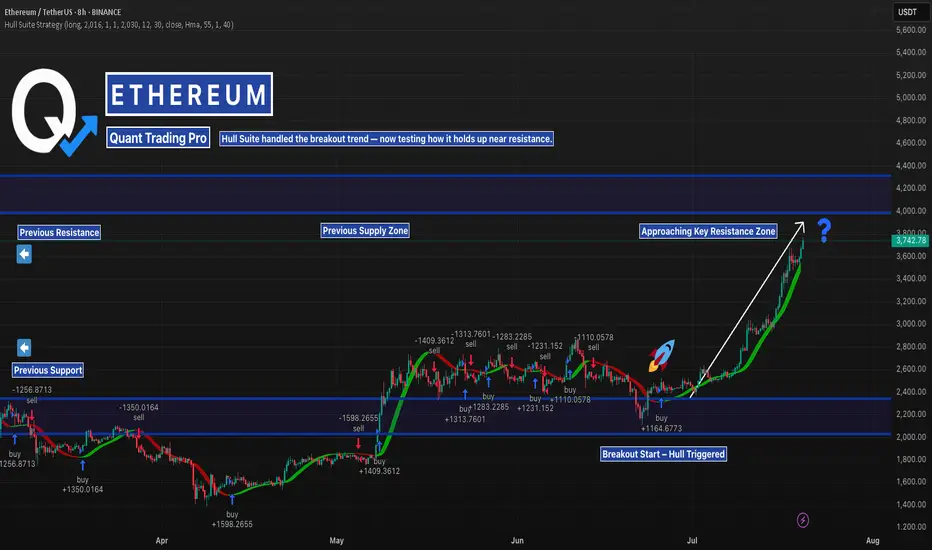
ETH in Liftoff Mode — But Resistance AheadEthereum has been trending hard — with the Hull Suite catching the breakout perfectly from the $2,200 base.
But now it’s flying straight into a key resistance zone that capped price earlier this year.
This is where many trend strategies get tested. Will Hull keep riding the wave — or will we start seeing signs of exhaustion?
📊 Watching closely how it reacts near the previous supply zone. These are the conditions where robust backtests matter most.
—
#ETHUSD #Ethereum #TrendAnalysis #HullSuite #BreakoutTrading #ResistanceZone #QuantTradingPro #TradingView #CryptoAnalysis
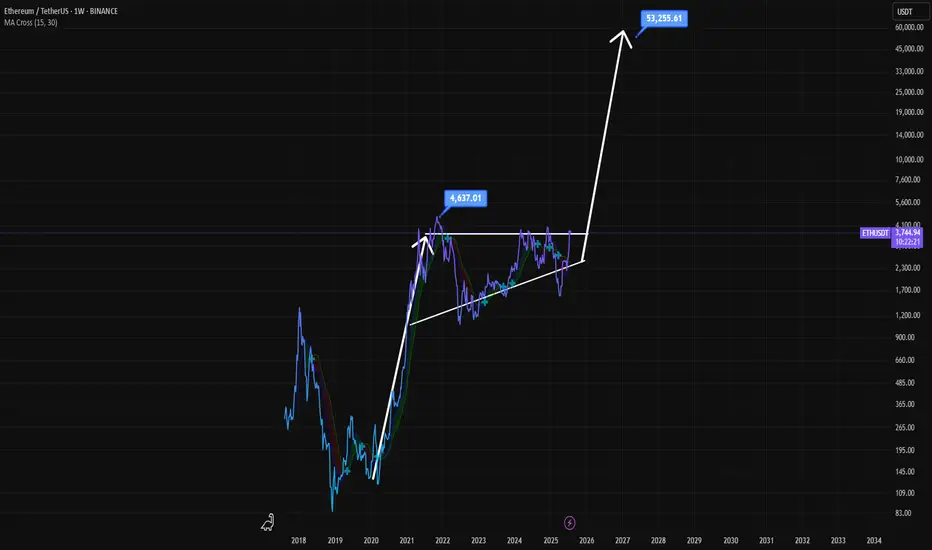
Ethereum's Path to $53,000: Multi-Year Breakout Pattern?This is a long-term technical analysis chart for the Ethereum/TetherUS (ETH/USDT) pair, presented on a weekly (1W) timeframe and using a logarithmic scale. The logarithmic scale is important as it visualizes percentage-based movements equally, which is crucial for analyzing an asset that has experienced exponential growth over many years.
Crucially, the date on the chart is "Jul 20, 2025," which is in the future. This indicates the chart is not just an analysis of past events but a speculative forecast of future price action.
Key Elements and Pattern Analysis
The chartist has identified and drawn a classic bullish continuation pattern known as an Ascending Triangle. Let's break down its components:
The Prior Uptrend (The "Flagpole"): Before the triangle formation, there was a massive upward price move starting in 2020 and peaking in late 2021. This powerful uptrend is the prerequisite for a bullish continuation pattern.
The Ascending Triangle Pattern: This is the multi-year consolidation phase that has been forming since the peak in late 2021.
Horizontal Resistance: The top of the triangle is a flat resistance line drawn at the previous all-time high, marked with a label at $4,637.01. The price has tested this level and failed to break through it, establishing it as a significant supply zone.
Ascending Support: The bottom of the triangle is a rising trendline. The price has made a series of "higher lows" since the market bottom in 2022. This indicates that despite pullbacks, buying pressure is consistently stepping in at higher price levels, showing underlying strength.
The Projected Breakout and Target: The core of this analysis is the prediction of what happens next.
Breakout: The chartist predicts that the price will continue to consolidate within this triangle until approximately late 2025 or early 2026. At that point, it is projected to break out decisively above the horizontal resistance.
Measured Move Target: The extremely bullish price target of $53,255.61 is calculated using a common technical analysis technique called a "measured move." The height of the triangle at its widest part (from the low around mid-2022 to the resistance line) is measured and then projected upward from the breakout point. This results in the highly ambitious target.
Interpretation and Narrative
The story this chart tells is as follows:
After its parabolic run in 2020-2021, Ethereum entered a necessary, long-term consolidation period.
During this multi-year phase, it has been building a massive base of support, with buyers absorbing selling pressure at progressively higher prices (the higher lows).
The chartist believes this long period of accumulation will eventually resolve to the upside, with a powerful breakout above the previous all-time high.
Such a breakout would signal the end of the consolidation and the beginning of a new major bull market cycle for Ethereum, with a projected target far exceeding the previous peak.
Important Caveats
Highly Speculative: This is a long-term forecast. Technical patterns are about probabilities, not certainties, and they can fail. The future date and extreme target price highlight the speculative nature of this analysis.
Pattern Invalidation: The entire bullish thesis is invalidated if the price breaks down below the ascending support trendline. Such a breakdown would be a significant bearish signal, suggesting a major trend reversal instead of a continuation.
External Factors: This technical analysis does not account for fundamental factors, macroeconomic shifts, regulatory changes, or other black swan events that could dramatically impact the price of Ethereum.
In summary, the chart presents a very bullish long-term outlook for Ethereum, based on the formation of a classic ascending triangle pattern. It forecasts a multi-year consolidation followed by a powerful breakout and a new, explosive bull run to over $50,000. However, this should be viewed as one possible scenario among many, with its own specific conditions for validation and invalidation.
Disclaimer: This is not a financial advise. This analysis is purely for informational purposes and should not be considered as investment advice. Trading involves risk, and you should consult with a financial professional before making any decisions.