Ethereum (ETH/USD) on the 2-hour timeframe.Ethereum (ETH/USD) on the 2-hour timeframe, here's the analysis and target level:
---
🟦 Chart Observations:
ETH is in a rising channel.
Price is respecting Ichimoku Cloud support.
A bullish breakout pattern is forming (consolidation above the cloud).
My clearly marked "TARGET 3300" at the top.
---
🎯 Target Level:
Primary Target: $3,300
This is the next major resistance and aligns with the top of the projected ascending channel.
Confirmed by your chart annotation.
---
📍 Current Price:
$2,964.3 (Sell) / $2,964.5 (Buy) — as shown in the screenshot.
---
📈 Strategy Suggestion:
Entry: On break above local consolidation / wedge (~$2,980–3,000).
Target: $3,300
Stop-Loss: Below Ichimoku cloud or lower channel (~$2,850 or tighter).
Support Levels to watch:
$2,815 (highlighted on the chart)
$2,700 (lower channel zone)
---
Would you like me to prepare a full trade plan or backtest this setup?
ETHUSD.P trade ideas

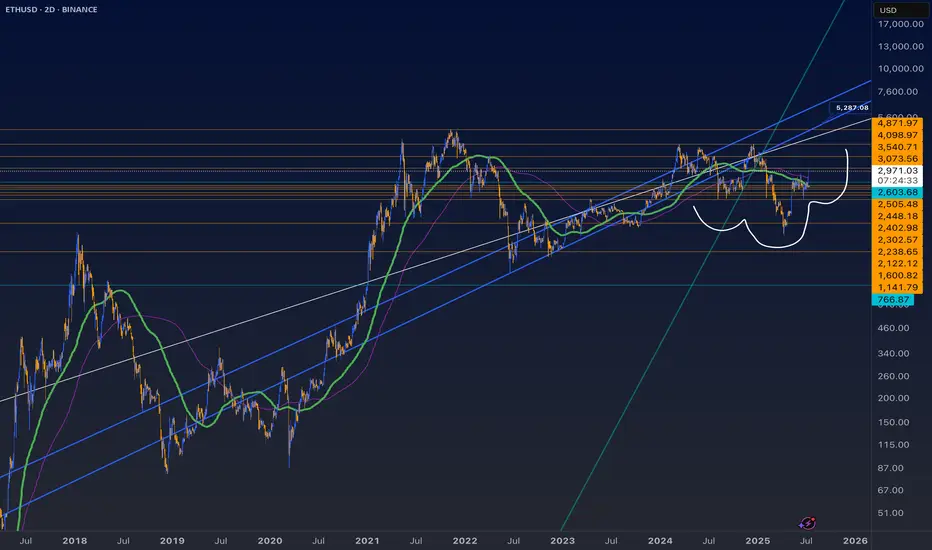
ETH : I'm not in yet and why ?Hello, good ?
Me yes or no.
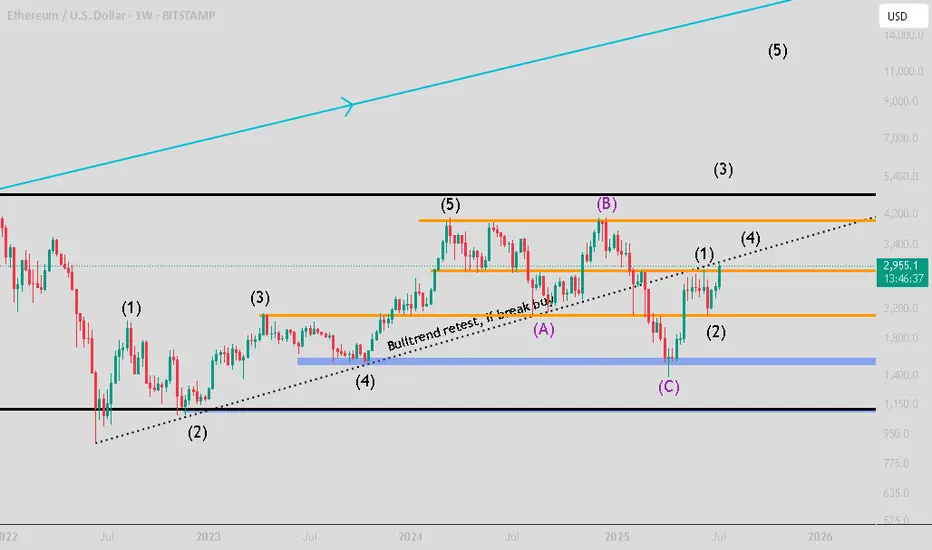
I'm not in ETH move yet, because for the moment, we are in a retest of the bulltrend.
The wave C is a perfection if we look Elliot wave.
But now, if we look the actual move in BTC, we can easily imagine a breakout of ETH.
And we can see an elliot wave configuration for the new uptrend. Wave 3 can be between 4500 and 5000.. But more if we have a brutal move on BTC.
The best case for the wave 3 is above the ATH, then ATH retest, then discovering price.
Which target final target ? Best case 15-17k
Worst case : 5-7k
You have the intermediates levels (orange) to help you to enter.
Bear market starts August 2025 and Bottoms January 2027 Ethereum will bottom at $450 then 2027 and 2028 will be the best 2 years in the history of crypto and the world and ethereum will reach above $100,000 by end of 2028
the charts are obvious!
Not a Financial advise
Ether is a buy between 1300-1500!!This price point is significant as it aligns with Ethereum's previous highs from 2018, suggesting a potential support level. The occurrence of a monthly divergence indicates that selling pressure may be diminishing, potentially paving the way for a bullish reversal.
Looking ahead, industry projections are optimistic about Ethereum's future performance. Analysts anticipate that Ethereum could reach new all-time highs, with some forecasts suggesting prices exceeding $5,000 in the coming year.
From a fundamental perspective, Ethereum's transition to a proof-of-stake consensus mechanism has significantly reduced its energy consumption and introduced deflationary pressures on its supply. This shift, along with ongoing network upgrades, enhances Ethereum's scalability and security, reinforcing its position as a leading platform for decentralized applications and finance.
Furthermore, the approval of Ethereum-focused exchange-traded funds (ETFs) has opened new avenues for institutional investment, contributing to increased demand and potential price appreciation.
In summary, the current price dip presents a favorable buying opportunity, supported by technical indicators and robust economic fundamentals. With continued network enhancements and growing institutional interest, Ethereum's outlook remains positive.
Please note alot of these things can take time to reflect in price. So although some of these news are a few years long it does not make it any less impactful! Buy when there is blood on the street.

Wajani Investments: ETHUSD Analysis
ETHUSD has currently formed a triangle with a resistance broken to the upside. In most circumstances, I’ll like to wait for a retest of that resistance, i.e. resistance-becomes support to be sure that the breakout was not false. Once that level is tested and held, I’ll take a trade assuming Leg2 would have a similar move like Leg1. This is a very good trade with a 1:4 RR.
If you have any questions, feel free to ask. You can add or subtract from this idea.
Remember, trading always carries risks, and this is for EDUCATIONAL PURPOSES only.

You be the judge.Hope you enjoy my analysis. I like to do technical analysis on charts.
If you like what I do please dont hesitate to give it a boost.
Thanks have a great weekend.
PS: I am not a professional, and this is not financial advice, please do your own research.
Ethereum Stalls at $3,101.0FenzoFx—Ethereum broke past $2,880.0 but stalled near a bearish fair value gap. The daily chart shows a longwick bearish candlestick, signaling increased selling pressure.
With Stochastic at 90.0, ETH is short-term overbought. Resistance is at $3,101.0—if it holds, ETH may retreat to $2,880.0 or $2,638.0.
A close above $3,101.0 would invalidate the bearish outlook and pave the way toward $3,330.0.

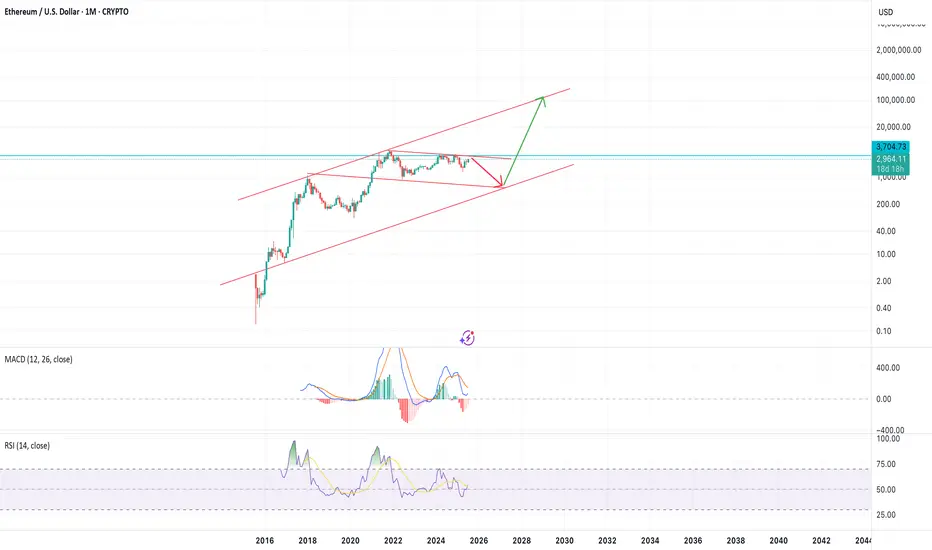
ETHUSD medium to longterm upside Hey people,
predicting this to be a complete flat and the already beginning of the upside impulse

ETHUSD Break- Test- GO!!! Nothing Changed! 3rd EditionI have been warning about this for some time. Please visit my previous two posts for more info and updates.
Magic!
Click boost, follow, and subscribe for more. Let's get to 5,000 followers ))

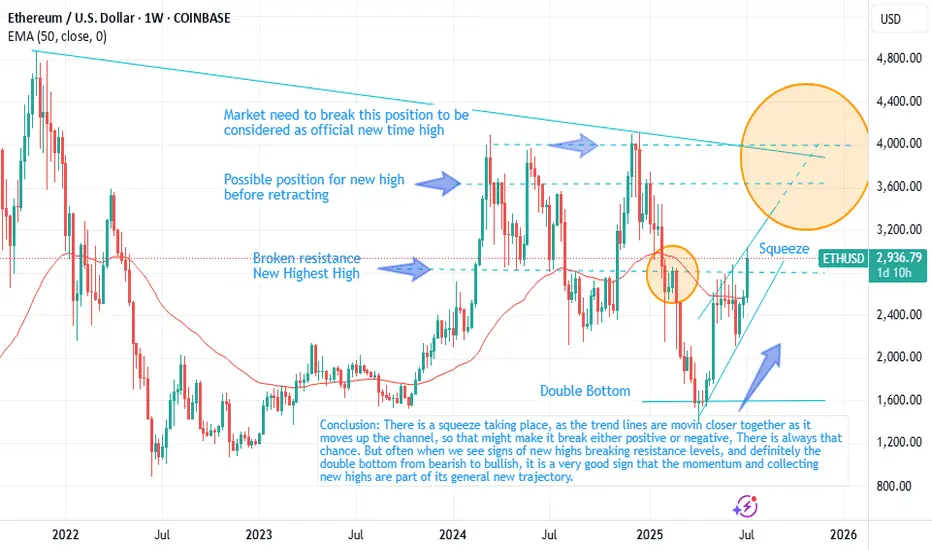
ETH Update 25-7-11so I know this is a bit of a weird view but I like to zoom out sometimes and I like this blue corridor. Personally, I think the demand for ETH speaks for itself so eventually it will see new highs and everything. This is just a way to gauge the next moves. It will probably mimic BTC with its head and shoulders pattern but be more amplified even though it’s lagging behind still and has been for years.
Ethereum can make a small correction before it continues to growHello traders, I want share with you my opinion about Ethereum. After a long period of consolidation within a descending triangle, Ethereum broke out and started forming a steady upward channel. The impulse move from the buyer zone gave the market fresh bullish energy. We saw the price pushing through key resistance levels, showing strong momentum and confidence from buyers. Eventually, ETH reached a local peak and is now hovering just above the current support level at 2835. This area is crucial - it previously acted as resistance and has now turned into a support area, giving bulls a chance to regroup. Based on the structure, I expect a short-term correction toward the support area, followed by a continuation to the upside. The trend remains strong, and the impulse is not yet exhausted. That’s why I set my TP at 3240 points, which aligns with the upper expansion target based on previous movement. Given the breakout, strong uptrend, and support zone now being retested, I remain bullish and anticipate further growth from the current levels. Please share this idea with your friends and click Boost 🚀
Disclaimer: As part of ThinkMarkets’ Influencer Program, I am sponsored to share and publish their charts in my analysis.

I'm predicting ETH to $4K = Diamond handsThis chart shows you ETH's whole existance bar the beginning, but as you can see, each time there was a strong increase, it solidated until it final toppled over and came down the other side. But for 2025 its still 40% off where it should be in terms of overall flow, so that means there is technically still 40% margin to be had. I would love to pull out now, but I'm going to just Diamond hands, this thing. I don't need the money, and its already grown 40% so if I can get a bit more why not. But inevitable I'd love to just keep on holding for ever, I'll try. Good luck people think with your brain not your heart. This is not technical advice.

ETH/USD BUY SETUP 1-HOUR Based on the chart we provided (ETH/USD 1H from TradingView), here’s a technical analysis for potential Take Profit (TP) and Stop Loss (SL) levels:
🟢 Buy Setup Analysis (From the yellow demand/support zone)
Entry Zone:
Around $2,556 – $2,563 (current price zone and consolidation before projected breakout)
Stop Loss (SL):
Just below the yellow support zone:
🔻 $2,320 – $2,350
(Safe buffer under the strong support area marked by blue arrows)
Take Profit Levels (TP):
1. 🥇 TP1: $2,600 – $2,610
Just below the resistance level formed previously (also at the consolidation zone)
2. 🥈 TP2: $2,735 – $2,745
Matches previous significant rejection point (marked by red arrows)
3. 🥉 TP3 (Max Target): $2,754 – $2,760
Major resistance area, strong supply zone
🔴 Risk Management Summary:
Parameter Value
Entry $2,556 – $2,563
SL $2,320 – $2,350
TP1 $2,600
TP2 $2,735
TP3 $2,754
🛡 Risk/Reward Ratio: At least 1:2 or better if targeting TP2 or TP3.

ETH ( Ethereum ) lovers looking strong for long term ETH -----Daily counts indicate Excellent bullish wave structure.
Both appear to be optimistic and this stock invalidation number (S L) wave 2 low
target short / long term are already shared as per charts
correction wave leg seems completed
Investing in declines is a smart move for short/ long-term players.
Buy in DIPS recommended
Long-term investors prepare for strong returns over the next two to five years.
one of best counter
Every graphic used to comprehend & LEARN & understand the theory of Elliot waves, Harmonic waves, Gann Theory, and Time theory
Every chart is for educational purposes.
We have no accountability for your profit or loss.

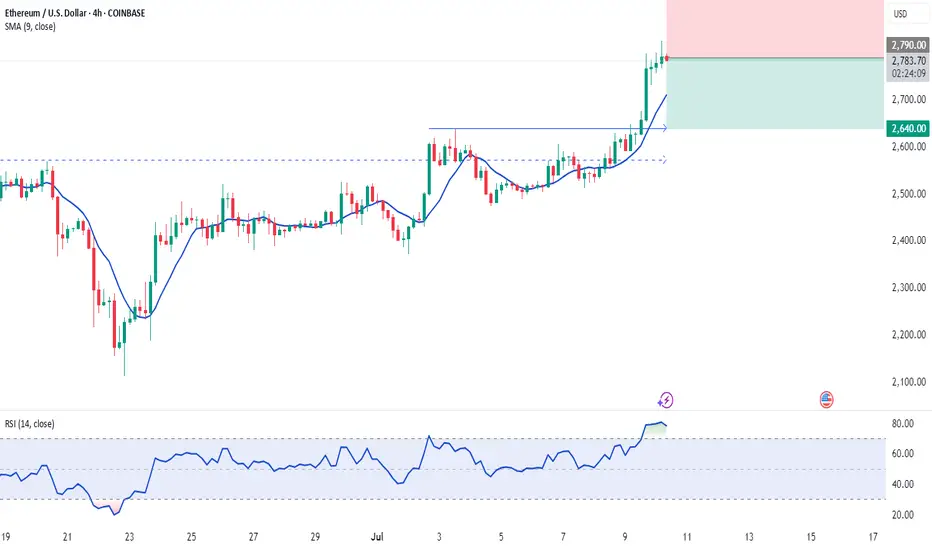
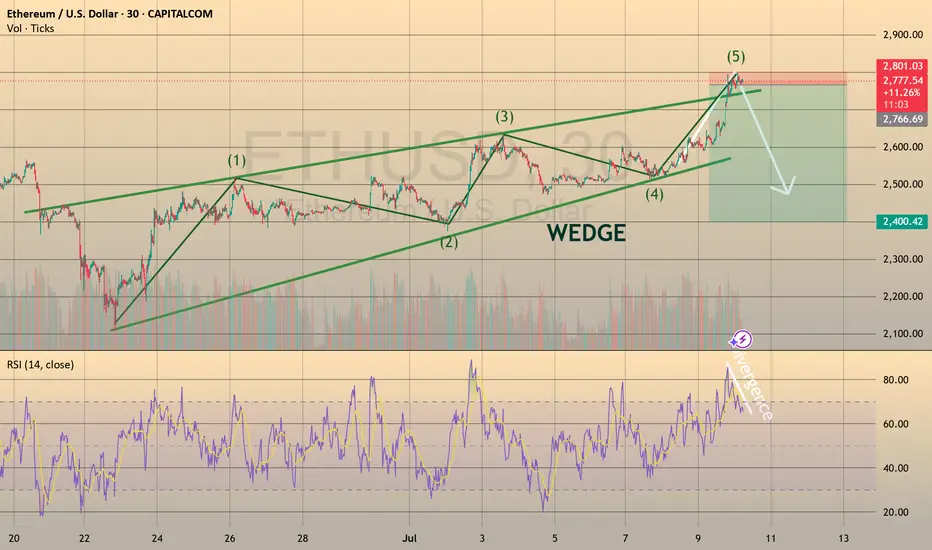
TRADING IDEA - ETHUSD SHORT
ETHUSD rose towards 2,700.00 level and reached the take profit. And even went further towards 2,800.00 resistance level despite my 2,700.00 retest predict! (pic 1)
So, congrats to everyone, who stayed long here, we took the cash!💵
I am preparing for the next trade. Here is the plan: if the price rises once again towards 2,800.0 resistance level and retests it, I will open the short position with
🔽 a pending sell stop order at 2796.84 with
❌a stop loss at 2818.86 and
🤑a take profit at 2740.05
Additionally, the RSI shows divergence on 30-m timeframe.
I suppose this to be quick trade. Will see how it will work out.
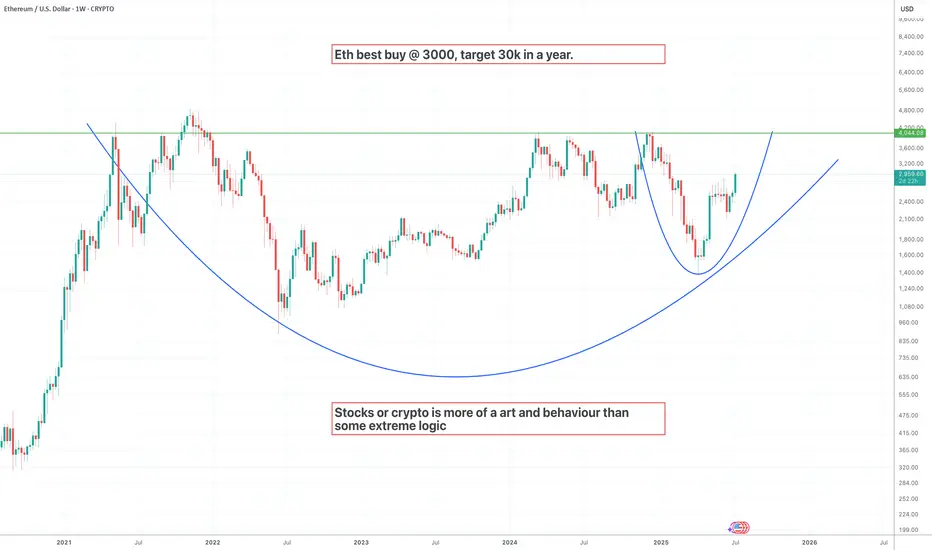
Ethusd next target 30kETH just painted the cup. Now comes the rocket. 🚀
Buy zone was $3,000 — now entering escape velocity.
🎯 Target: $30,000 within 12 months.
Crypto isn’t just logic — it’s human behavior + belief cycles.
This is art in motion. Don't blink. 👀
#Ethereum #Crypto #Altseason #BullMarket #UniproAI™
ETHUSD-SELL strategy 6 hourly chart Reg.ChannelAs usual, Crypto is highly volatile, and the crowd expectation of much higher levels, is the hype we are dealing with. Fair to say, short-term fundamentals reasons may support the current move, but technically no0w we are very overbought short-term.
Str5ategy SELL @ $ 2,940-3,000 or higher (scaling in carefully) and take profit near $ 2,725 for now.

Guys dont sell !!!It needs to go up and its, being pushed by big whales stock piling large amounts of cash.
So let it keep going. Ride it. Never sell. It will never be the same. This is the new era of ETH.
If you all go on too late for BTC, now is your chance to get on ETH and be part of the base.
It's going to recover big time. It is the best mainnet out there stable, and very versatile. It's starting to get traction more and more for its stable trajectory in the past five years.
Start loading up the truck guys.

ETH/USD Short TermA little copy paste.
Traders love their fractals... So much that they often become self-fulfilling prophecy.

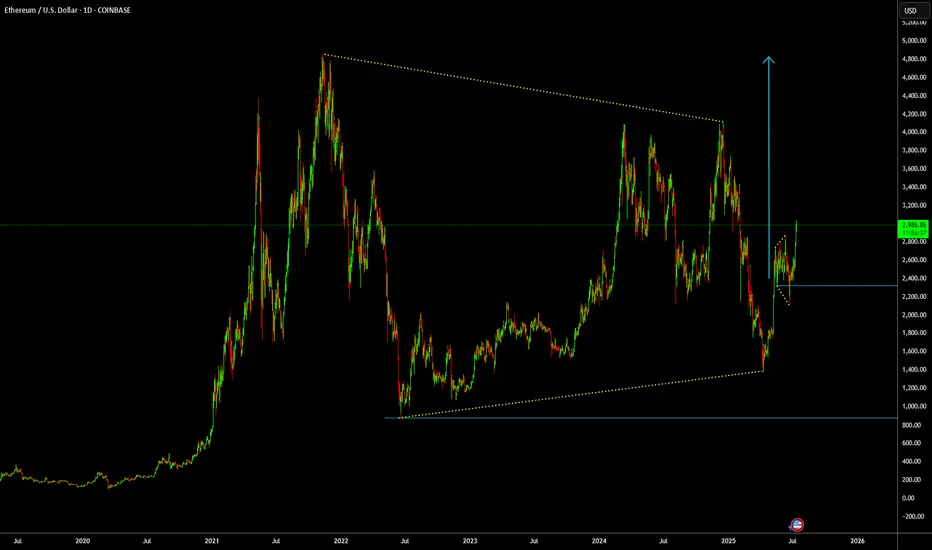
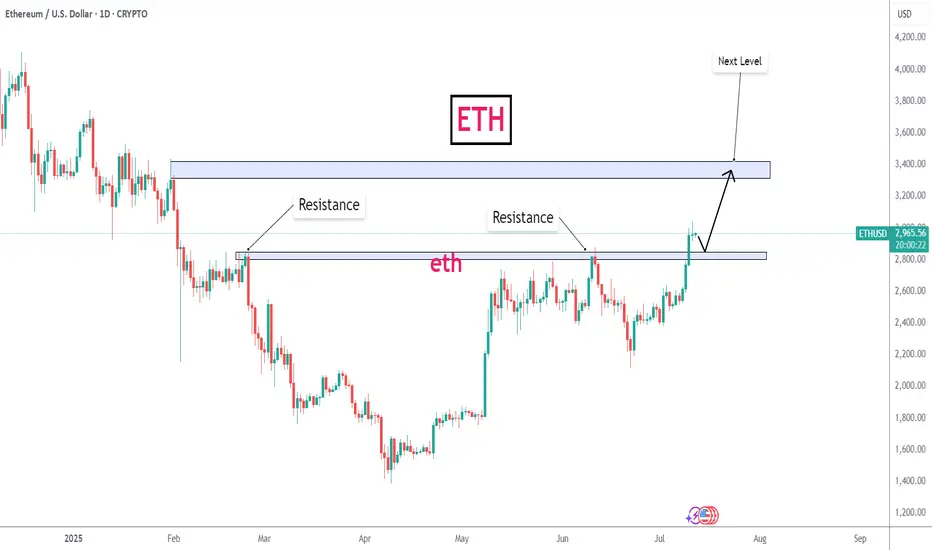
ETH - Back at the Level Everyone Forgot.Everyone’s watching ETH pump right now like it’s something new. It’s not. Look closer:
This is a look back in time to the breakdown that started to slide in Jan 2025.
That clean base around $3300 was holding for months in late 2024. It failed in January Q1, dragged us to sub-$2K by March, but now we’re right back under it.
This isn’t a random pump, it’s ETH revisiting the exact area it broke down from.
• White line = previous floor that gave out
• Dotted line = current price climbing back up into that structure
A move above $2960–$3300 flips the entire structure from resistance to reclaimed floor.
Market memory’s short, but price tends to remember everything.
