Ethusd buy setup H4Hello! Friends,
Greetings. Please leave a Like if you like the idea.
Before start talking about technical Let's share your LOVE by giving me LIKES to support this work. Thanks in advance.
ETHUSD.P trade ideas

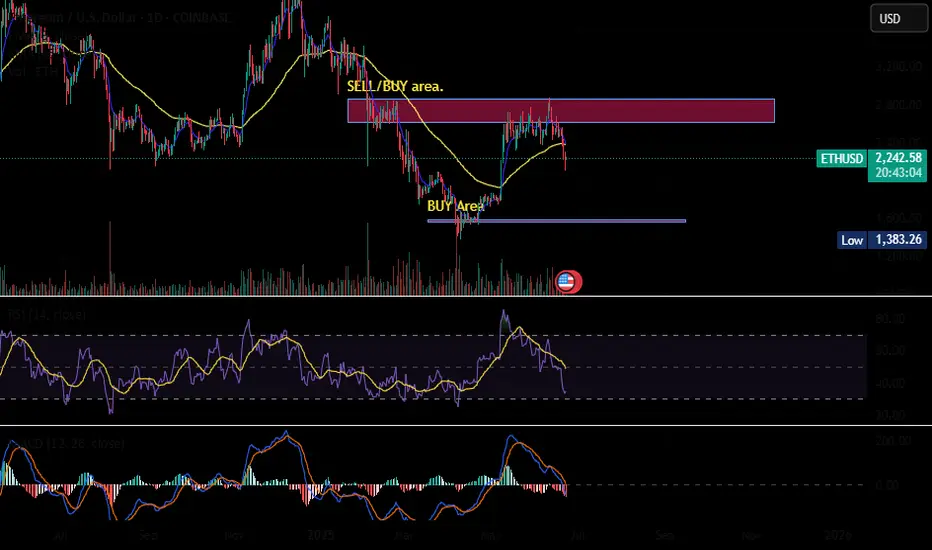
ETH BUY BIASEthereum (ETH/USD) – Weekly Chart Summary
• Current Price: ~$2,250
• Trend: Bearish structure with lower highs and lower lows
• Key Zones:
• Support (Demand): $1,800–$2,000 and $1,400–$1,700
• Resistance: $2,800–$3,600 (liquidity zone)
• 200-Week MA: Acting as dynamic support near current levels
• Outlook: Potential drop into demand zones, followed by a strong bullish reversal targeting the $3,200–$3,600 region
• Risk: Failure to hold $1,800 could trigger deeper losses
📈 Bias: Wait for price to reach key demand zones before entering long positions.

ETHUSD – Clean Climb Back from CollapseETH opened with a harsh dump from the $2,260 peak into the $2,130s before gradually recovering overnight. The bounce regained the mid-$2,230s, where price is consolidating just under minor resistance. With clean higher lows now forming, momentum could favor bulls if they break above $2,245 with volume. A pullback to $2,215 remains a possible retest entry zone.

ETHUSD selling momentum head and shoulder 📉 ETH/USD Technical Breakdown Alert 📉
🚨 Pattern Formation: Head & Shoulders + Descending Triangle 🚨
On the 4H time frame, ETH/USD has confirmed a Head and Shoulders pattern, with a strong descending triangle breakdown from the neckline at $2,450.
🔻 Bearish Momentum Building
The market structure is signaling further downside pressure. A clean break below the neckline has triggered a strong sell signal.
🎯 Technical Target
1st Support Zone: $1,765
(Watch this level for potential bounce or further continuation)
💡 This setup aligns with classic bearish continuation patterns — risk management is key as always.
📊 Stay sharp, trade smart.
👉 Like, Follow, Comment & Join our community for more real-time updates and technical setups.
— Livia 😜

Bullish bounce off 50% Fibonacci support?The Ethereum (ETH/USD) is reacting off the pivot which has been identified as an overlap support and could bounce to the 1st resistance.
Pivot: 2,089.45
1st Support: 1,669.20
1st Resistance: 2,687.43
Risk Warning:
Trading Forex and CFDs carries a high level of risk to your capital and you should only trade with money you can afford to lose. Trading Forex and CFDs may not be suitable for all investors, so please ensure that you fully understand the risks involved and seek independent advice if necessary.
Disclaimer:
The above opinions given constitute general market commentary, and do not constitute the opinion or advice of IC Markets or any form of personal or investment advice.
Any opinions, news, research, analyses, prices, other information, or links to third-party sites contained on this website are provided on an "as-is" basis, are intended only to be informative, is not an advice nor a recommendation, nor research, or a record of our trading prices, or an offer of, or solicitation for a transaction in any financial instrument and thus should not be treated as such. The information provided does not involve any specific investment objectives, financial situation and needs of any specific person who may receive it. Please be aware, that past performance is not a reliable indicator of future performance and/or results. Past Performance or Forward-looking scenarios based upon the reasonable beliefs of the third-party provider are not a guarantee of future performance. Actual results may differ materially from those anticipated in forward-looking or past performance statements. IC Markets makes no representation or warranty and assumes no liability as to the accuracy or completeness of the information provided, nor any loss arising from any investment based on a recommendation, forecast or any information supplied by any third-party.


$ETHAs uncertainty around war escalates, capital looks for liquid, borderless, and passive alternatives.
That’s where CRYPTOCAP:ETH steps in.
Liquidity pools offer passive yield, even when traditional markets are shaky.
In chaos, Ethereum becomes cashflow tech.
ETHMOnthly down,weekly UP , daily Down ..once weekly down (sure drop), wait confirmation to enter in OTE Sell


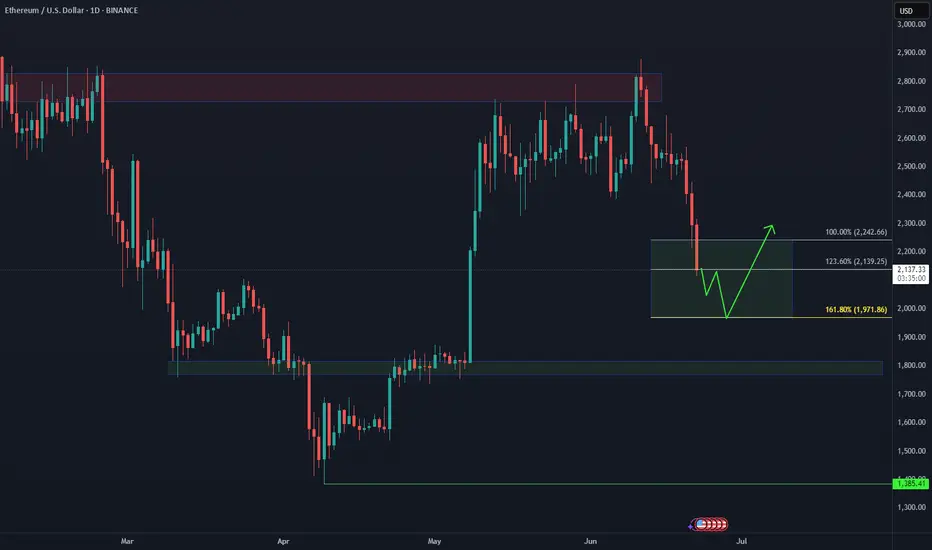
Ethereum: How Deep Into the Buying Area?📉 CRYPTO:ETHUSD is currently testing the extreme buying zone $2140–$1970 — a key area where a bullish reaction is anticipated. But if the bounce fails to materialize next week, eyes shift to the next potential demand zone near $1800.
This level aligns with prior structure and could offer a stronger base for the next leg higher — as long as the broader structure remains intact.
ETHUSD | Bullish DivergenceETHUSD is in bearish trend but and has printed bullish divergence which may start new bullish rally

ETH local bottom?ETH has formed a broadening channel pattern and may form a local bottom here, time will tell.

ETH / USDC Pool StakeSharp sell-off following the U.S. strike on Iran—ETH whale has entered. Set your liquidity pool range wide to capture a potential rebound. If the price continues to drop, no problem—full ETH position is anchored at the bottom of the range. Avoid swapping ETH to realize losses. Hold your original ETH and continue adjusting the range downward if needed. Your only real costs are minting and gas fees, so operate on a low-cost network like Arbitrum or Base to keep expenses minimal.

ETH UPDATE Eth is at a major strong support of 2200.
But i dont think this gonna hold much longer and we will go for the blue box,
Reason is bitcoin, btc broke the major major support of 100k and gave a 4h closing below 100k which is a breakdown of a sentimental support too.
Look for short, dont long right now until market cools down from the war.
If iran retaliates and a war officially breaks then were going to 90k or below, we also have a cme gap around that point
Stay safe everyone

Strong bearish momentum for EthereumCOINBASE:ETHUSD Expecting bearish continuation for Ethereum. Consolidation around 2100 and either a push downward to 1900 - 1800 or if peace is made with Iran and Israel, price could reverse and push back to the 2000 range. Let me know your thoughts everyone :)

Bearish Wolfewave target madeThe more confluence - the better.
I combine this pattern with the SAR signal.
The odds also seem better when there’s an rsi divergence.
Typical entry is when price goes back down the 1-3 line.
Ideal target is the 1-4 line.
To spot a potential Wolfewave forming, I usually look for a wave 4 that enters wave 1.
Then, I watch if that wave 4 breaches wave 2.
If not, the next move should be a break above the 1-3 line.
Another thing to look at is if the 2-4 line forms a rising wedge with the 1-3 line ( for a bearish Wolfewave).
Earlier entry for a bearish Wolfewave could be when the SAR of the pattern moves above price.
Another earlier entry is looking for signals on a shorter timeframe.
Patterns can fail.
Do your own due diligence.

Et herino getting rejected - bigger correction likely- several strong wicks to the upside
- yellow stripe signal on the 2D time-frame (comments)
- Bitcoin looking like it wants lower as well
Best case scenario for ETH here would be a correction that leads to a HIGHER LOW above 2000$. Potential surge above 3000$ and 4000$ later this year.

ETHUSD: Will Go Up! Long!
My dear friends,
Today we will analyse ETHUSD together☺️
The price is near a wide key level
and the pair is approaching a significant decision level of 2,270.9 Therefore, a strong bullish reaction here could determine the next move up.We will watch for a confirmation candle, and then target the next key level of 2,290.8.Recommend Stop-loss is beyond the current level.
❤️Sending you lots of Love and Hugs❤️

$ETH - The direction has revealed itself! CRYPTOCAP:ETH - The direction has revealed itself! ☠️
The megaphone pattern signals indecision, until it choses a direction.
First target: $1800
Second Target: $1000.
Are you convinced yet?

ETHUSD-SELL strategy 3D chart - GANN Etherium is under pressure, and the many stories predicting crypto becoming very high value, even more we already have observed, makes one wonder. From a technical perspective, it is on the way towards $ 1,750 and I feel we may see lower than that. we are negative medium-term and considering the LONG position and large unloading in BTC last few days, I feel this may be a valid expectation.
Strategy SELL $ 2,250-2,290 and take profit (at first) near $ 1,790.

ETHUSD Break- Test- GO!!! Nothing Changed!I have to repost this bc TV only gives me limited updates before it forces "target reached." Here is my previous post.
Nothing has changed. Just as I expected. If anything, it looks even more bearish now. As always, wait for the hook!
Click Boost, and follow Let's get top 5,000!

You won't see ETHUSD cheaper than this, I'm buying at 3290Any price below 3300 is okay if the stop loss is still in place. The probability of this trade playing out is very high. Almost everybody is also bearish now. So I'm very comfortable in this trade
TP1 @ 2700
TP2 @ 3000
TP3 @ 5000

ETH 4H – Testing Support, Rejected by Weekly 200MAOn the 4H, ETH is closing below the weekly 200MA but is trying to hold the last daily close as support—similar to what it did on June 5 at 20:00.
The difference: back then, the 4H 200MA acted as support; now it’s been clearly rejected and price sits well below it.
With the weekly close approaching, if ETH stays under the weekly 200MA, there's a strong chance it revisits the range low support.
However, if it manages to reclaim the 200MA before the close, a move toward the last two weekly closes may still be on the table.
Always take profits and manage risk.
Interaction is welcome.
