ETH - Most Important LinesHere we have the most important lines drawn for ETH's current short term structure.
In terms of price we have a red and a green line.
The red line represents the strongest level for current sellers to offload. This level is right around $2,850. It was a strong level for old buyers and since price has been trading below it has been flipped into resistance and continues to be a level for sellers. Once price can start closing daily candles above this level it will be flipped back into an important demand zone and price can move higher.
The green line represents the strongest level for current buyers to accumulate. This level is right around $2,150 and has been defended by buyers for the past year with many tests.
If you go back and look at our tradingview posts for the past year you will see how we have been pointing out these levels as extremely important. Current day, not only did the recent top come in at $2,879 but the recent low also came in at $2,111 giving validity to these levels mentioned above.
In addition to these price levels we have also added important trendlines that stretch back many months. A white trendline and two orange trendlines. The white trendline is what we are currently watching to see if it continues to act as resistance. If price is able to break above somewhere within those 2 orange trendlines is where we could see ETH's price top out again. If price is able to break above both orange trendlines that is when we will finally see this bearish momentum flip and start the climb back towards the critical $4,100 level.
ETHUSD.P trade ideas

ETHUSD Energy buildup supported at 2,170Trend Overview:
ETHUSD remains in a bullish trend, characterised by higher highs and higher lows. The recent intraday price action is forming a continuation consolidation pattern, suggesting a potential pause before a renewed move higher.
Key Technical Levels:
Support: 2,170 (primary pivot), followed by 2,080 and 1,980
Resistance: 2,610 (initial), then 2,800 and 2.920
Technical Outlook:
A pullback to the 2,170 level, which aligns with the previous consolidation zone, could act as a platform for renewed buying interest. A confirmed bounce from this support may trigger a continuation toward the next resistance levels at 2,610, 2,800, and ultimately 2,920.
Conversely, a daily close below 2,170 would suggest weakening bullish momentum. This scenario would shift the bias to bearish in the short term, potentially targeting 2.080 and 1,980 as downside levels.
Conclusion:
ETHUSD maintains a bullish structure while trading above the 2,170 support. A bounce from this level would validate the consolidation as a continuation pattern, with upside potential toward the 2,610 area. A breakdown below 2,170, however, would invalidate this view and suggest deeper corrective risk.
This communication is for informational purposes only and should not be viewed as any form of recommendation as to a particular course of action or as investment advice. It is not intended as an offer or solicitation for the purchase or sale of any financial instrument or as an official confirmation of any transaction. Opinions, estimates and assumptions expressed herein are made as of the date of this communication and are subject to change without notice. This communication has been prepared based upon information, including market prices, data and other information, believed to be reliable; however, Trade Nation does not warrant its completeness or accuracy. All market prices and market data contained in or attached to this communication are indicative and subject to change without notice.

ETHEREUM Massive rally up ahead.Ethereum (ETHUSD) is trading on its 1M MA50, having recovered half of the Trade War losses. Still underperforming against most of its peers but as we've entered the 2nd half of the year, the traditional Bull Cycle rally is up ahead. We expect at least a 0.5 Fibonacci level test of the Channel Up, targeting 7500.
-------------------------------------------------------------------------------
** Please LIKE 👍, FOLLOW ✅, SHARE 🙌 and COMMENT ✍ if you enjoy this idea! Also share your ideas and charts in the comments section below! This is best way to keep it relevant, support us, keep the content here free and allow the idea to reach as many people as possible. **
-------------------------------------------------------------------------------
💸💸💸💸💸💸
👇 👇 👇 👇 👇 👇


Pullback resistance ahead?The Ethereum (ETH/USD) is rising towards the pivot which has been identified as a pullback resistance that lines up with the 50% Fibonacci retracement and could drop to the 1st support.
Pivot: 2,483.49
1st Support: 2,289.88
1st Resistance: 2,655.92
Risk Warning:
Trading Forex and CFDs carries a high level of risk to your capital and you should only trade with money you can afford to lose. Trading Forex and CFDs may not be suitable for all investors, so please ensure that you fully understand the risks involved and seek independent advice if necessary.
Disclaimer:
The above opinions given constitute general market commentary, and do not constitute the opinion or advice of IC Markets or any form of personal or investment advice.
Any opinions, news, research, analyses, prices, other information, or links to third-party sites contained on this website are provided on an "as-is" basis, are intended only to be informative, is not an advice nor a recommendation, nor research, or a record of our trading prices, or an offer of, or solicitation for a transaction in any financial instrument and thus should not be treated as such. The information provided does not involve any specific investment objectives, financial situation and needs of any specific person who may receive it. Please be aware, that past performance is not a reliable indicator of future performance and/or results. Past Performance or Forward-looking scenarios based upon the reasonable beliefs of the third-party provider are not a guarantee of future performance. Actual results may differ materially from those anticipated in forward-looking or past performance statements. IC Markets makes no representation or warranty and assumes no liability as to the accuracy or completeness of the information provided, nor any loss arising from any investment based on a recommendation, forecast or any information supplied by any third-party.

ETH - ORDER BOOK - BIG LEVELS Ethereum Order Book Analysis | Key ETH Levels Revealed (Real-Time Liquidity Zones)
In this video, we dive into the Ethereum (ETHUSD) order book to uncover major liquidity levels that could influence price action in the short and medium term. By analyzing real-time data, we identify where whales and institutions are placing large orders, which often act as strong support and resistance zones.
What You’ll Learn:
• How to spot large buy/sell walls on the ETH order book
• Why these levels matter for short-term traders
• Real-time reactions to major liquidity zones
• Potential long/short trade setups around key areas
This is essential viewing if you’re trading ETH intraday or swing, and want to anticipate where the next major move may come from.
⸻
Tools Used:
• ETHUSD price chart
• Real-time order book data
• Volume heatmaps
• Liquidity zone mapping
• Sentiment Tool
⸻
Stay ahead of the crowd by understanding how the market reacts to big players’ order placements. Don’t forget to leave a comment with your ETH target, and follow for more pro-level crypto analysis.
⸻
#Ethereum #ETHUSD #ETHAnalysis #CryptoTrading #OrderBook #ETHOrderFlow #LiquidityLevels #CryptoTA #PriceAction #WhaleWatching

Ethereum / U.S. Dollar 2-Hour Chart (Binance)2-hour price movement of Ethereum (ETH) against the U.S. Dollar (USD) on the Binance exchange. The current price is $2,403.11, reflecting a 0.44% decrease (-$10.64) as of 01:57:20. The chart shows a recent upward trend after a significant drop, with key price levels marked at $2,461.10 (high) and $2,319.52 (low). Time markers range from 15 to 29, with the current time around 01:57:20 on June 24, 2025.

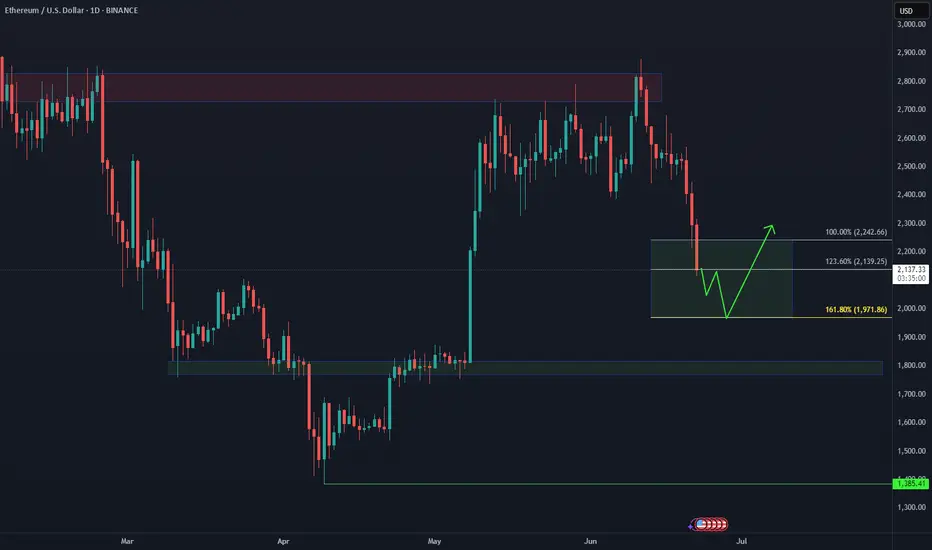
Ethereum/US Dollar 4-Hour Chart (BINANCE)4-hour price movement of Ethereum (ETH) against the US Dollar (USD) on the BINANCE exchange. The current price is $2,211.36, reflecting a decrease of $85.21 (-3.71%). The chart highlights a recent downward trend with a potential support zone between approximately $2,100 and $2,200, followed by a possible upward movement as indicated by the shaded area. The data is captured as of June 23, 2025.

Watching for a Double Signal on ETH ETH 4H – Watching for Dual Signal Confirmation
ETH is now trading above the BB center, with both the MLR and SMA also above.
PSAR hasn’t flipped yet, but if upside continues, we could see a bullish flip soon.
If PSAR flips while price holds above range low, that’s a potential dual signal (trend + structure).
Still, this is speculative—price could easily reject here and head lower.
Reminder: ETH remains under the 200MA on both the 4H and daily timeframes.
However, it’s currently holding the 5D 200MA. Idea on that coming soon.
Always take profits and manage risk.
Interaction is welcome.

ETHUSD Utilizing the technicals of channels, support and resistance and OB and OS
CURRENT GEOPOLITICAL TENSIONS CAN ALTER THIS BIAS
MY BIAS, short term sell then buy with a pull back and continued push to the upside
Opinion: This analysis is for education purposes only and is just my analysis, this is not a trade idea.

Bullish here on eth no valid breakoutEth has created a higher low, as long as we are above this price of 2100 it can still go up.

CRYPTO For Investment View 2025+Trying to forecast estimated target and target duration. Not for investment advice or anything tips like approach.
Just using basic tool we can forecast price and estimated time. Obviously different NEWS and geopolitical events may effect this.
So the point is, practice the basic.

ETHUSD is moving within the 2110.00 - 2550.00 range 👀 Possible scenario:
Ethereum is trading near $2,250 after briefly dipping to $2,120. Price recovered slightly, climbing above the 23.6% Fib retracement from the $2,568 high. Whale activity signals confidence, with a $101M long opened at $2,247. Other ETPs saw $124M in weekly inflows, extending a 9-week streak to $2.2B.
Despite geopolitical tensions and cautious sentiment, ETH ETPs saw $124M in weekly inflows—marking nine straight weeks of gains. One whale opened a $101M leveraged long at $2,247, showing strong conviction. Still, 64% of top traders remain short, expecting more downside unless the Middle East crisis eases.
✅ Support and Resistance Levels
Support level is now located at 2,110.00.
Now, the resistance level is located at 2,550.00.

Ethusd buy setup H4Hello! Friends,
Greetings. Please leave a Like if you like the idea.
Before start talking about technical Let's share your LOVE by giving me LIKES to support this work. Thanks in advance.

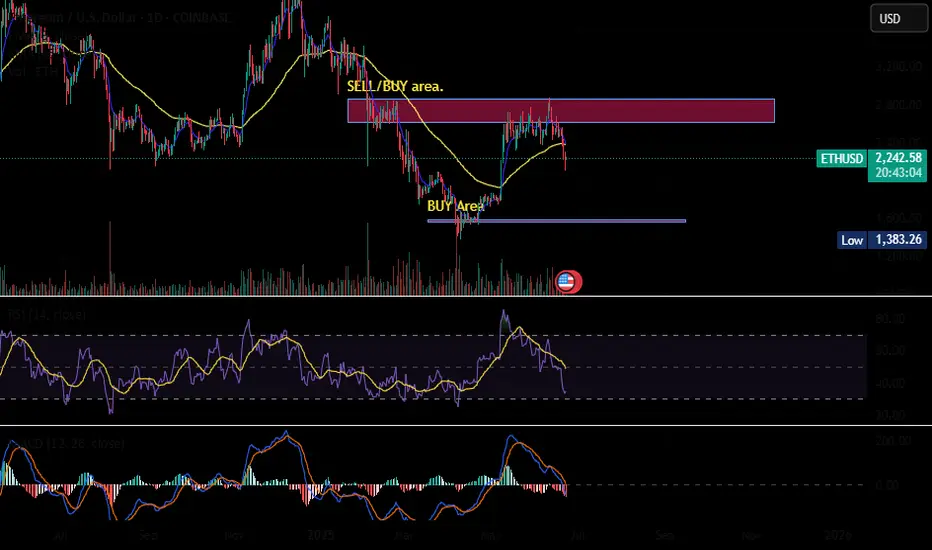
ETH BUY BIASEthereum (ETH/USD) – Weekly Chart Summary
• Current Price: ~$2,250
• Trend: Bearish structure with lower highs and lower lows
• Key Zones:
• Support (Demand): $1,800–$2,000 and $1,400–$1,700
• Resistance: $2,800–$3,600 (liquidity zone)
• 200-Week MA: Acting as dynamic support near current levels
• Outlook: Potential drop into demand zones, followed by a strong bullish reversal targeting the $3,200–$3,600 region
• Risk: Failure to hold $1,800 could trigger deeper losses
📈 Bias: Wait for price to reach key demand zones before entering long positions.

ETHUSD – Clean Climb Back from CollapseETH opened with a harsh dump from the $2,260 peak into the $2,130s before gradually recovering overnight. The bounce regained the mid-$2,230s, where price is consolidating just under minor resistance. With clean higher lows now forming, momentum could favor bulls if they break above $2,245 with volume. A pullback to $2,215 remains a possible retest entry zone.

ETHUSD selling momentum head and shoulder 📉 ETH/USD Technical Breakdown Alert 📉
🚨 Pattern Formation: Head & Shoulders + Descending Triangle 🚨
On the 4H time frame, ETH/USD has confirmed a Head and Shoulders pattern, with a strong descending triangle breakdown from the neckline at $2,450.
🔻 Bearish Momentum Building
The market structure is signaling further downside pressure. A clean break below the neckline has triggered a strong sell signal.
🎯 Technical Target
1st Support Zone: $1,765
(Watch this level for potential bounce or further continuation)
💡 This setup aligns with classic bearish continuation patterns — risk management is key as always.
📊 Stay sharp, trade smart.
👉 Like, Follow, Comment & Join our community for more real-time updates and technical setups.
— Livia 😜

Bullish bounce off 50% Fibonacci support?The Ethereum (ETH/USD) is reacting off the pivot which has been identified as an overlap support and could bounce to the 1st resistance.
Pivot: 2,089.45
1st Support: 1,669.20
1st Resistance: 2,687.43
Risk Warning:
Trading Forex and CFDs carries a high level of risk to your capital and you should only trade with money you can afford to lose. Trading Forex and CFDs may not be suitable for all investors, so please ensure that you fully understand the risks involved and seek independent advice if necessary.
Disclaimer:
The above opinions given constitute general market commentary, and do not constitute the opinion or advice of IC Markets or any form of personal or investment advice.
Any opinions, news, research, analyses, prices, other information, or links to third-party sites contained on this website are provided on an "as-is" basis, are intended only to be informative, is not an advice nor a recommendation, nor research, or a record of our trading prices, or an offer of, or solicitation for a transaction in any financial instrument and thus should not be treated as such. The information provided does not involve any specific investment objectives, financial situation and needs of any specific person who may receive it. Please be aware, that past performance is not a reliable indicator of future performance and/or results. Past Performance or Forward-looking scenarios based upon the reasonable beliefs of the third-party provider are not a guarantee of future performance. Actual results may differ materially from those anticipated in forward-looking or past performance statements. IC Markets makes no representation or warranty and assumes no liability as to the accuracy or completeness of the information provided, nor any loss arising from any investment based on a recommendation, forecast or any information supplied by any third-party.


$ETHAs uncertainty around war escalates, capital looks for liquid, borderless, and passive alternatives.
That’s where CRYPTOCAP:ETH steps in.
Liquidity pools offer passive yield, even when traditional markets are shaky.
In chaos, Ethereum becomes cashflow tech.
ETHMOnthly down,weekly UP , daily Down ..once weekly down (sure drop), wait confirmation to enter in OTE Sell


Ethereum: How Deep Into the Buying Area?📉 CRYPTO:ETHUSD is currently testing the extreme buying zone $2140–$1970 — a key area where a bullish reaction is anticipated. But if the bounce fails to materialize next week, eyes shift to the next potential demand zone near $1800.
This level aligns with prior structure and could offer a stronger base for the next leg higher — as long as the broader structure remains intact.