ETHUSD SELL TRADEThe Relative Strength Index (RSI) is showing a downward trend, indicating weakening momentum. Additionally, the Moving Average Convergence Divergence (MACD) is showing a bearish crossover, further supporting the potential for a downward move
ETHUSD.P trade ideas
ETH is riding to meet WAVE 5 !hello traders
as you can see wave 4 is formed as an triangle .
we can consider it as an ABC too!
we can expect a niiiice wave 5 as an impulsive wave


ETH Short to Support or breakout candle retestIf it is and ascending triangle and things are bearish we can go deep into the cloud support
If it's super bullish we will quickly just test the trend line of the last breakout candle

Ethereum Looks Identical to Early-Day AmazonToday I look at Ethereum versus early-day Amazon and the similarities between the internet bubble and the 2021 crypto bubble. Everyone talks about how the internet bubble popped, but few people talk about what came afterward. There was a strong recovery in the markets, and the internet was mass adopted by the public—along with the technology of home computers.
I believe we are heading into a mass adoption phase for crypto. We've had a bubble-and-pop scenario, and now that major institutions are investing in crypto, we are set up for mass adoption—very similar to what happened with home computing and the internet as a technology. I see Ethereum as being the "Amazon" of this new wave, and Bitcoin as being the "Apple." Big things are coming in these markets.
As always, stay profitable.
– Dalin Anderson

Ethereum bulls are enjoying the momentAfter violating the upper side of the range, MARKETSCOM:ETHEREUM is now aiming for the 3000 zone. Will the buyers have enough steam to drag it there? Let's have a look.
CRYPTO:ETHUSD
Let us know what you think in the comments below.
Thank you.
77.3% of retail investor accounts lose money when trading CFDs with this provider. You should consider whether you understand how CFDs work and whether you can afford to take the high risk of losing your money. Past performance is not necessarily indicative of future results. The value of investments may fall as well as rise and the investor may not get back the amount initially invested. This content is not intended for nor applicable to residents of the UK. Cryptocurrency CFDs and spread bets are restricted in the UK for all retail clients.

ETHUSD broke the Resistance level 2800.00 👀 Possible scenario:
Ethereum overtook Bitcoin in derivatives trading, hitting $110B — a 38% jump — compared to Bitcoin’s $84.7B. ETH price climbed 4% to $2,820, its highest since February. Key growth drivers include strong inflows into US spot ETH ETFs ($890M over 16 days), rising DeFi activity (TVL up 32% to $118.8B), and positive SEC signals. The Pectra update boosted scalability and reduced costs. OpenSea also saw peak user activity since 2023.
With ETF staking approval, ETH could reach $5,500–6,700 by year-end, and $10,000–20,000 by 2030. Crypto analyst suggests ETH may mirror Bitcoin’s 2021 rally. If ETH breaks the $4,200 and reclaims the 1-week MA50, it could stage a massive run — possibly topping $10K by 2026, or even $15K in a parabolic scenario.
✅ Support and Resistance Levels
Support level is now located at 2,390.00.
Now, the resistance level is located at 2,850.00.

ETHEREUM BULLFLAGA nice bullflag structure has presented itself on this daily timeframe
I think this bullflag will allow ETH to catch up to BTC in term of alts vs BTC
I expect a very strong bullish move to be coming in the next month or next month breaking out of this bullflag
Green horizontal has been seen previously as a point of support.

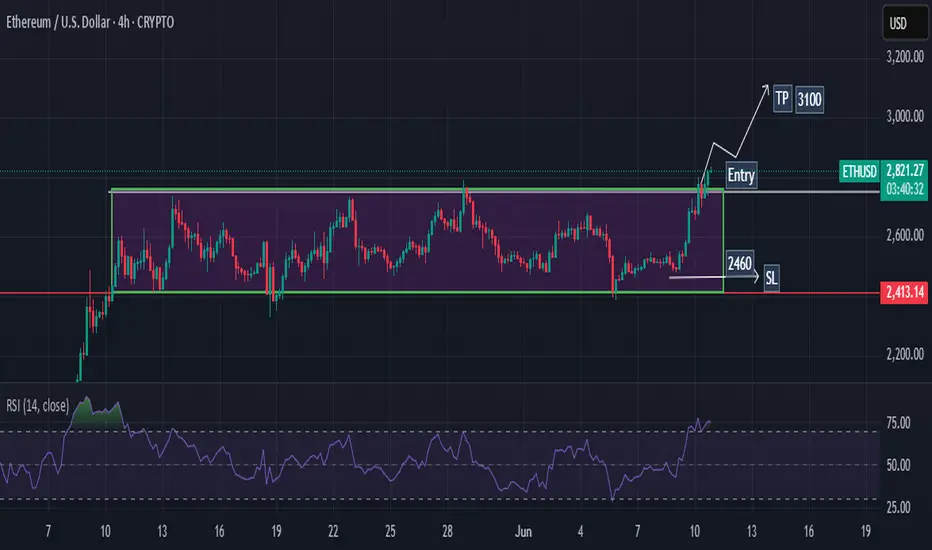
ETHEREUM (ETHUSD): Bullish Continuation is Coming?!📈ETHEREUM is in a long-term bullish trend, but since late May, it has been consolidating within a horizontal range.
However, the price bounced yesterday and closed above the range's resistance, which is likely to initiate a trend-following movement.
The next resistance level is at 3000.

ETHUSDT. Horizontal and Trendline ResistanceStrong weekly horizontal and trendline resistance
breakout is pending and closing with strong volumes
Bearish divergence on 1W TF is still intact
Watch 2800 level closely and beware of bull traps

ETHEREUM This Megaphone emerged on all previous Cycles.Ethereum (ETHUSD) is showing incredible strength at the moment as it broke above its 1W MA50 (blue trend-line) and its goal now will be to close the week above it.
This resembles May 2020 and January 2017 when again the price was struggling to break above its 1W MA50, all within a similar Megaphone pattern, and eventually succeeding. The similarities among those 3 patterns so far are striking despite being formed on different Cycles.
As you can see, we are currently on the 0.618 Fibonacci level of the Megaphone, which is exactly where ETH was during the other 2 Cycles when it tested the 1W MA50 and broke out. Once the 1W MA50 turned into Support, the market never looked back and initiated the parabolic rallies of 2020/ 2021 and 2017.
Based on that, we expect ETH to test the 1.5 Fibonacci extension, around $7000.
-------------------------------------------------------------------------------
** Please LIKE 👍, FOLLOW ✅, SHARE 🙌 and COMMENT ✍ if you enjoy this idea! Also share your ideas and charts in the comments section below! This is best way to keep it relevant, support us, keep the content here free and allow the idea to reach as many people as possible. **
-------------------------------------------------------------------------------
💸💸💸💸💸💸
👇 👇 👇 👇 👇 👇

ETH Just Broke Out — Here’s Why $3,445 and $3,995 Are TPsEthereum is showing a strong bullish structure on the daily chart, having recently broken out of a month-long consolidation channel. After spending over 35 days trading in a narrow sideways range between approximately $2,345 and $2,780, ETH has now pushed through the upper boundary of that zone, signaling a shift in momentum.
This breakout from the accumulation zone is significant. The highlighted box on the chart indicates a period of low volatility and tight price compression—often a precursor to a sharp directional move. The breakout candle was decisive and supported by rising volume, as confirmed by the PVT (Price Volume Trend) indicator, which shows a clear uptick in accumulation. This suggests that institutional and smart money may be positioning for further upside.
The reclaimed level around $2,503, previously acting as major support, is now serving as a strong base. If ETH continues to close daily candles above this threshold, the bullish momentum is likely to continue. The immediate resistance lies around $3,445, marking the first target zone (TP1), followed by a more ambitious extension toward $3,995, which aligns with Resistance Level 2 (TP2). These targets represent gains of approximately 21% and 41% from current levels, respectively.
A measured trade setup from the current zone offers a solid risk-reward ratio of 2.4. The stop loss is reasonably placed just below the breakout structure at $2,344. If ETH falls back below this level and closes inside the previous channel, the breakout would be invalidated, and bulls would need to reassess.
This setup aligns with a classic trend continuation pattern—breakout from consolidation, volume confirmation, and a potential retest of the breakout level. As long as price remains above $2,503, bulls remain in control, and the medium-term outlook remains favorable.
In conclusion, Ethereum appears poised for a bullish continuation on the daily timeframe. The channel breakout, rising accumulation pressure, and clean technical structure support the idea that ETH may soon challenge higher resistance zones. However, price must hold above key support to maintain this bias. Traders and investors may view current levels as a favorable risk-entry opportunity with eyes on $3,445 and $3,995 as major profit zones.

ETH HIT THE LIKE TO MANIFEST THISETH/USD is teasing the breakout zone again... 👀
Are we finally ready for liftoff, or is it another fakeout? 🚀🔄
The chart’s looking spicy, and the energy feels right. 🌌
Hit that like to manifest the pump — we’re in this together. 💎🙏
Let’s speak green candles into existence! 📈✨
#ETH #Ethereum #CryptoVibes #ManifestMoneyMoves #ETHUSD #ToTheMoon"

$Eth Breaks Key Resistance! Is $4100 Coming Next? Ethereum has officially broken above its previous resistance at $2900 and is now aiming for the critical $3000 psychological level. Here's a step-by-step breakdown of what to expect next, including MACD, RSI signals, and CPI data impact.
🔹 Step 1: Breakout Confirmation
Ethereum has successfully broken above the $2900 resistance level — this area is now acting as immediate support.
🔹 Step 2: Next Short-Term Target – $3000
ETH is expected to hit the round number resistance at $3000, which is the next major level to watch. This is the first price target.
🔹 Step 3: MACD & Stochastic RSI Support Bullish Move
MACD is crossing to the bullish side, showing increasing momentum.
Stochastic RSI is also favoring bullish continuation — indicating a likely move to $3000 and beyond.
🔹 Step 4: Possible Rejection Zones
If ETH faces rejection near $3000 or $3500, especially if Bitcoin shows weakness or stalls, expect a pullback.
🔹 Step 5: Target 2 – $4100 if Breakout Continues
If ETH convincingly breaks above $3000 and sustains momentum, $4100 becomes the next major target. This level aligns with the previous high and potential macro continuation.
🔹 Step 6: Watch CPI Data Impact
A positive CPI reading will strengthen bullish sentiment and help ETH push toward $4100.
A negative CPI surprise might trigger a reversal — but even in that case, a short-term hit of $3000 remains likely.
Key Levels to Watch:
Support: $2900, $2800
Resistance: $3000 (Target 1), $3500 (Interim), $4100 (Target 2)
Ethereum's price structure looks bullish above $2900, supported by technical indicators and macro optimism. The $3000 level is within reach, and if momentum continues, $4100 is the next upside target. Keep an eye on BTC behavior and CPI release for confirmation or reversal signals.

ALT RALLY COMING - UPDATE! The long awaited ALT rally is coming. Just a few more days it looks like. Then perhaps 25% - 40% increases in alts across the board.

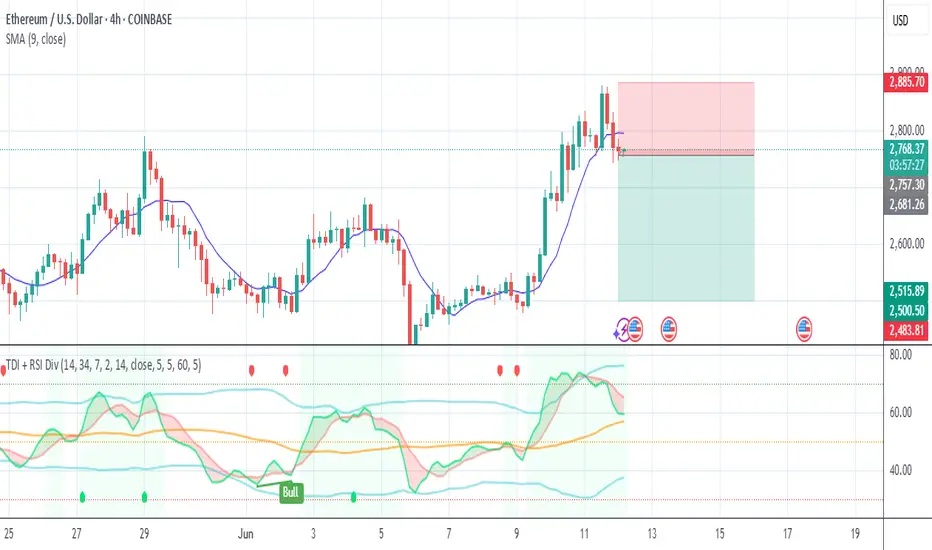
Bullish continuation?Ethereum (ETH/USD) is falling towards the pivot and could bounce to the 1st resistance.
Pivot: 2,732.37
1st Support: 2,548.35
1st Resistance: 2,898.51
Risk Warning:
Trading Forex and CFDs carries a high level of risk to your capital and you should only trade with money you can afford to lose. Trading Forex and CFDs may not be suitable for all investors, so please ensure that you fully understand the risks involved and seek independent advice if necessary.
Disclaimer:
The above opinions given constitute general market commentary, and do not constitute the opinion or advice of IC Markets or any form of personal or investment advice.
Any opinions, news, research, analyses, prices, other information, or links to third-party sites contained on this website are provided on an "as-is" basis, are intended only to be informative, is not an advice nor a recommendation, nor research, or a record of our trading prices, or an offer of, or solicitation for a transaction in any financial instrument and thus should not be treated as such. The information provided does not involve any specific investment objectives, financial situation and needs of any specific person who may receive it. Please be aware, that past performance is not a reliable indicator of future performance and/or results. Past Performance or Forward-looking scenarios based upon the reasonable beliefs of the third-party provider are not a guarantee of future performance. Actual results may differ materially from those anticipated in forward-looking or past performance statements. IC Markets makes no representation or warranty and assumes no liability as to the accuracy or completeness of the information provided, nor any loss arising from any investment based on a recommendation, forecast or any information supplied by any third-party.

$ETH Ethereum Rebounds from Key Support – Upside Target Hit!
Ethereum tested the lower boundary of the ascending channel, dipping as low as $2,385, just above the critical support zone at $2,450–$2,420. However, sellers failed to push price below the structure, and buyers stepped in aggressively.
🔸 Key Support Zone at $2,450 – $2,420:
This area acted as a strong demand zone. Despite heavy sell volume, ETH held above it and triggered a bullish reversal.
🔸 Breakdown Rejected – Bullish Momentum Returned:
The rejection of the breakdown and strong bounce confirmed continued respect for the channel structure. Price surged above the midline and reached the $2,800+ area, tagging the upper boundary of the ascending channel.
🔸 Upside Target Achieved: $2,700 – $2,800
As predicted, once ETH held the support zone, price rallied to meet the upper resistance band.
🔸 Outlook Ahead:
Ethereum remains within the ascending channel. If bulls maintain momentum and break above $2,800, the next leg higher could target $2,950 – $3,000. However, failure to hold above $2,700 may invite a retest of the midline or even support again.

ETH Bulls Back in Play Above $2800ETH/USD has pushed above $2800, a key level it has done significant work either side of going back to 2022. Having broken above the important 200-day moving average earlier this week, and with indicators like RSI (14) and MACD pointing to growing topside momentum, a close above $2800 may encourage other bulls to join in the run higher.
If the price can hold $2800, longs could be established above the level with a stop below for protection. The price action around $2800 during February reinforces the need to see the breakout stick before entering the trade.
$3000 screens as a potential target, as does $3525—the 78.6% retracement of the December–April bear move. Beyond, $3750 was tagged on multiple occasions late last year, making it another possibility before the record highs come into view.
If the price is unable to stick the $2800 break, the setup would be invalidated.
Good luck!
DS

Weekly RSI Breakout Could Signal Ethereum's Bullish ContinuationEthereum (ETH) is approaching a major technical inflection point on the weekly chart. The price continues to respect a long-term ascending channel that has defined its macro trend since early market cycles. ETH is now testing the upper boundary of this channel, coinciding with macro resistance around the $3,000 area.
Meanwhile, the weekly RSI is also nearing a crucial descending trendline that has historically marked momentum exhaustion. A breakout above this RSI resistance would indicate a shift in underlying market strength, and could trigger bullish continuation toward $3,500–$4,000.
However, failure to break this RSI resistance — especially combined with the current bearish divergence between price and RSI — may signal an upcoming correction or a phase of consolidation before any major breakout occurs.
🔍 Key Technical Highlights:
Price nearing upper channel resistance
Bearish divergence present on the RSI
Weekly RSI testing descending trendline
Volume profile shows thin liquidity above current levels
Conclusion:
ETH is at a decision point. A confirmed RSI breakout could validate further upside, while rejection from this level may lead to a short- to mid-term pullback. Monitor RSI closely on the weekly chart — it may dictate Ethereum's next major move.

Ethereum Is About to Start Making Its Move to $4100Trading Fam,
Lot's of good patterns occurring on the crypto charts recently, Ethereum is no exception. Here you can see a valid inverse head and shoulders pattern has formed. 85% of the time, these patterns play out.
If we do break that neckline to the upside, I would suggest that $4100 will come fairly quickly. We do have a few resistance areas ahead of us where I expect some pause. But this will only give the market enough time to recognize they may be missing the rocket ride and hop in.
If we don't break that neckline this week, we could pull back for another week. But I think by the end of June our neckline will break and we'll be on our way.
Best,
Stew

ETH Has Followed an 8+ Year Macro Chart — Why Wouldn’t It Again?Ethereum has respected this long-term trend structure for over 8 years.
Each major breakout, consolidation, and correction aligns almost perfectly with this macro pattern. Every time the crowd calls it dead, it coils, breaks out, and shocks everyone.
We’re now sitting at a familiar inflection point — just like in 2016 and again in 2020.
So ask yourself:
Why wouldn’t history repeat?
Why wouldn’t ETH make its next move from here?
Markets may change, but human behavior doesn’t. And this chart? It’s been whispering the same story for nearly a decade.
Don’t fade the cycle. 🔄

Ethereum sooner or later + $10kEthereum overdue major run will be there sooner or later and my expectation of + $10k for the local peak has not changed
