Ethereum is not going up?The impact of the crypto bull run is not trickling down to altcoins, and despite major buying, why Ethereum (ETH) price is not going up?
Read more here: www.cointrust.com
ETHUSD.P trade ideas
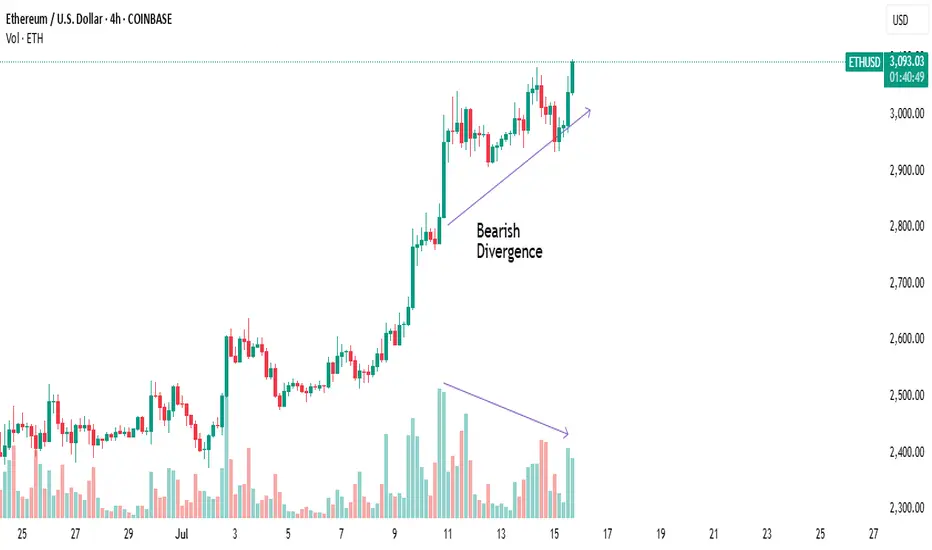
ETH/USD Short Setup – Bearish Opportunity Amid Bullish RSI DiverLooking to short Ethereum at current levels as price action shows bullish RSI divergence at the top, signaling potential exhaustion of the uptrend.
Trade Plan:
Sell Stop: 3,680
Stop Loss: 3,865
Take Profit 1: 3,495
Take Profit 2: 3,310
This setup aims to capitalize on a potential reversal as momentum weakens. Managing risk carefully with a well-placed SL above the recent high.
🔍 Watching closely for confirmation — a break below 3,680 would validate entry.
#ETHUSD #CryptoTrading #ShortSetup #TechnicalAnalysis #RSIDivergence

High SpeculationThis is something I've come up with for a bit of fun, but looks pretty convincing, but should still to take with a massive grain of salt.
After comparing the ETHBTC and ETHUSD dates, this is what I've come up with, and so to get a better understanding, visit my other post showcasing the ETHBTC chart and put them side by side.
I've come up with a bull cycle endpoint by using ETHBTC's top and bottom durations which typically coincide with each other, and just used the channel it has been following as the potential price peak, given how much ETHUSD has moved from a far smaller move in ETHBTC makes this possible as ETHBTC has a long way to go still.

ETHUSD heading towards the top of the D1 frame✏️ CRYPTO:ETHUSD is in a strong uptrend towards the resistance zone of the 3800 daily frame. There are not many conditions for the sellers to jump in and reverse the current trend. Wait for the price reaction at the resistance of the D1 frame to consider the SELL strategy. Because currently if BUY is too Fomo.
📉 Key Levels
Sell trigger: Rejection from 3800
Target 3400, potentially 3,380
Leave your comments on the idea. I am happy to read your views.

$Eth Ethereum nearing critical resistance....All Time High soon!This is a weekly candlestick chart of ETHUSD
Current price: 3800
CRYPTOCAP:ETH Ethereum recently broke out of a long-term downtrend, indicated by the red diagonal trendline. Price action has shifted from bearish to bullish. This is also a show of strong Momentum as recent candles are large and green, showing aggressive buying (strong bullish pressure).
If #eth continues in this uptrend then here are the resistance above to watch: 4000, 4800 and possibly new all time highs at 5600, 6400
Note worthy to know that the areas between 3800-4000 is very critical resistance.
Assuming a retracement from this resistance, Ethereum remain bullish above 2900
Invalidation of this idea is under 2900

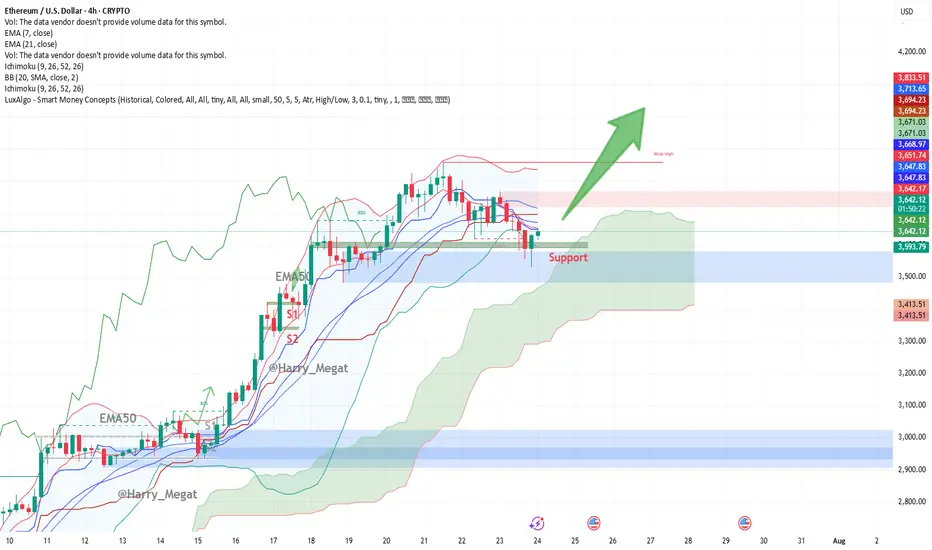
Ethereum (ETH/USD) 4-hour chart Technical AnalysisThis Ethereum (ETH/USD) 4-hour chart presents a **bullish setup**. Let’s break it down:
**Chart Overview:**
* **Price at the time of chart:** \~\$3,650
* **Support Zone:** \~\$3,615–3,630 (highlighted in green box)
* **Indicators:**
* **EMA 7 (Red):** \~\$3,653.87
* **EMA 21 (Blue):** \~\$3,669.75
* **Bullish Signal:** Large upward green arrow suggests expectation of a breakout rally from current support.
**Technical Analysis:**
**1. Bullish Bounce at Support**
* ETH tested the **horizontal support zone** multiple times, showing strong demand.
* The recent candle shows a **wick rejection** from the support zone — indicating buyer strength.
**2. Moving Averages**
* Price is trying to reclaim above the **EMA7**, with EMA21 nearby (\~\$3,670).
* A **bullish crossover** or strong candle close above both EMAs could confirm upside continuation.
**3. Structure**
* Previous resistance (\~\$3,615) has turned into **new support** — a classic bullish flip.
* The large green arrow projects a **potential breakout move**, targeting higher highs possibly above **\$3,750+**, then **\$3,900+**.
**Trade Setup Idea:**
| Type | Entry | Stop Loss | Take Profit 1 | Take Profit 2 |
| Long | \$3,655–3,660 | Below \$3,600 | \$3,750 | \$3,900+ |
**Watch Out For:**
* Rejection near EMA21 (\$3,670)
* False breakout if volume is weak
* Macro risk or sudden BTC movement dragging ETH
**Conclusion:**
The chart signals a **bullish bias** if ETH maintains above the support zone and reclaims both EMAs. A clean break above \~\$3,670–3,700 could spark further upside toward \$3,900+.
Ethereum to $8000On the monthly chart, Ethereum has reached major resistance at $3,800 again and, in my opinion, can break through this time. This is the final leg to $8,000 soon.


Ethereum: Breakout Holds Strong | Next Targets $4K, $7K+Last week, three major crypto bills cleared the U.S. House of Representatives—and Ethereum (ETH) is emerging as the biggest winner from this legislative momentum.
ETH recently broke out of a rounding bottom pattern and hasn’t looked back. Momentum continues to build, and it’s now outperforming most other major assets.
📈 Technical Highlights:
✅ Short-term target: $4,000
✅ Long-term potential: $7,000–$8,000
🛡️ Key support: $2,700–$2,800 (bullish as long as this holds)
📣 Takeaway:
Ethereum’s breakout remains intact. Pullbacks into support could offer high-probability setups for swing traders and long-term investors.
#Ethereum #ETHUSD #Crypto #Trading #TechnicalAnalysis #CryptoTrading #EthereumPrice #Altcoins #Bullish #Breakout

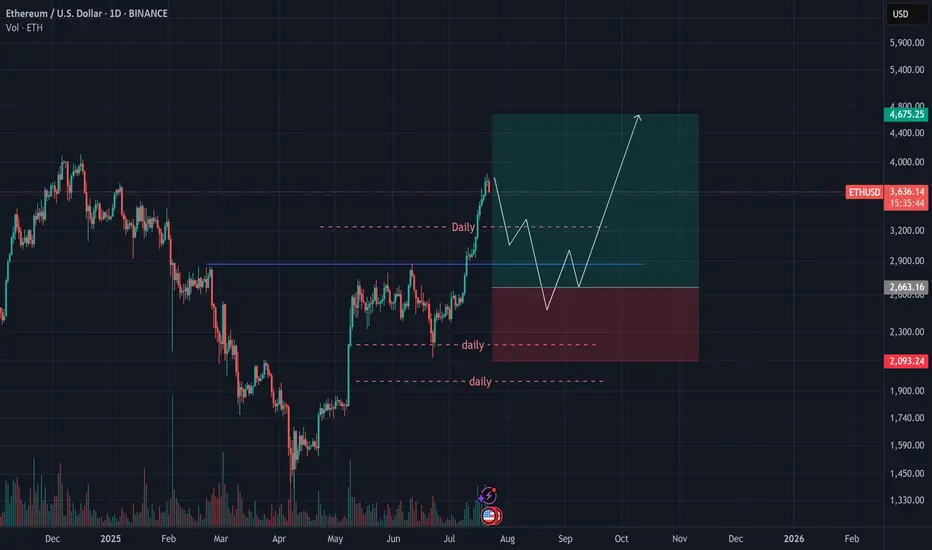
Ethereum (ETH) Analysis – July 21, 2025Ethereum has decisively broken through the key $3,000 level, pushing toward $4,000 with strong bullish momentum.
📉 While a short-term correction is likely in the coming weeks, ETH — much like Bitcoin — tends to attract increased investor interest with each dip.
As such, a continued rally toward $5,000 by the end of September remains well within reach, given the current structure and sentiment.
✅ Personally, I’m waiting for a pullback to around $2,700 as a more optimal re-entry point.
Ethereum Price Target $3,120 by Sunday?Ethereum short position Price Target $3,120 by Sunday ? Negative divergence on the hrly RSI.
Exhausted the 15 minute positive divergence when bouncing off the EMA 200 on the 1 Hour chart. First profit target is $3,350 second is $3,120. I am usually wrong with my estimations... I would recommend the opposite. So go long!

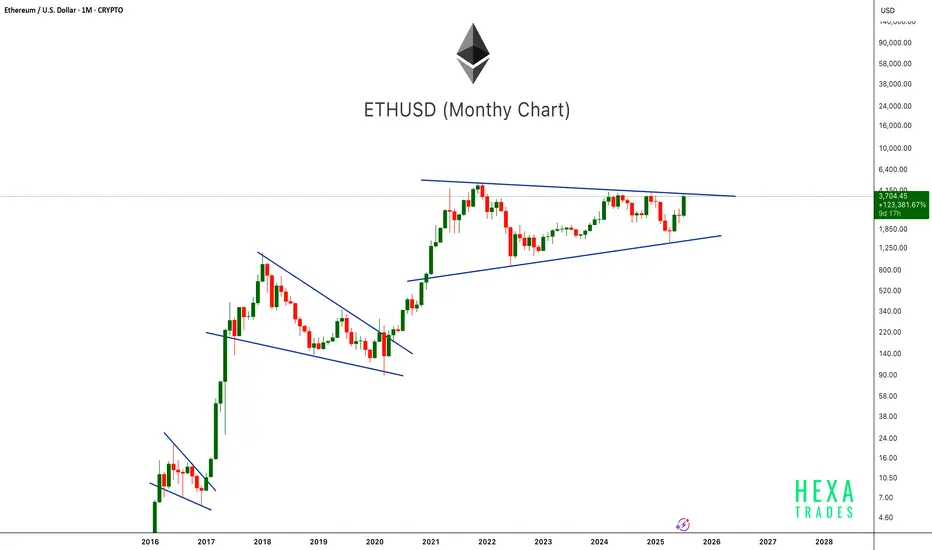
ETH Ready to Pop!ETHUSD is once again testing the upper boundary of a long-term symmetrical triangle on the monthly chart. This pattern has been forming since the 2021 peak, showing consistently higher lows and lower highs. Previous breakouts from similar consolidation patterns (2017 and 2020) led to massive rallies. With the current monthly candle showing strong bullish momentum, a confirmed breakout above this structure could mark the beginning of Ethereum's next major bull run. Keep an eye on the breakout level for confirmation.
Cheers
Hexa
ETHUSDBroke above H4 resistance and retested multiple times. Also broke above minor H1 resistance with a retest. Looking at 4,000 as main target

#ETH/USDT SETUP ,Bought From $3696#ETH
The price is moving within a descending channel on the 1-hour frame, adhering well to it, and is on its way to breaking strongly upwards and retesting it.
We have support from the lower boundary of the descending channel at 3640.
We have a downtrend on the RSI indicator that is about to be broken and retested, supporting the upside.
There is a major support area in green at 3600, which represents a strong basis for the upside.
Don't forget a simple thing: ease and capital.
When you reach the first target, save some money and then change your stop-loss order to an entry order.
For inquiries, please leave a comment.
We have a trend to hold above the Moving Average 100.
Entry price: 3696.
First target: 3764.
Second target: 3826.
Third target: 3904.
Don't forget a simple thing: ease and capital.
When you reach your first target, save some money and then change your stop-loss order to an entry order.
For inquiries, please leave a comment.
Thank you.

ETHUSD: A potential short term trade setting upHello,
The ETHUSD pair is currently forming a well-defined bullish flag pattern, a reliable indicator of a potential continuation of the upward trend. Risk-tolerant investors may consider entering at the lower boundary of the flag, while risk-averse investors might prefer to wait for a confirmed breakout to the upside before entering a position.
The MACD is showing a bullish zero-line crossover, further supporting our bullish outlook. Additionally, the cryptocurrency market has experienced significant growth recently, with Bitcoin trading at all-time highs. While Ethereum has underperformed Bitcoin, this lag presents a compelling buying opportunity, as investors who missed Bitcoin's rally may turn to Ethereum to capitalize on its potential catch-up
Disclosure: I am part of Trade Nation's Influencer program and receive a monthly fee for using their TradingView charts in my analysis.

ETHUSD 1 hour time frame
EHT USD Long Call Buy Setup
Bulllish Hammer Trigger the trade
Mange your risk reward as per your capital and book partial profits

MTF bearish macro outlook on Ethereum, wave X finishedMini altcoin season over? I think we are about to see a record high amount of liquidation within the next few months.
This is not going to sit well with a lot of people I suspect.. Even if the count is technically correct, I suspect many will not see it as probable.
This is a bias based on not just Elliott waves, but internals of S&P and NQ looking week despite crawling higher this past few days. Ethereum and even Bitcoin having massive open interest (OI). Each time Ethereum has reached close to 4k area (2024 March, May, Dec, 2025 July), OI has increased significantly with high-ish positive funding rate. Almost all indicators for Bitcoin are red hot with bearish divergences. Momentum has stalled. Sentiment is ridiculously bullish.. after Bitcoin has had a 8x?
Having said that, from the last post, I was expecting somewhere around 3500-3600 region to finish the X wave. 1400 to 1800 run is impressive. But, so were the S&P, NQ, Bitcoin, and gold. I still see the recent April to July run as a 3-wave in Ethereum.
Invalidation is simple: it needs to break 4k. That would mean there are multiple 1-2's stacked in the April-to-July run..
I see 1900 as a very strong level. I suspect that's not the final destination but I expect to see a good reaction/bounce from that area. My primary target is just below 1400, the April 2025 low. Anywhere between around 1050 and 1400 should suffice, forming a massive running flat as a corrective wave 2 since 2022.

Inverse head & shoulderPossibility by today or early hours GMT, this inverse head & shoulder can play play out, hitting the $4k mark.
Also a possibility is a correction after hitting potentially what is ATH, at which point a correction will come before ETH moves above the ATH towards the end of year bull run, 25/26.

ETH It is important not only to sell on time, but also not to return money to the market when it seems like the best opportunity to make money...

ETHUSD News Over / 30 minutes time frame Bullish Trade
Mange risk Always chart explains trade plan well

$ETH Hit Our Targets and was rejectedCRYPTOCAP:ETH hit our signal take profit target at $3820 and was rejected at the High Volume Node EQ to the penny.
That appears to have completed wave 3 of this motif wave. Wave 4 has an expected target of the R2 daily pivot and 0.236-0.382 Fibonacci retracement, $3260 before continuing to the upside in wave 5 with a target of the all time high.
This aligns with my views of a significant pullback at the end of August and September which is typical after a summer rally.
No divergences yet in daily RSI.
Safe trading

ETH turned bullish on the daily chart, great R:R hereTargeting mid to upper 3000s in the mid-term (2-3 months) and expecting 5k plus by year end. ETH will get it's turn, don't worry

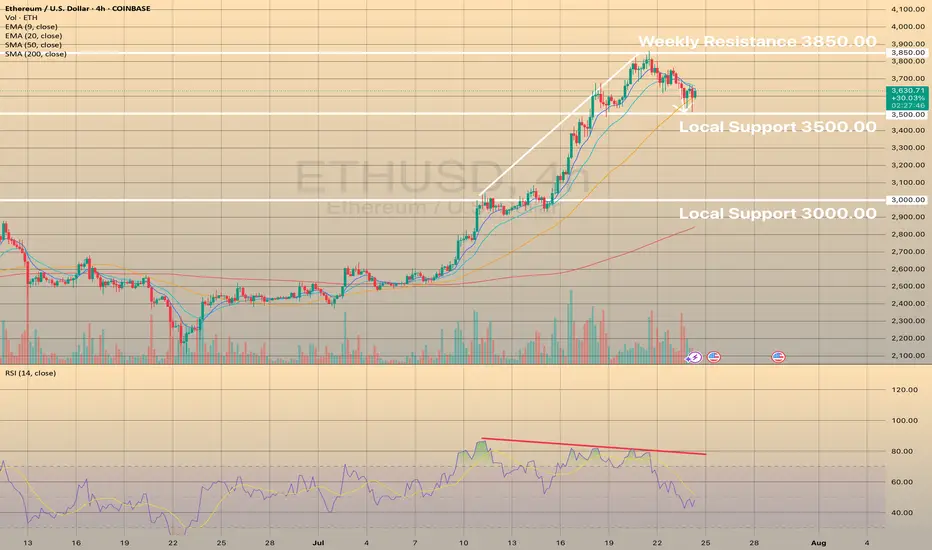
ETHUSD, XRPUSD - BEARISH DIVERGENCE SUCCESSFULLY WORKED OUT
ETHUSD, XRPUSD - BEARISH DIVERGENCE SUCCESSFULLY WORKED OUT
On these 2 graphs you may observe ethereum and ripple declining after strong bearish divergence showed up on both of these instruments. Here, the bearish divergence proved to be a success. In both cases the price has almost reached first targets: 3,500.00 for ETHUSD and 3.00000 for XRPUSD.
What will be next?
It looks like downwards correction still persists and we may observe some deeper than now decline with possible targets of 3,000.00 for the ETHUSD and 2.60000 for the XRPUSD.