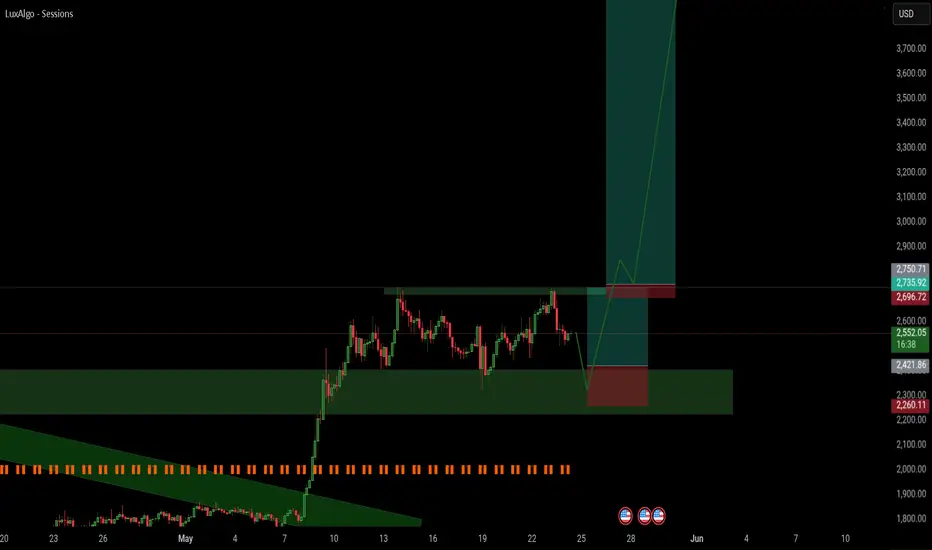
Ethereum Rejected at Supply – Is $2,245 the Next Target?Ethereum recently faced rejection from the $2,600–$2,670 supply zone, marked by high volume nodes on the Visible Range Volume Profile (VRVP). The move down confirms seller strength in this zone.
Key Levels:
Supply Zone: $2,600 – $2,670
Current Price: $2,550
Support Targets:
$2,245 – first reaction zone and likely bounce area
$1,775 – strong historical demand
$1,622 – major macro support (last-resort level)
Price Action Outlook:
ETH is showing lower highs and now struggling to regain momentum.
Watch for a breakdown below $2,500 for a clean move to $2,245.
If macro news (highlighted below) hits risk sentiment, deeper dips are possible.
Macro Alert: Upcoming U.S. economic reports could trigger volatility. Three red events marked on the calendar suggest major impact days are near – be ready for surprises.
Trade Idea:
Short-term bearish unless ETH reclaims the supply zone with strength. Bears may aim for $2,245 and $1,775 in the short-to-mid term.
Let’s Discuss:
Are you shorting ETH here, or do you expect a fakeout before new highs?
#Ethereum #ETHUSD #CryptoTrading #SupplyAndDemand #PriceAction #VolumeProfile #DayTrading #Altcoins
ETHUSD.P trade ideas

Ethereum in daily + 4HR TFIn daily timeframe it breaks its trend line with strong bullish candle, currently in 4hr TF it is in range
so I am waiting for market to come in its support or breakout with strong bullish candle
This is my view on market to,
DISCLAMER
I am not financial advisor I do not recommend you to go with my analysis I just want you guys to correct me if I am wrong , I am not a pro trader .
Still bullish above the supportEthereum is still bullish above the support still strong but i can see bullish momentum towards 2700 above 2650 resistance. If it dips back to the support then the bear will be in control so please be cautious and becareful.
If the bullish breaks above 2650 and 2700 then likely will see 3000
Take profit: 2700 short buy
Long take profit: 3000

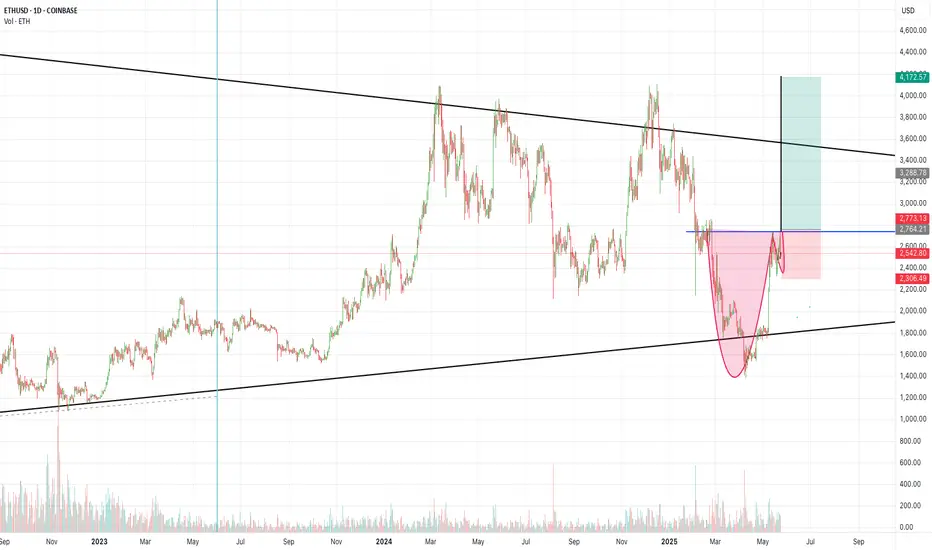
ETH Daily candlesgiant cup and handle on the daily candles and we looking at a 50% move creating a higher high breaking out of a monthlly patern symietical triangle. were looking bullish guys

ETH might be about to melt facesSentiment as negative as it could be, no real inflows for weeks - bottom sentiment? Check.
Sudden massive inflows? Check!
This is not a trade idea. If you trade this, be careful - who knows right now.

ETH (ethereum) – Massive Flag Pattern After 100% RunCRYPTOCAP:ETH – Bullish Flag After Monster Run
Ethereum ( CRYPTOCAP:ETH ) has nearly doubled since April, and now it’s cooling off — but in the best way possible: a bullish flag consolidation.
🔹 After a nearly 100% move, ETH has been consolidating tightly for two weeks — textbook flag behavior.
🔹 The trend remains strong, and this type of structure often leads to another leg higher.
🔹 Volume has tapered off during the flag — exactly what you want to see before a breakout.
Setup Overview:
Pattern: Large bull flag
Support/Risk: Defined risk to the $2500 zone
Measured Move Target: Breakout could push to $3100–$3500 based on the prior leg
Why I like this setup:
Healthy consolidation after a parabolic run
Risk/reward is favorable with structure and measured target
Potential breakout fuel from the ETH ETF narrative + BTC dominance rotation

Ethereum is cookedBitcoin has been partying at all-time highs while Ethereum itself has been making constant lore high structures. Ethereum is screaming. The market is going to sell off here soon. Your alts aren’t safe. Bitcoin isn’t safe. I’d get out.
ETHUSD – Bullish Setup with 4.12 R/R | Eyes on $2,400+ETHUSD – Is This the Breakout Setup We've Been Waiting For?
ETH is coiled up with a 4.12 R/R setup and strong cloud support holding. MACD still bullish. RSI cooling off. If this breaks out, $2,400 is on the table.
🚨 Would you take this trade?
💬 Drop your price target in the comments.
📈 Like if you’re bullish ETH.
🔁 Share if you see the same setup.
#ETHUSD #CryptoTrading #Ethereum #Altcoins #Breakout #ChartSetup #Ichimoku #TA


Altcoin coin bull markertEthereum looks very interesting in the altcoin bull run that about to take place, we know that once bitcoin moves it affects all other coins. after major blows the recovery looks promising i will buy Ethereum now rather bitcoin

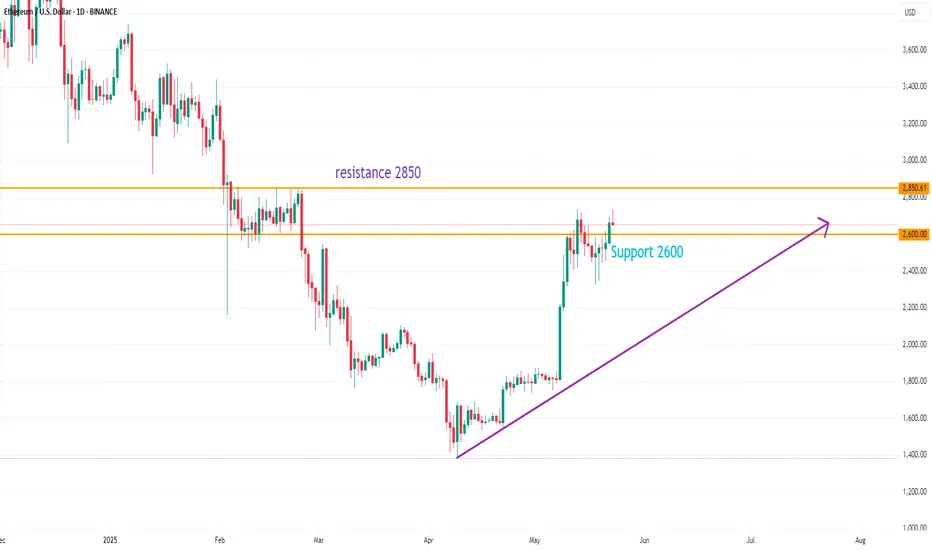
ETHUSD BUY 2600On the daily chart, ETHUSD stabilized and moved upward, and bulls took advantage. Currently, we can pay attention to the support near 2600. If it falls back and stabilizes, we can consider continuing to buy. The upper resistance is around 2850, and the breakthrough will go to the 3000-3200 area.
Ethereum (ETHUSD) Likely Extending in Wave 5The short-term Elliott Wave analysis for Ethereum (ETHUSD) indicates that a bullish cycle, initiated from the April 9, 2025 low, is unfolding as a five-wave impulse structure. Starting from this low, wave (1) concluded at $1,687.20, followed by a corrective pullback in wave (2) that ended at $1,473. Ethereum then resumed its upward trajectory in wave (3), reaching $2,738.90, as illustrated in the one-hour chart below. The subsequent wave (4) correction formed a double-three Elliott Wave structure.
In this correction, wave W declined to $2,478.80, followed by a recovery in wave X to $2,649. The corrective wave Y then completed wave (4) at $2,405.20. From this point, Ethereum has entered wave (5), advancing with an internal five-wave subdivision. Within wave (5), wave 1 peaked at $2,615.40 as a diagonal, with wave 2 retracing to $2,454. As long as Ethereum remains above the wave (4) low of $2,405.20, the outlook favors further gains. Additionally, while the pivot low at $1,753.60 holds, any pullbacks are likely to attract buyers in a 3, 7, or 11-swing pattern, supporting Ethereum’s potential to extend higher in the near term.

ETH - 2 Hours Chart - IF Break below $2,600 may test $2,550Short-Term Outlook (Next 6–12 hours):
Slight pullback likely from current resistance zone ($2,650–$2,675)
If price holds above $2,600 and stochastic resets, continuation to $2,700+ possible.
Break below $2,600 may test support around $2,550–$2,500
Not financial advise
Not recommendations to BUY SELl any stocks, cryptos, fx etc...
DYOR

ETHUSDETHUSD 4hr analysis
bearish rising wedge pattern-level
SL 2,693.51
Entry 2,451.11 (Entry for a short trade after break)
TP 2,212.94

ETHUSD Break- Test- GO!!!This is a classic break-test go setup. What you want to see is a hook-down. What you don't want to see is push-back into the structure.
It's that simple.
Boost, like, follow, subscribe!

High R:R Ethereum Trade Setup – 7:1 Long Swing OpportunityIf you missed my previous 50:1 R:R setup on Ethereum, here's your second chance before it leaves the station.
This new setup offers a 7:1 risk-to-reward ratio with a lower risk profile, as long as Bitcoin stays above $105,000.
Entry: $2,657
Stop Loss: $1,668
Target (Hopium): $10,000
This is for educational purposes only. Risk no more than 1% of your portfolio.

Ethereum will beat Gold.
Gold has been adored by humans since ancient times. Countless lives have been lost fighting over such treasure. Empires, governments and banks love the precious metal and keep thousands of tons of them with utmost security.
Ethereum, on the other hand, was created by a person just 12 years ago. You can't actually feel or touch it because it's purely virtual. But its potential is far greater than gold itself. Because of supply and demand, as well as certainty.
There's still plenty of undiscovered deposits of gold worth millions. When they are discovered and mined, there's more gold to go around for everyone, although we don't know how much gold there's left. But for Ethereum, we know its supply will shrink over time and the amount is completely certain. We know exactly how much there is and how much there will be.
It's also a lot easier to own Ethereum than to own actual gold. There's so many transactional costs involved. That's why even though gold is physical and has been gaining pretty well throughout the years, it just can't beat something better.

ETHOnce we exit this zone and bounce (if we bounce) I expect to hit 4K ++ ETH looks better then ever for the last times.

ETHUSD INTRADAY Bullish consolidation The ETH/USD pair maintains a bullish overall sentiment, underpinned by a sustained upward trend.
Key Levels:
Support: 2,190 (primary), followed by 2,123 and 2,046
Resistance: 2,625, with extended targets at 2,725 and 2,850
A corrective dip toward the key support zone at 2,190 could offer a bullish rebound opportunity. A successful bounce from this level would reinforce the uptrend and pave the way for a test of the 2,625 resistance. A breakout above this level may open the door to further gains toward 2,725 and 2,850 over the longer term.
Conversely, a decisive break and daily close below 2,190 would invalidate the bullish setup, potentially triggering a deeper pullback toward the 2,123 and 2,046 support levels.
Conclusion:
While the broader trend remains bullish, ETH/USD is currently consolidating. Traders should watch the 2,190 support closely—its defence may confirm trend continuation, while a breakdown could signal a short-term bearish reversal.
This communication is for informational purposes only and should not be viewed as any form of recommendation as to a particular course of action or as investment advice. It is not intended as an offer or solicitation for the purchase or sale of any financial instrument or as an official confirmation of any transaction. Opinions, estimates and assumptions expressed herein are made as of the date of this communication and are subject to change without notice. This communication has been prepared based upon information, including market prices, data and other information, believed to be reliable; however, Trade Nation does not warrant its completeness or accuracy. All market prices and market data contained in or attached to this communication are indicative and subject to change without notice.

ETHUSD - Strong Move UpLooking at past price movement for ETH this area shows a strong upward movement which probably will repeat
Very bullish time for altcoins especially after BTCUSD finishes its run
Lets go

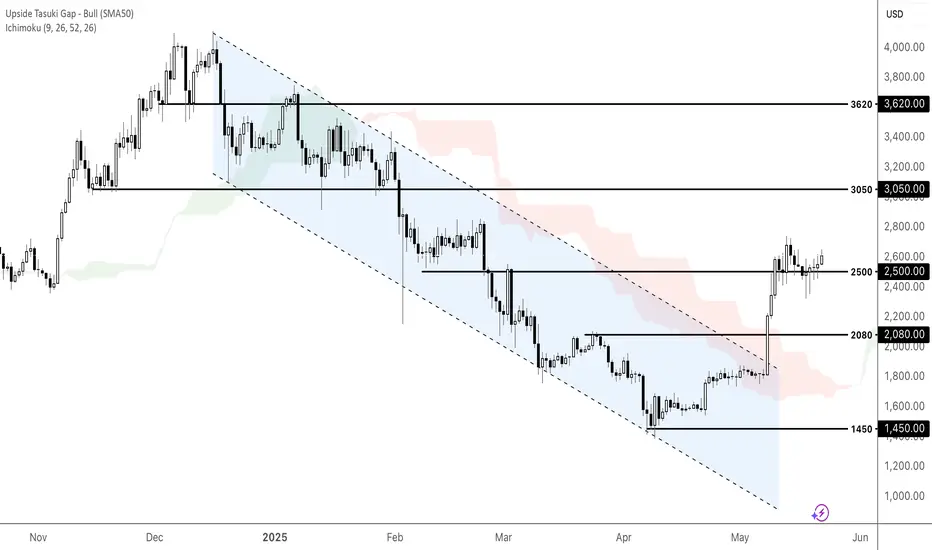
ETHUSD poised for further gains?Fundamental:
Rising US Treasury yields and weaker-than-expected US Treasury auction results have underscored declining demand for US assets. This trend has contributed to a softer US dollar, which in turn is providing supportive momentum for ETHUSD. Additionally, evolving regulatory frameworks that are becoming more supportive of cryptocurrency are further bolstering investor confidence. These factors suggest a constructive environment for ETHUSD, with potential for continued upside as demand shifts from conventional assets toward digital alternatives.
Technical:
ETHUSD broke out of the descending channel and closed above the Ichimoku Cloud, reinforcing its bullish momentum. If the price holds above the support at 2500 and sustains its rally, it could rise toward the resistance at 3050. Conversely, a retracement and a close below 2500 may prompt a deeper retracement toward the support at 2080.
By Li Xing Gan, Financial Markets Strategist Consultant to Exness
Caught the pivots up, now what?If you find this information inspiring/helpful, please consider a boost and follow! Any questions or comments, please leave a comment!
After catching the directional turn and key pivot level ahead of the recent move, Ethereum delivered the reaction we were anticipating. But what comes next?
The current W2 corrective structure isn’t textbook, so what do we do?
At this stage, we’re anchoring our analysis off the Wave 3 price action, which likely completed before the latest correction. That sets us up to track a potential Wave 4 development.
Here’s what’s still on the table:
We have a sideways style W2
For a wave 4, based off of alternation, we should be looking for a:
A sharp zigzag
Or a contracting triangle coiling up for the next breakout
Key Level to Watch:
👉 A clean break below 2159 would invalidate the more bullish interpretations and open the door to deeper corrective action. ⚠️
Until then, staying patient and letting the structure develop will be key.
Trade safe, trade smart, trade clarity.
