ETH | USDHello! This is my bearish scenario for ETH. If we get a weekly or monthly candle close below the red lines above, I’ll be expecting a downward phase toward the 1930 levels within 1–2 months. However, if we can close July above 3725, then my bullish outlook will remain intact.
CRYPTO:ETHUSD BINANCE:ETHUSDT BINANCE:ETHUSDT.P CRYPTOCAP:ETH.D BINANCE:ETHBTC CRYPTOCAP:ETH INDEX:ETHUSD BINANCE:ETHUSDT
ETHUSD.P trade ideas

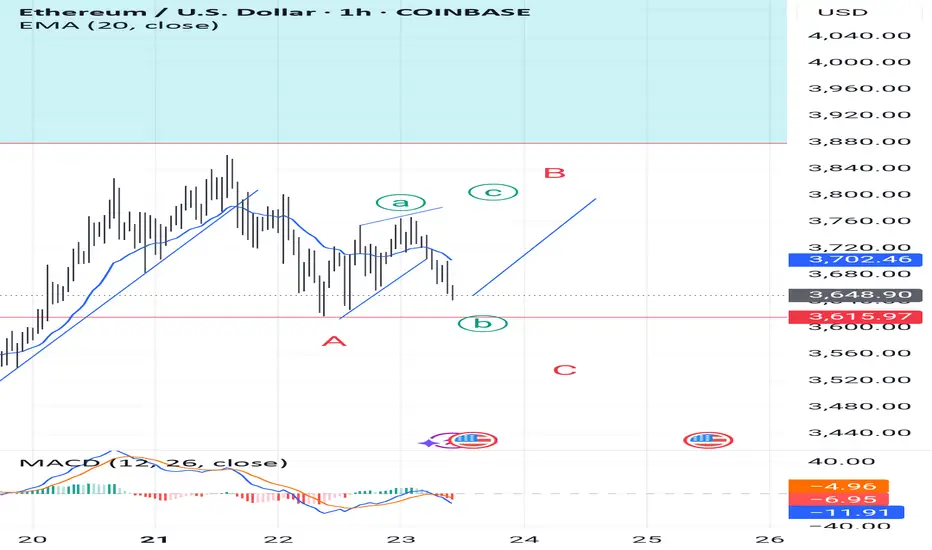
EthusdLeading diagonal has formed a wave and now we see b as a flat.
If the price doesn't go below (a)3615, I think we may see c wave of (B).
It may come strong and quick
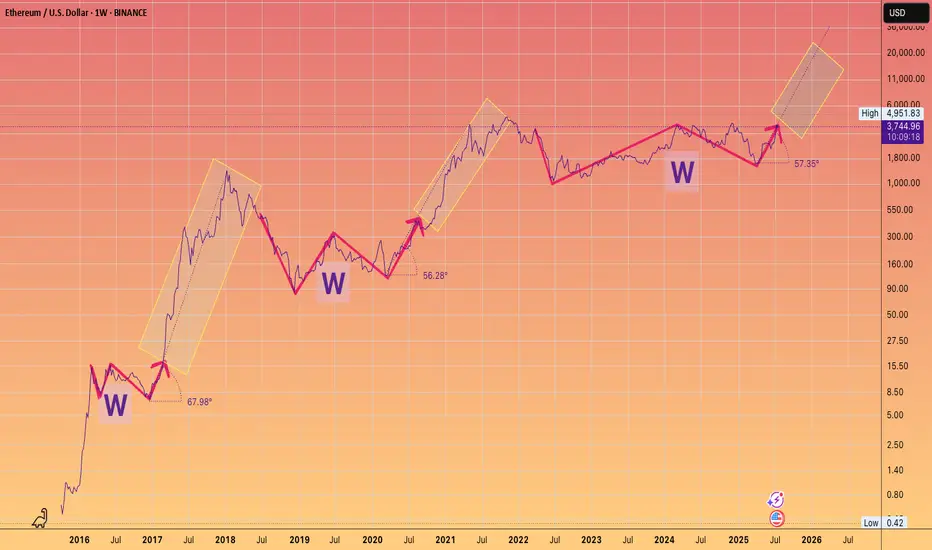
3 Wins to Glory.You guys know my long term Targets for ETH.
What I wanted to highlight is the angle of the Banana zone has been remarkably consistent on the Log chart.
Granted we only have 2 - 2.5 data points
But note how even in 2025 the run is adhering to the approx 60 degree angle of attack, after breaking out of their respective W's.
something to monitor.
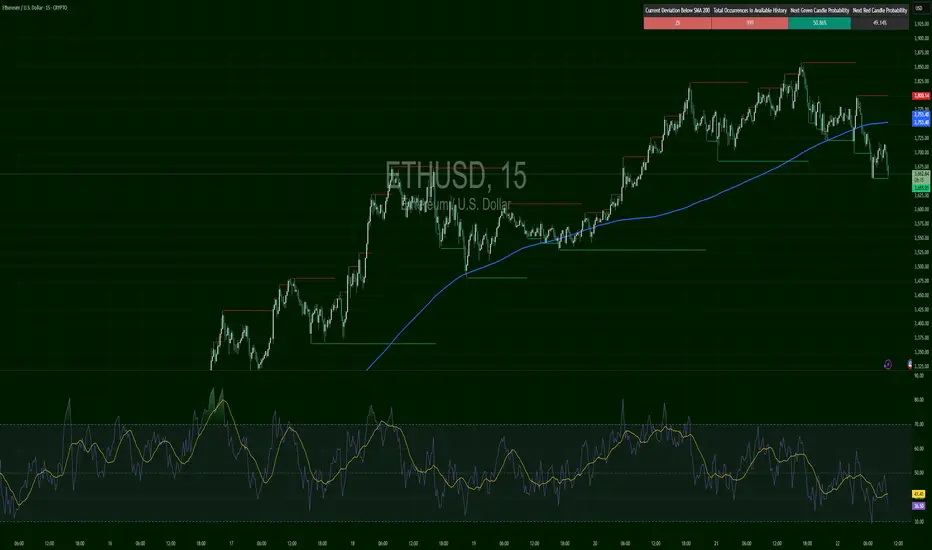
ETHUSD – Cracked at the TopETH broke sharply below $3,750 and sliced beneath the 200 SMA with strong volume. RSI slipped to ~41 and remains suppressed. Price tested the $3,655 demand zone and bounced slightly, but bulls are clearly losing grip. Any bounce below $3,730 is suspect for continuation shorts.
ETHUSD FORMED A BEARISH WEDGE. READY TO REVERSE?ETHUSD FORMED A BEARISH WEDGE. READY TO REVERSE?📉
ETHUSD has been moving bullish since July 9, forming the bearish wedge, supported by the bearish divergence. Today the price started to breakdown this pattern.
A bearish wedge is a bearish reversal pattern in an uptrend, where the price forms higher highs and higher lows within converging upward trendlines, signaling weakening bullish momentum and a potential downward reversal. To trade, identify the wedge with declining volume and confirm with RSI or divergence. Sell or short on a breakdown below the lower trendline with a volume spike. Set a stop-loss above the recent high or upper trendline. Target the wedge’s height projected downward from the breakdown or the next support level with a 1:2 risk-reward ratio.
The decline towards local support of 3,500.00 is highly expected. If the bearish impulse gets strong enough, we may see the decline towards 3,000.00 support level.

ETHUSD-SELL strategy 12 hourly chart REG CHANNELAs always crypto movements are severe, and one can never judge the corrective timings. Overall the view remains the same, and when carefully scaling in, is always warrented and proper risk management strategies.
Strategy SELL @ $ 3,675-3,750 area and take profit @ $ 3,175 area. On previous shorts if applicable, scale down slowly.

DaxPrime: BlackRock Exec Move Signals SharpLink’s $1.3B ETH ShifIn a development that is drawing attention across both institutional finance and the crypto ecosystem, a senior executive from BlackRock’s digital assets division has transitioned to SharpLink Gaming — a rising Ethereum whale and sports betting infrastructure player now managing over $1.3 billion in ETH-based assets. At DaxPrime, we see this move not as an isolated career shift but as a strategic signal of deepening convergence between traditional asset management and Web3-native businesses.
The Move: From Wall Street to Web3 Execution
According to sources familiar with the matter, BlackRock’s former Head of Digital Asset Strategy, Daniel Wexler, is joining SharpLink Gaming as its Chief Digital Officer. Wexler played a critical role in shaping BlackRock's crypto ETF initiatives and oversaw early-stage partnerships with Ethereum ecosystem projects.
His transition comes at a time when SharpLink — originally focused on B2B sports betting technologies — has evolved into a key player in decentralized infrastructure, integrating smart contracts, Layer-2 analytics, and tokenized in-game markets. The company currently holds over $1.3 billion in Ethereum, making it one of the largest corporate ETH holders in the entertainment-tech sector.
DaxPrime’s View: Strategic Talent Realignment
At DaxPrime, we interpret this as more than just a personnel update. It reflects a broader realignment where institutional talent is gravitating toward firms that offer speed, flexibility, and a native role in the decentralized economy.
“The move illustrates a trend we’ve tracked since early 2024: legacy finance professionals are increasingly pivoting toward operational roles in Web3-native companies, particularly those with real assets and strong ETH exposure,” says Michaela Strobel, Senior Analyst at DaxPrime.
SharpLink’s use of Ethereum spans beyond treasury holdings. The firm is building proprietary smart contract infrastructure for real-time sports data feeds, NFT-linked fantasy games, and decentralized betting protocols — signaling a broader use-case than speculative ETH storage.
Ethereum as a Strategic Asset
Wexler’s decision also underscores Ethereum’s growing importance as a corporate strategic asset, not merely an investment vehicle. Ethereum’s programmable layer and widespread developer adoption make it the backbone of emerging digital business models — including SharpLink’s.
DaxPrime’s July 2025 ETH Treasury Index reveals that more than 18 publicly listed firms now hold over $500 million in Ethereum each, compared to just five a year ago. This uptick is particularly concentrated in sectors like digital media, AI-gaming convergence, and decentralized finance tooling.
“Ethereum’s shift from an investment to infrastructure asset is well underway,” Strobel notes. “Wexler’s move brings boardroom-grade credibility to a company operating deep within that transformation.”
What It Means for Investors
For investors, this move signals two critical developments:
Institutional Validation of Web3 Business Models: Wexler’s transition lends credence to firms building around Ethereum-based infrastructure, rather than just speculating on token prices.
New Pathways for ETH Utility: SharpLink’s planned integration of ETH staking, yield strategies, and decentralized oracles into its sports gaming vertical could set new standards for how consumer-facing platforms leverage blockchain.
DaxPrime’s Conclusion
The decision by a senior BlackRock executive to join an Ethereum-native company like SharpLink Gaming is not a one-off anomaly. It reflects a rapidly maturing industry where the center of gravity is shifting from financial speculation to operational integration.
At DaxPrime, we continue to monitor executive movements as a leading indicator of sector confidence and capital rotation. As Ethereum evolves from “store of value” to “platform for value,” such strategic appointments signal where the smart money is going — and what the next phase of crypto utility will look like.
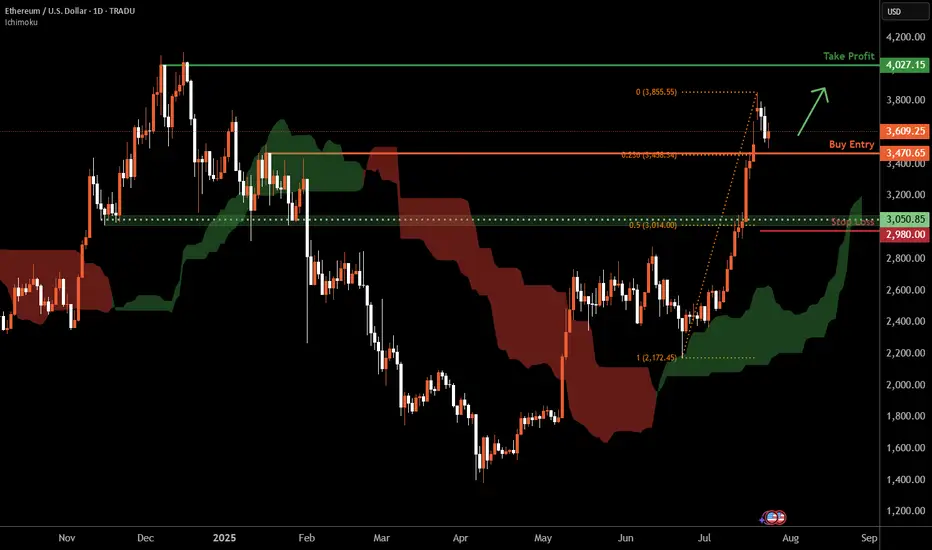
Ethereum D1 | Bullish uptrend to extend higher?Ethereum (ETH/USD) is falling towards a pullback support and could potentially bounce off this level to climb higher.
Buy entry is at 3,470.65 which is a pullback support that aligns with the 23.6% Fibonacci retracement.
Stop loss is at 2,980.00 which is a level that lies underneath a pullback support and the 50% Fibonacci retracement.
Take profit is at 4,027.15 which is a multi-swing-high resistance.
High Risk Investment Warning
Trading Forex/CFDs on margin carries a high level of risk and may not be suitable for all investors. Leverage can work against you.
Stratos Markets Limited (tradu.com ):
CFDs are complex instruments and come with a high risk of losing money rapidly due to leverage. 66% of retail investor accounts lose money when trading CFDs with this provider. You should consider whether you understand how CFDs work and whether you can afford to take the high risk of losing your money.
Stratos Europe Ltd (tradu.com ):
CFDs are complex instruments and come with a high risk of losing money rapidly due to leverage. 66% of retail investor accounts lose money when trading CFDs with this provider. You should consider whether you understand how CFDs work and whether you can afford to take the high risk of losing your money.
Stratos Global LLC (tradu.com ):
Losses can exceed deposits.
Please be advised that the information presented on TradingView is provided to Tradu (‘Company’, ‘we’) by a third-party provider (‘TFA Global Pte Ltd’). Please be reminded that you are solely responsible for the trading decisions on your account. There is a very high degree of risk involved in trading. Any information and/or content is intended entirely for research, educational and informational purposes only and does not constitute investment or consultation advice or investment strategy. The information is not tailored to the investment needs of any specific person and therefore does not involve a consideration of any of the investment objectives, financial situation or needs of any viewer that may receive it. Kindly also note that past performance is not a reliable indicator of future results. Actual results may differ materially from those anticipated in forward-looking or past performance statements. We assume no liability as to the accuracy or completeness of any of the information and/or content provided herein and the Company cannot be held responsible for any omission, mistake nor for any loss or damage including without limitation to any loss of profit which may arise from reliance on any information supplied by TFA Global Pte Ltd.
The speaker(s) is neither an employee, agent nor representative of Tradu and is therefore acting independently. The opinions given are their own, constitute general market commentary, and do not constitute the opinion or advice of Tradu or any form of personal or investment advice. Tradu neither endorses nor guarantees offerings of third-party speakers, nor is Tradu responsible for the content, veracity or opinions of third-party speakers, presenters or participants.
ETHETH has poised for more bullish movement to the upside we are currently at a demand zone in confluence with a fibonnaci and also sma in line with the level if it should hold we might see eth rally into 3800 per coin and 4600 per coin

$ETH Ethereum Market Outlook – July 2025Ethereum Market Outlook – July 2025
Brought to you by ProfessorXtrader
🚀 Ethereum Breakout Confirms Multi-Year Bullish Setup
Ethereum ( CRYPTOCAP:ETH ) has officially broken out of a multi-year consolidation range, signaling a strong bullish cycle ahead. With the current price sitting at $3,645.50, ETH has posted a remarkable 46.65% monthly gain as of July 18, 2025.
This move sets the stage for a multi-tiered upside potential — here’s what the chart is telling us.
📊 Key Levels & Targets
🔸 Previous Consolidation Range (2018–2021)
ETH spent over three years capped under the ~$4,884 level, forming a solid accumulation base.
🔸 Breakout Zone
Support: $1,150 – $1,250
Confirmation of Cycle Shift: Price now trading well above breakout zone.
🎯 Upside Targets (Ethereum)
1st Target:
📍 Price: $7,387.56
📈 Potential Gain: ~100%+ from breakout zone
2nd Target:
📍 Price: $11,394.14
📈 Potential Gain: ~180%
Final Exit (Major Reversal Zone):
📍 Price Range: $15,443.81 – $15,477.64
🚨 Total Gain Potential: ~280% from breakout
📌 The area between $15.4K to $18K is marked as the Major Reversal Zone, a region where profit-taking and trend exhaustion are highly likely.
📈 Market Interpretation
Bullish Breakout: Long-term resistance is now support.
Volume & Momentum: Strong monthly candle with expanding volatility confirms conviction.
Structure: Targets are based on clean technical projections, Fibonacci expansions, and market psychology.
🔔 What to Watch Next
📅 Monthly Close above current levels will confirm the breakout.
🔍 Monitor for rejection signals near the first target.
📉 Place trailing stops as we approach the major reversal zone.
💡 Pro Tip from ProfessorXtrader
"The biggest profits in crypto are made during clean breakouts from multi-year ranges. ETH is entering that phase now — plan your targets and protect your capital as you climb."

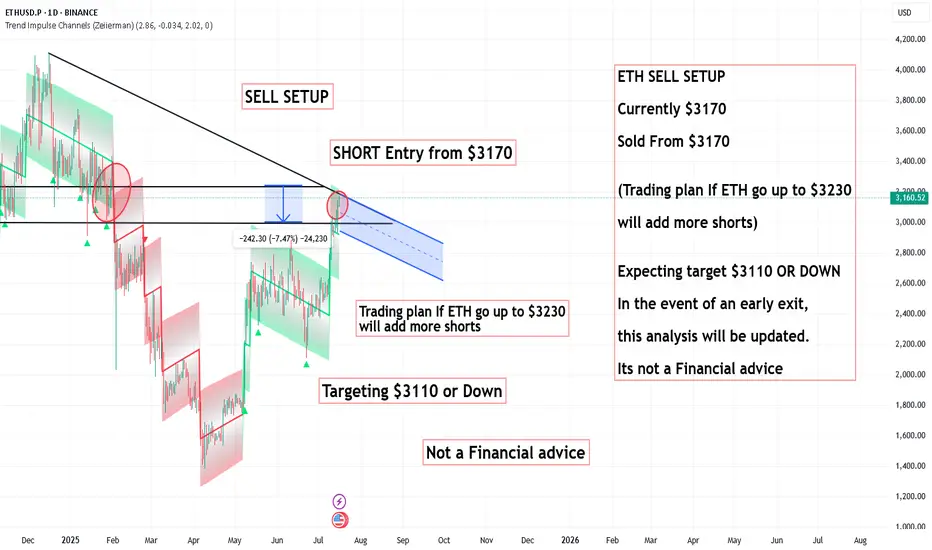
ETH SELL SETUP ,Sold From $3170ETH SELL SETUP
Currently $3170
Sold From $3170
(Trading plan If ETH go up to $3230
will add more shorts)
Expecting target $3110 OR DOWN
In the event of an early exit,
this analysis will be updated.
Its not a Financial advice
"Ethereum Is The New Bitcoin" - Tom Lee ETH / Stablecoins Are the ChatGPT of Crypto
Stablecoins are exploding in adoption — just like ChatGPT took over AI and Ethereum is the engine driving that revolution. In this post, we break down 10 reasons why Tom Lee is extremely bullish on Ethereum and why it could be the single most important digital asset in the future of finance . If you're sleeping on ETH, this might be your wake-up call.
Top 10 Bullish Points from Tom Lee on Ethereum:
• Ethereum is the backbone of stablecoins , which Tom Lee compares to the “ChatGPT of crypto” due to their viral adoption and massive utility.
• Over 51% of all stablecoins operate on Ethereum , contributing to around 30% of the network’s total fees.
• Ethereum network fees could 10x as stablecoin usage grows from $250 billion to $2 trillion.
• Ethereum is positioned to lead the tokenization of real-world assets , including stocks and real estate.
• ETH could reach $10,000 if asset tokenization becomes a mainstream financial practice.
• Ethereum has a regulatory edge in the U.S. , making it the preferred platform for compliant financial innovation.
• A $250 million ETH treasury strategy is underway , aiming to use Ethereum as a long-term reserve asset.
• Institutions will buy and stake ETH to secure stablecoin networks, making ETH the “next Bitcoin.”
• Ethereum dominates the crypto ecosystem , with nearly 60% of activity including DeFi, NFTs, and dApps built on its chain.
• HODL ETH for long-term growth , as its utility, demand, and institutional support continue to rise.
Conclusion:
Ethereum isn’t just a Layer 1 blockchain — it’s becoming the core financial infrastructure for the digital age . As stablecoins expand and institutions enter, ETH could be the most asymmetric opportunity in crypto right now.
📢 Drop a like, leave your thoughts in the comments, and don’t forget to follow for more powerful macro + crypto insights. 👍👍

ETHEREUM: The $4,000 Triangle - Breakout or Breakdown?🎯 THE MEGA SETUP: Giant Symmetrical Triangle
🔍 What We're Looking At: 📐 Triangle Specifications:
🟢 $3,042.00 - Triangle Lower Trendline
🟢 $2,875.00 - 1W FVG (Fair Value Gap)
🔴 $4,087.00 - BSL (Buy Side Liquidity)
🔴 $4,200.00 - Psychological barrier
_______________________
🛡️ CONSERVATIVE LONG:
Entry: $2,800 - $2,850 (Triangle support bounce) 📊
Stop Loss: $2,740 (Below triangle) ❌
Targets: $3,500 → $3,800 → $4,200 🎯
! Smash that follow button for more killer setups! 🔥📊
____________ NOTE __________
⚠️ RISK MANAGEMENT
⚠️ DYOR
Remember: No setup is guaranteed. Always manage risk and never invest more than you can afford to lose.

ETHUSD M15 long strong bullish Support Zone: $3,000 – $3,020 (Active reaction zone)
• Strong Support (Last Defense): $2,940 – $2,970
⸻
🎯 Upside Targets:
1. First Target:
🔸 Level: $3,050
🔸 Type: Minor Resistance / First TP
2. Long Target:
🔸 Level: $3,125 – $3,150
🔸 Type: Major Resistance / Final TP

Ethereum at the Crossroads: Can Bulls Maintain the WMA 50 Grip?- Technical Pulse:
- Current price flirting with the WMA 50 ($2,521.54), suggesting a possible make-or-break moment.
- Highlight convergence zones: WMA 21 ($2,296.75) and EMA 200 ($2,277.07) forming a soft cushion below.
- Volume Snapshot:
69.19K weekly—enough activity to suggest accumulation
- Sentiment Analysis:
Gauge prevailing investor sentiment amid consolidation and macro uncertainty.
- Scenario Forecasts:
- Bullish Path: Sustained hold above WMA 50 opens room toward $2,800+.
- Bearish Reversal: Rejection from current level could retest EMA 200 support zone.

$ETH Bullish Set up Ethereum just started bull move .Five wave move could take it to all time high of 17k .....

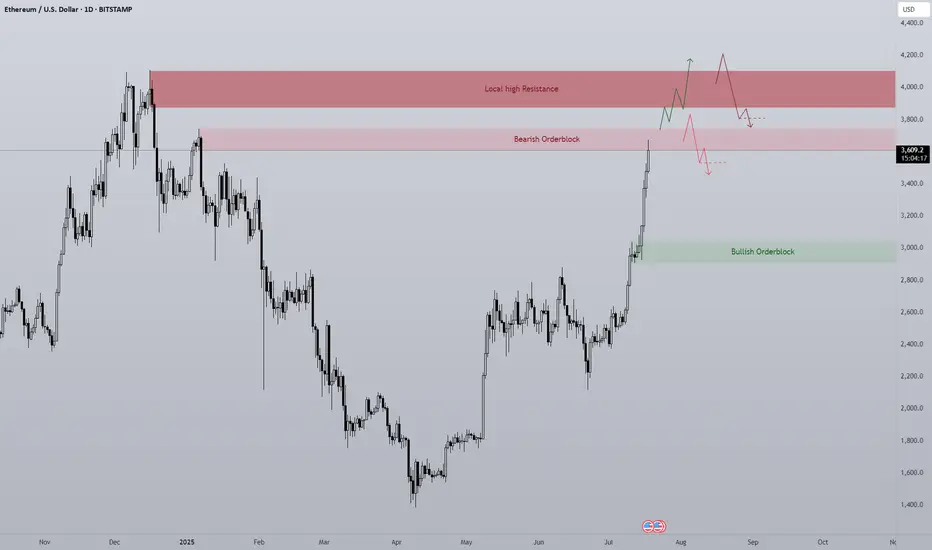
ETH 1D Overview Finally we are seeing altcoins regaining lost ground on Bitcoin and the second largest crypto by market cap is rallying strong.
Since ETH has such strength currently the opportunity to short is quite slim with high risk, however I think it's important to see where ETH may find some resistance or if a pullback was to happen, where would it come from?
The first level is the bearish orderblock level that has just been tapped as of writing. This area previously began the sell-off at the end of 2024 by confirming a new lower high. Naturally this area will present problems for the bulls and so a potential pullback could be initiated from this level. I would like to see a sweep of the stop loss positions just above the area and then a SFP to confirm the pullback is in motion.
Should the bearish orderblock fail the next clear level is the daily local top around $4000. A big even level and the area that started 5 months of downtrend. IMO the most likely level where longs will take profit. I do think if we see any form of consolidation between the bearish orderblock and the local high the bulls will look to carry the rally on, shallow pullbacks maintain momentum
Ten out of the last eleven days have been green candles with the only one day being red just above a key high, I expect if we are to get a pullback that bullish orderblock area ($2900-3000) to be retested as support. Therefor if any of the above areas initiate a pullback this area should provide support and therefor a long entry.
To clarify I am in no way bearish about Ethereum, this is just a plan for different eventualities.
ETH - consolidation breakout - BULLRUN 2025 CONFIRMEDHistorically, Ethereum tends to make very strong impulsive moves after long periods of accumulation.
Right now, we've been consolidating for over 1,500 days — and while no one expects it, a move to $10K or even $20K is not off the table. The chart structure suggests it's possible.
Take a look at the historical price action I marked: after long consolidations came powerful bullish rallies.
And yes — those consolidation phases occurred during bear markets,
while the breakouts and bull runs happened in 2017 and 2021, right when the major BULL RUNS started!
Will 2025 be the same? LET’S SEE! 🚀

Ethereum Ready for New All Time HighEthereum's protracted consolidation between $2,000 and $4,000 over the past four years appears to be reaching a critical juncture. This extended period of sideways movement has built significant potential energy, suggesting that the market is coiling for a substantial breakout. Technical indicators are hinting at an imminent end to this consolidation phase, with increasing bullish momentum. Should Ethereum decisively break through key resistance levels, a rapid ascent towards the $10,000 mark by the end of the year becomes a distinct possibility. The duration of this consolidation underscores the magnitude of the anticipated move, making Ethereum a key asset to watch for substantial gains.
Anticipation is building for a potential surge towards the $10,000 mark by the end of the year. Several factors underpin this bullish outlook, including increasing institutional interest, the ongoing development and adoption of Ethereum's Layer-2 scaling solutions, and the continued growth of the decentralized finance (DeFi) ecosystem. The upcoming Fusaka upgrade, expected in late 2025, which aims to significantly reduce Layer-2 costs through Peer Data Availability Sampling (PeerDAS), is also contributing to optimistic price predictions. If Ethereum can maintain its current momentum and break through key resistance levels, the $10,000 target remains a distinct possibility.

ETH relative to AltcoinsI fee like at this current point as we see altcoin pairs bleed against ETH and BTC while putting in lower lows while Eth puts in higher highs we will not see the altseason we are hoping for until altcoin pairs hit here range lows which I can see happen end of Q3 into the start of Q4 but until then they can still rise as ETH.D continues its rally but I feel until altcoins reach its range lows being the .25 lvl on (TOTAL3-USDT)/BTC we will not see that face melting rally we are looking for.

ETHUSD – Possible Correction from Channel Resistance!Pair: ETH/USD
Timeframe: 4H
Structure: Ascending Channel
Indicators: RSI Overbought, Bearish Divergence Forming
Volume: Spike into resistance
📉 What’s happening?
Ethereum just tagged the top of its ascending channel, showing early signs of rejection. RSI is hovering near overbought, with weakening momentum on the last push.
⚠️ Caution Zone:
$3,425 acting as upper resistance
Price may retrace to midline or lower channel support ($3,250 → $3,050 range)
📌 Confirmation:
Look for:
A strong bearish candle or
RSI breaking below 60
Volume divergence
Bias: Short-term bearish correction, bullish structure intact as long as price holds the channel.

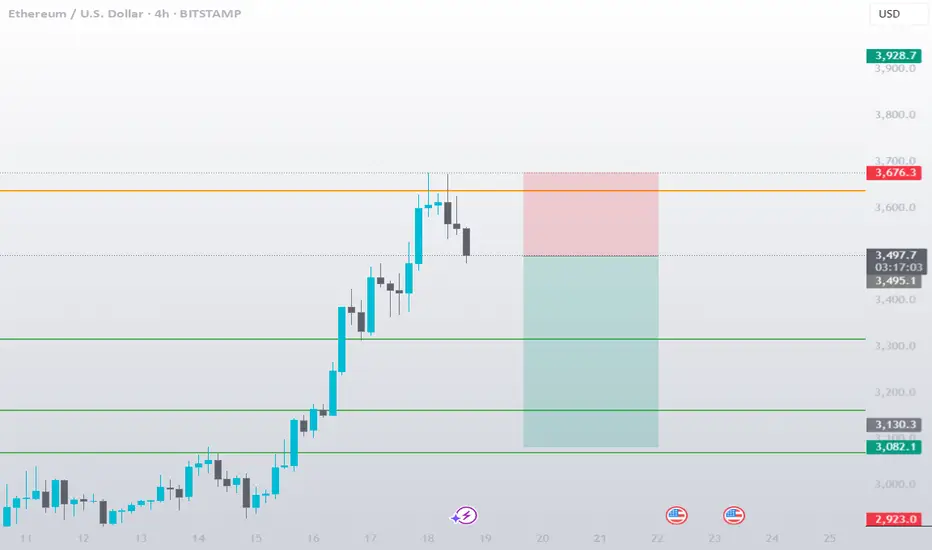
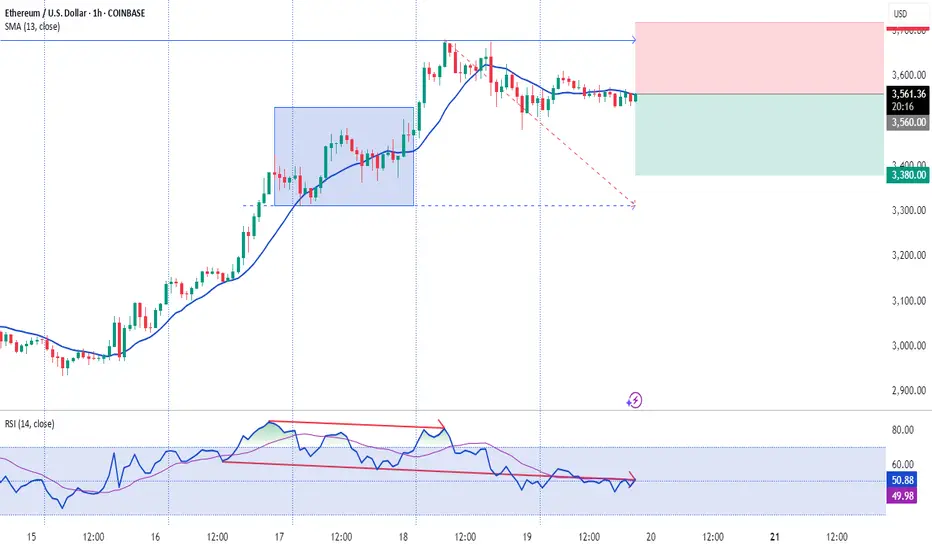
ETH SHORT || 4 HOUR CHARTEthereum just made a huge parabolic move and tapped into a key daily resistance zone around $3,676. Price is now reacting with a bearish candle on the 4H, suggesting a likely pullback.
🧠 Trade Idea: Short ETH/USD
Entry: $3,495 (current level)
Stop Loss: $3,676 (above resistance)
Take Profit: $3,130 / $3,082 (support targets marked on chart)
📌 Commentary:
ETH has been in a strong uptrend, but such parabolic rallies often retrace sharply once momentum fades. Given the strong rejection at daily resistance and the bearish 4H setup, I’m expecting a short-term retracement to the marked support levels.
📊 Watching price action closely near those zones for potential bounce setups.
🚨 Not financial advice. Always use proper risk management.