ETHEREUM WILL KEEP GROWING|LONG|
✅ETHEREUM is trading in a
Strong uptrend and the coin
Broke the important horizontal level
Of 3000$ which is now a support
And we are very bullish biased
And we think that ETH will
Reach at least the previous ATH
Of just short of 5000$ but the
First target is to reach and break
A resistance level of 4100$
LONG🚀
✅Like and subscribe to never miss a new idea!✅
Disclosure: I am part of Trade Nation's Influencer program and receive a monthly fee for using their TradingView charts in my analysis.
ETHUSD.P trade ideas

ETH — Trade Closed! Massive Profit SecuredI’m officially closing my Ethereum position — this trade is now a success story!
I posted right here that ETH was a buy at $2400, then doubled down at $1800. I even echoed the call on Reddit for good measure.
Today, I’m liquidating the entire position with a huge gain. No regrets, just clean execution. 🧠💸
To all the mad lads still holding — good luck and may your conviction be rewarded.
See you next year for the next big swing.
Take your profits, you lunatics! 😄🔥

ETHUSD - Bullish Flag PatternETHUSD is making Bullish Flag Pattern, will it move towards target after breakout?
Entry, Stop Loss & Take Profit are mentioned.

Eth looks ready to meThe range is going to break soon, price looks primed to test 3200 area. Lots of wicks cleared overhead resistance. My plan is to take 25% off at 3200 and let the rest run. I like Eth to hit ATH by around Thanksgiving. On the TD indicator (momentum), eth is hitting green 2s on a lot of bigger timeframes, this is not something that happens too often. Last time i came across such a confluence it was Zoom pre-covid.

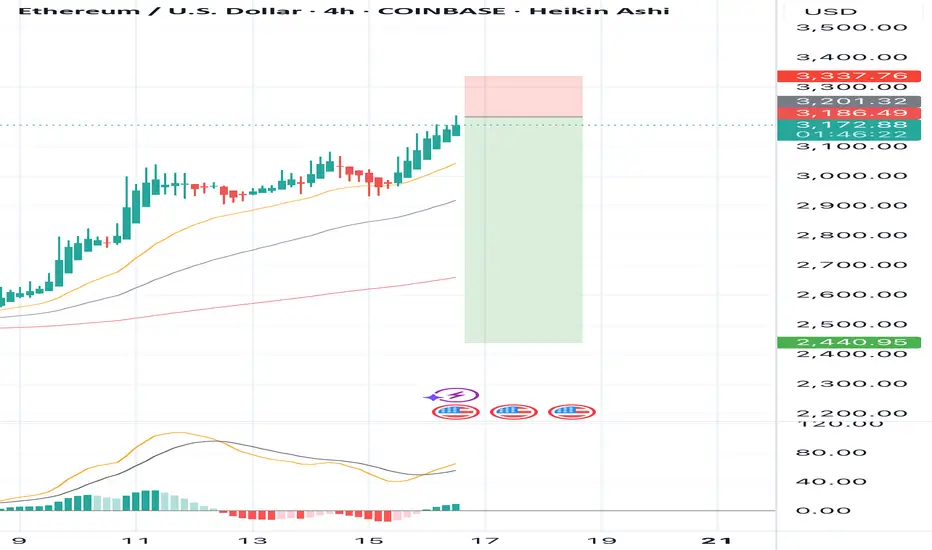
SELL ETHUSD for bullish divergence trend reversal STOP LOSS: 3,3SELL ETHUSD for bullish divergence trend reversal STOP LOSS: 3,337
Regular Bearish Divergence
In case of Regular Bearish Divergence:
* The Indicator shows Lower Highs
* Actual Market Price shows Higher Highs
We can see a strong divergence on the MACD already and There is a strong trend reversal on the daily time frame chart.....
The daily time frame is showing strength of trend reversal from this level resistance so we are looking for the trend reversal and correction push from here .....
TAKE PROFIT: take profit will be when the trend comes to an end, feel from to send me a direct DM if you have any question about take profit or anything
Remember to risk only what you are comfortable with........trading with the trend, patient and good risk management is the key to success here...
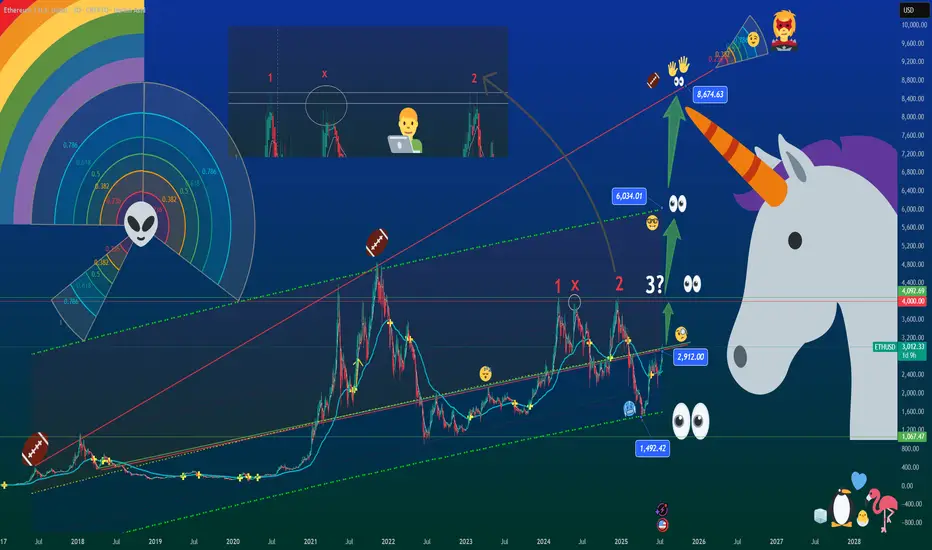
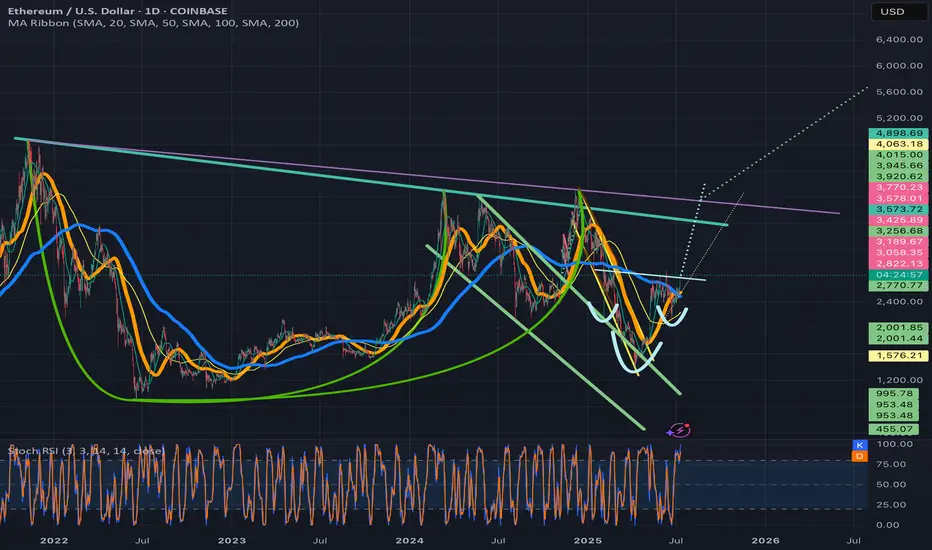
The Unicorn Breakout – Regression, Madness & Meme Math🦄 The Unicorn Breakout – Regression, Madness & Meme Math
FX_Professor | July 14, 2025
🎨 Welcome to my world…
Some draw straight lines.
I draw quadratic regression channels, alien spirals, and unicorns.
Because sometimes, the market is not just math — it’s emotion, storytelling, and madness therapy.
This chart isn’t just analysis. It’s a prophecy. It’s a canvas.
It’s for the traders who still feel.
📈 What are we looking at?
🧠 The Setup:
- Quadratic Regression Channel: Anchored from the 2018 top, respected for over 7 years. ETH is bouncing off the midline like it heard destiny calling.
- Major Resistance: The $2,900–$3,100 zone is our historic ceiling. Marked as 1 – X – 2… and next, not maybe but SURELY the decisive number3? 🚨 (X stands for 'no touch' ie 'close but no cigar' - Look at my recent BTC 1-2-3 breakout posts!)
- My Golden Cross: Quietly forming support. Check that xx/Xxx Secret EMA crossover. Setup reserved as a little family secret destined to be passed on to my sons (and some of you!).
- Alien Spiral (not Fib 😉 ): A colorful vortex leading us toward areas of re-accumulation and expansion. ETH is now riding the 0.382 arc — and you know what that means...
🚀 Targets:
- $4,000 — First milestone and zone of psychological resistance
- $6,034 — Mid-regression line + historical extension
- $8,674 — Unicorn Target Zone. Meme ATH + Euphoric breakout + Regression logic
👽 The Floor:
$1,067 – $1,492 — Alien Support Range™. If we nuke, that’s where we land, in pain. That's when we apply for jobs at Taco Bell (at least i love the food there, i am prepared for that scenario too).
🦇✨ Ethereum Community — this might be your time.
Dear ETH fam...
This isn't hopium.
This is regression math meeting Breakout Structure.
ETH has reclaimed key levels, rotated capital is flowing, and Bitcoin dominance is peaking. . WAIT FOR MY ETHBTC ANALYSIS (ON SUPPORT AND REBOUNDING)
The Unicorn doesn't knock twice.
If Ethereum Season is real — this chart might age beautifully.
🤹 Why the chaos?
Because markets are art.
Because crypto is culture. (and yes it's also 90% shit, you will hear a lot about that when that time comes).
Because every emoji here has meaning:
🦄 = Imagination
👀 = Momentum watchers
👽 = Alternative thinking
🏈 = Painful resistances, mental and physical toughness builds champions. Patience Wins!
🥶 = Cold accumulation
🧑💻 = Professor mode
🐧❤️🔥🐤🦩 = Read below…
🧊 The Penguin Message
Bottom right, you’ll see a penguin family :
A penguin, a flamingo, a baby chick, and a blue heart.
That’s not just decoration — it’s the real alpha.
💙 The best blockchain is YOU.
👶 The best altcoins are your CHILDREN.
🧊 The best staking is your FAMILY.
Trade smart. Build cool stuff. But don’t forget to be a good human.
The charts will wait. But your people won’t.
Spend time wisely: Learn skills, invest in YOURSELF, enjoy moments with loved ones, make others smile, be that change in the world.... and if you don't have kids then what on earth are you doing?? Go get laid, now! You are ready, stop thinking, just Do It (disclaimer: unless you have 5 already, in that case pls invest in condoms)
Share this with someone who needs to see this. Or just save it as 'ETH season'.
FX Professor — out.
🦄📈👁️
#ETH #Ethereum #UnicornBreakout #CryptoArt #QuadraticRegression #Altseason #TradingView #ChartTherapy #BeAGoodHuman
ETH Cycle TopETH is following a very similar setup to BTC in the previous cycle. This move should play out by the end of the year.
Ethusd breaking above invh&sEthusd chart has a similar set upas the total2 chart, a cup and handle that is breaking up from a smaller inverse head and shoulders that will complete the handle to the cup. Ethereum actually has two potential to trendlines for its cup and handle and I wouldn’t be surprised if both are valid. The breakout target for the inverse head and shoulder pattern will take price action above both of them. Once we solidify the top trendline for the cup and handle patterns as support the breakout target for it is $7161. Ethereum just recently had a golden cross on the daily which adds to the probability the inverse head and shoulder pattern breakout will be validated. *not financial advice*
### **Bearish Analysis of Ethereum (ETH)**### **Bearish Analysis of Ethereum (ETH)**
Here is a bearish outlook on Ethereum (ETH) based on current market dynamics, incorporating technical, liquidity, and fundamental factors:
---
### **1. Technical Resistance & Topping Signals**
- **Key Resistance Zone**: ETH has repeatedly tested the **$3,000–$3,080** resistance level but failed to sustain a breakout. If it cannot hold above this range, a pullback toward **$2,865** or even **$2,710** is likely.
- **Daily Chart Topping Pattern**: Some analysts suggest the current rally may form a "daily top." While an immediate reversal is unlikely, the trend could shift to bearish dominance, with potential resistance near **$3,160**.
- **Overbought Risk**: The RSI has exceeded 70, indicating short-term overbought conditions. A loss of momentum could trigger a correction.
---
### **2. Heavy Shorting by Hedge Funds & Basis Arbitrage**
- **Surge in Short Positions**: CFTC data shows hedge funds have amassed **$1.73 billion** in ETH short positions on CME, marking a record high in net leveraged short exposure.
- **Basis Arbitrage Strategy**: Institutions are executing delta-neutral strategies by shorting futures while buying spot ETFs (annualized arbitrage ~9.5%). However, heightened volatility (e.g., a "Black Thursday"-like event) could trigger a short squeeze.
- **Whale Shorting Activity**: High-leverage (4.1x) short positions by whales (e.g., 0xSifu) reflect market skepticism about ETH's long-term competitiveness.
---
### **3. Fundamental Weaknesses**
- **Ecosystem Underperformance**: In 2025, ETH was among the worst-performing top-five crypto assets (down 51% YTD), lagging behind competitors like Solana. DeFi TVL has dropped **43%**, signaling declining user engagement.
- **Staking Risks**: While **29% of ETH is staked**, reducing liquid supply, high staking ratios may constrain market liquidity. A price drop could trigger panic unstaking.
- **Institutional Selling Pressure**: The Ethereum Foundation recently sold **1,206.7 ETH (~$3.6 million)**, fueling concerns about insider divestment.
---
### **4. Market Sentiment & Capital Flows**
- **BTC Dominance Pressure**: Bitcoin’s recent all-time high (**$118,000**) may divert capital away from ETH and other altcoins.
- **Extreme Short Positioning**: ETH’s open interest shows **62% short bias**, the highest since 2021. While this raises short-squeeze risks, it also reflects doubts about the sustainability of the rally.
---
### **5. Key Risks & Outlook**
- **Downside Triggers**:
- A break below **$2,865** could accelerate a drop toward **$2,530**.
- A Fed policy shift or global liquidity tightening.
- Competitors (e.g., Solana) gaining further market share.
- **Potential Reversal Signals**:
- A sustained breakout above **$3,080** may force short covering.
- If the **ETH/BTC ratio** surpasses **0.026 BTC**, an altcoin season could emerge.
---
### **Conclusion**
In the short term, ETH faces headwinds from technical resistance, institutional shorting, and capital rotation into Bitcoin. The bearish thesis holds for now, but extreme short positioning raises the risk of a squeeze. Traders should monitor:
- The **$3,080** resistance and **$2,865** support levels.
- Bitcoin’s market dominance and macroeconomic policy shifts.
ETH CUP & HANDLE BOWith the cup‑and‑handle pattern that started in February 2025 now pierced above $2,800, the measured move targets the next ceiling around $4,000.
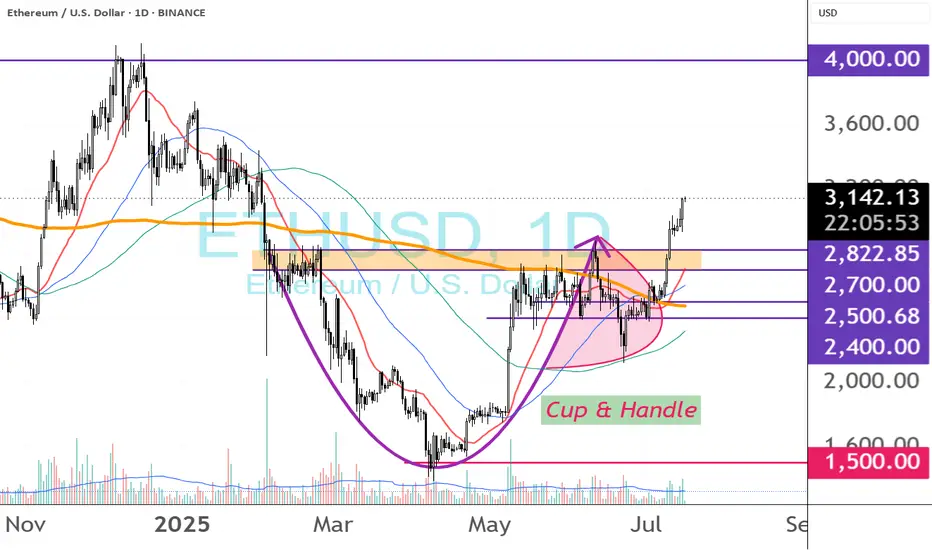
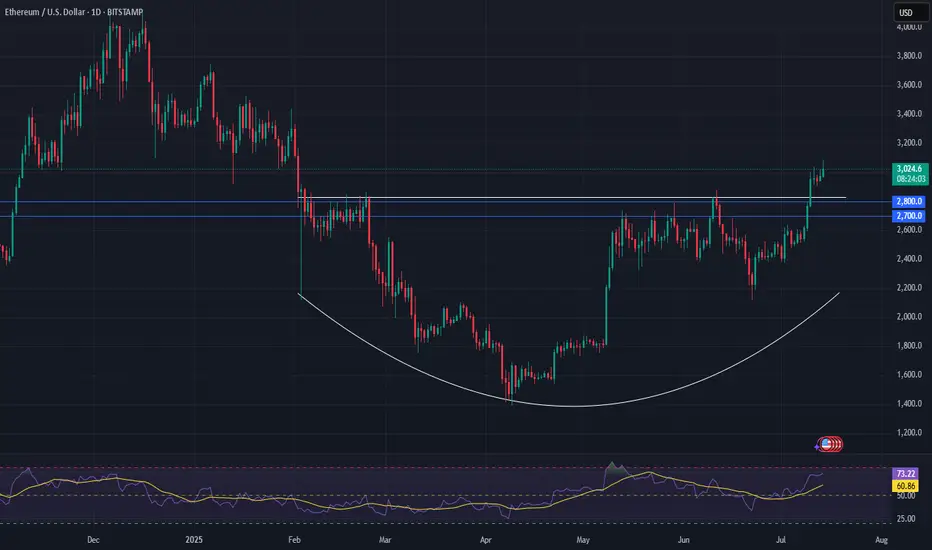
Ethereum Set for a Major Move — Watch $2,700–$2,800Epic Base Forming:
Ethereum is building a powerful base, and the fundamental dynamics have shifted significantly in recent weeks. With ETF fund flows hitting new highs, institutional interest is clearly growing.
Tight Setup for a Short Squeeze:
Meanwhile, the futures market shows a near-record short position, creating a high-potential setup for a massive short squeeze. Even without the chart, this kind of positioning mismatch is rare—and explosive.
Technical Watch Zone:
Ethereum is pressing into key resistance from a rounding bottom. The critical level to watch is $2,700–$2,800. A clean breakout here could ignite a sharp rally, with $4,000+ back on the table in short order.
This is a textbook setup—fundamentals, sentiment, and technicals are aligning.
#Ethereum #ETH #Crypto #TechnicalAnalysis #ShortSqueeze #ETFFlows #MarketSetup #Bullish #Altcoins #CryptoTrading #WatchList
ETHUSD | Breakout Watch Above $3,040Ethereum has surged above the critical $2,530 resistance zone and is now challenging $3,040, a key structure level. A daily close above this could open the path toward $3,537 and even $4,056 in the mid-term.
Support at: 2,530 / 2,100 / 1,830 🔽
Resistance at: 3,537.93 / 4,056.40 🔼
🔎 Bias:
🔼 Bullish: Holding above 2,530 confirms breakout structure; a clean break above 3,040 targets higher zones.
🔽 Bearish: Failure to stay above 3,040 may invite a retest of 2,530.
📛 Disclaimer: This is not financial advice. Trade at your own risk.

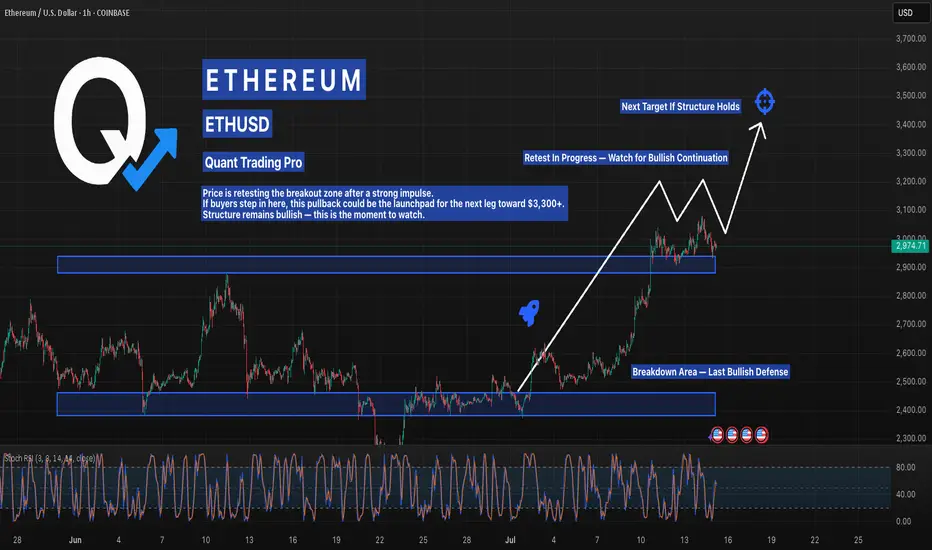
Ethereum Is Coiled and Ready — Pullback or Launchpad?ETH is pulling back into a key breakout zone after a strong leg up — and the next move could be explosive. Price action remains clean, with bullish structure intact and a textbook retest underway. If support holds, a surge toward $3,300–$3,500 is on the table.
Momentum has reset, giving bulls the fuel they need. This is where traders prepare — not chase.
#ETHUSD #EthereumBreakout #CryptoTrading #BacktestYourEdge #QuantTradingPro #TradingView #TechnicalAnalysis
Ethereum - It's about damn time!Ethereum has been slacking for a couple of years.
The strong catalyst to excel Ethereum just seems to be lingering compared to the first 5 years.
So, it looks like it's just following suit with Bitcoin current rally, as it hits all time highs and shines confidence to the rest.
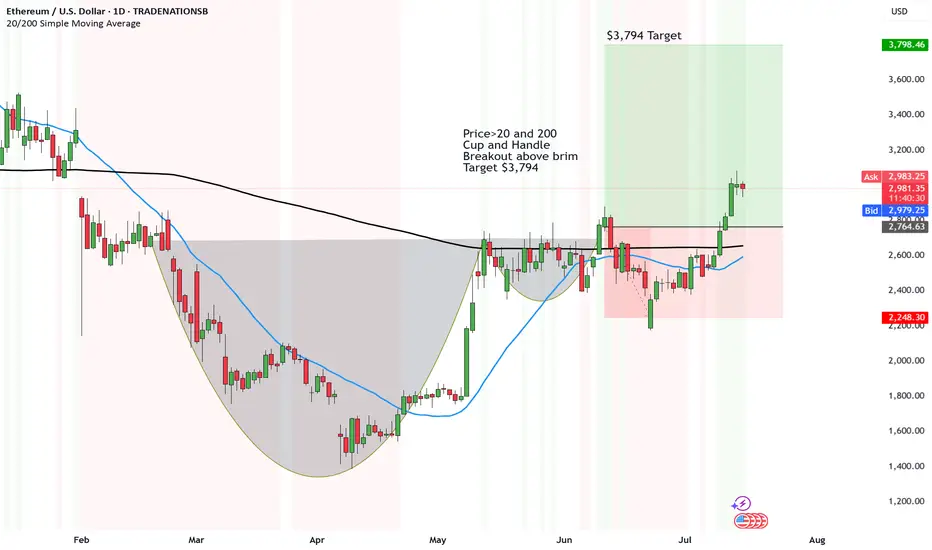
So the update with Ethereum remains to be the same.
Price>20 and 200
Cup and Handle
Breakout above brim
Target $3,794
Disclosure: I am part of Trade Nation's Influencer program and receive a monthly fee for using their TradingView charts in my analysis.
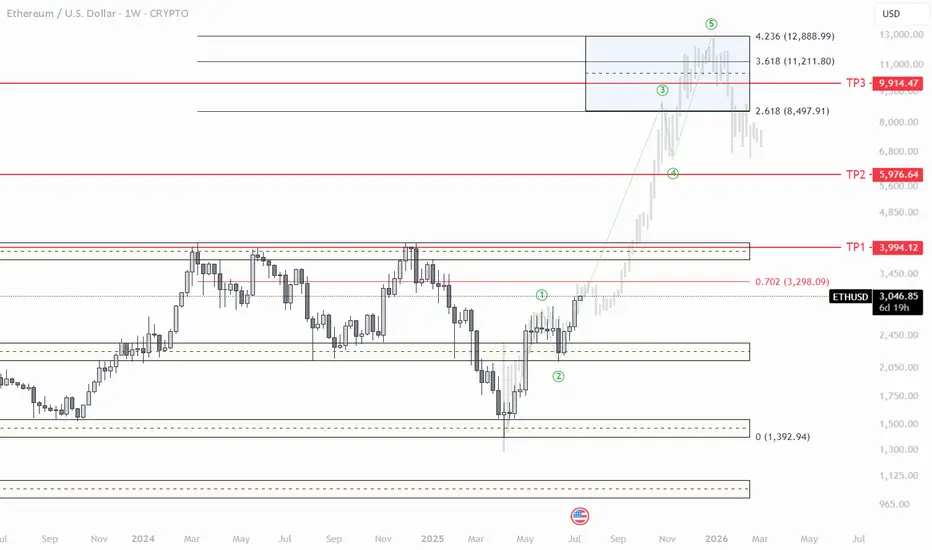
$ETH Pullback to $2630 Support?CRYPTOCAP:ETH has a great week pushing through resistance and making new local highs after testing the daily 200EMA and daily pivot as support.
Price is likely to retest the swing high and previous resistance as support around $2600-2700, also the .382 Fibonacci retracement.
RSI is printing daily bearish divergence in overbought from the wave (3) top to current as it did at the wave (5) top seeing large rejection. The retest of $2600 would reset RSI.
Price is ultimately set to test $3600 as the next resistance if the Elliot wave count is correct.
Analysis is invalidated below $2050
Safe trading

ETHUSD: Two situationsOn ETHUSD we are faced with two situations. We would have an uptrend when the resistance line is broken forcefully by the buyers. Furthermore, we would have a bearish trend if the support line is broken forcefully by the sellers.

Will Ethereum reach 15K soon?In my video I share why is it possible for Eth to reach 14-17K in the next months.
Disclaimer: Not a financial advice

ETH way to test ATHEthereum is making its way toward testing its all-time high, but there are some strong resistance levels in the way—most notably around the $3.5K mark. Still, the technicals are showing promise: RSI has broken out of its trendline, and the monthly Stochastic RSI looks bullish, signaling strong upward momentum.
How ETH reacts to these resistance zones will be key. Historically, Ethereum has led the altcoin market, so if it breaks its ATH, we could see a rapid surge across altcoins. Until then, we’re likely in the middle of a "mini altseason"—some coins running, but the real breakout comes once ETH confirms the move.
Bullish continuation?The Ethereum (ETH?USD) is falling towards the pivot which is a pullback support and could bounce to the 1st resistance.
Pivot: 2,821.91
1st Support: 2,649.43
1st Resistance: 3,077.96
Risk Warning:
Trading Forex and CFDs carries a high level of risk to your capital and you should only trade with money you can afford to lose. Trading Forex and CFDs may not be suitable for all investors, so please ensure that you fully understand the risks involved and seek independent advice if necessary.
Disclaimer:
The above opinions given constitute general market commentary, and do not constitute the opinion or advice of IC Markets or any form of personal or investment advice.
Any opinions, news, research, analyses, prices, other information, or links to third-party sites contained on this website are provided on an "as-is" basis, are intended only to be informative, is not an advice nor a recommendation, nor research, or a record of our trading prices, or an offer of, or solicitation for a transaction in any financial instrument and thus should not be treated as such. The information provided does not involve any specific investment objectives, financial situation and needs of any specific person who may receive it. Please be aware, that past performance is not a reliable indicator of future performance and/or results. Past Performance or Forward-looking scenarios based upon the reasonable beliefs of the third-party provider are not a guarantee of future performance. Actual results may differ materially from those anticipated in forward-looking or past performance statements. IC Markets makes no representation or warranty and assumes no liability as to the accuracy or completeness of the information provided, nor any loss arising from any investment based on a recommendation, forecast or any information supplied by any third-party.

Bullish continuation-3400 ZONEAs ethusd is lingering around 3000 zone expect a minor retracememt in preparations for the engulfing, target 3400/5028 zone

(ETH/USD) Bullish Setup: Entry at $2,422 with Target at $2,521 a1. Entry Point: ~2,422.2
This is the suggested buy area based on a recent bounce from the support zone
2. Support Zone (Purple Box):
Bottom boundary: ~2,392.4
Top boundary: ~2,408.4
Price has bounced multiple times here, showing strong buying interest.
3. Resistance Point: ~2,463.9
A clear horizontal resistance line, previously tested.
4. EA Target Point: ~2,522.1
A bullish target if the price breaks above the resistance level.
🔶 Highlighted Patterns / Markers
Orange Circles: Indicate key swing highs and lows — possibly used to identify double tops/bottoms or rejection/wick zones.
Blue Arrows: Illustrate the anticipated move from:
Entry (2,408.1) → Resistance (2,463.9) → Target (2,521.2)
Target gain = +111.7 USD (+4.64%)
🔻 Stop Loss Level
Set just below the support box at ~2,392.4
Protects from false breakouts or deeper pullbacks.
📈 Strategy Outlook
Bullish Bias: The setup expects a breakout from the current price range.
Risk-Reward Ratio: Appears favorable — tight stop and wide target.
Confirmation Needed: A solid breakout and hold above 2,423–2,425 may be the early confirmation signal.
📌 Summary
Element Value
Entry Point ~2,422.2
Stop Loss ~2,392.4
Resistance ~2,463.9
Target (TP) ~2,521.2
R:R Ratio Approx. 3:1
Bias Bullish

ETH BUY SETUP , Bought From $3024ETH BUY SETUP
Currently $3024
Bought From $3024
(Trading plan If ETH go down to $2900
will add more longs)
Expecting target $3100 OR ABOVE
In the event of an early exit,
this analysis will be updated.
Its not a Financial advice

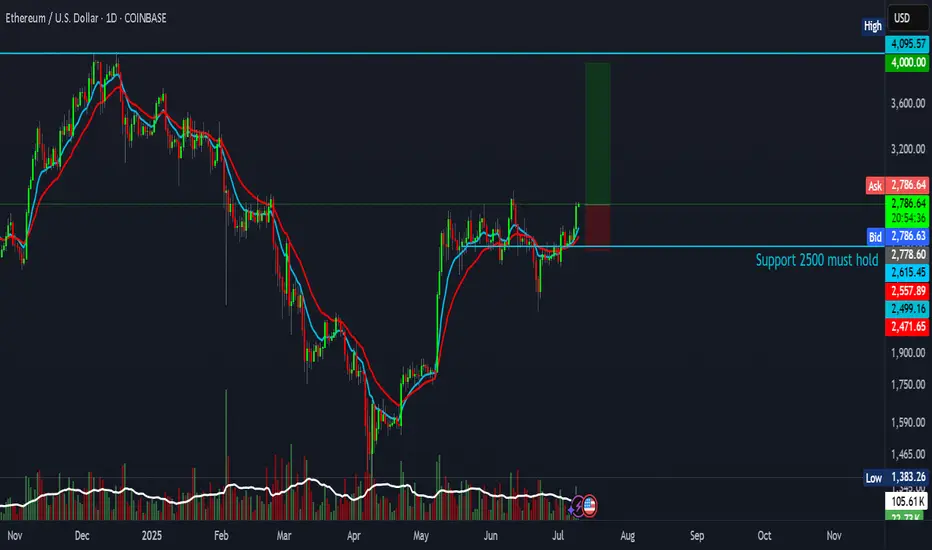
Ethereum trade setup with a 4:1 risk-reward ratioAnother attempt — and this one could be the real breakout.
This setup offers a 4:1 risk-reward ratio, targeting $4,000.
Entry: $2,780
Stop Loss: $2,471
Target: $4,000
Not financial advice.