Ether is a buy between 1300-1500!!This price point is significant as it aligns with Ethereum's previous highs from 2018, suggesting a potential support level. The occurrence of a monthly divergence indicates that selling pressure may be diminishing, potentially paving the way for a bullish reversal.
Looking ahead, industry projections are optimistic about Ethereum's future performance. Analysts anticipate that Ethereum could reach new all-time highs, with some forecasts suggesting prices exceeding $5,000 in the coming year.
From a fundamental perspective, Ethereum's transition to a proof-of-stake consensus mechanism has significantly reduced its energy consumption and introduced deflationary pressures on its supply. This shift, along with ongoing network upgrades, enhances Ethereum's scalability and security, reinforcing its position as a leading platform for decentralized applications and finance.
Furthermore, the approval of Ethereum-focused exchange-traded funds (ETFs) has opened new avenues for institutional investment, contributing to increased demand and potential price appreciation.
In summary, the current price dip presents a favorable buying opportunity, supported by technical indicators and robust economic fundamentals. With continued network enhancements and growing institutional interest, Ethereum's outlook remains positive.
Please note alot of these things can take time to reflect in price. So although some of these news are a few years long it does not make it any less impactful! Buy when there is blood on the street.
ETHUSD.P trade ideas

ETH Update 25-7-11so I know this is a bit of a weird view but I like to zoom out sometimes and I like this blue corridor. Personally, I think the demand for ETH speaks for itself so eventually it will see new highs and everything. This is just a way to gauge the next moves. It will probably mimic BTC with its head and shoulders pattern but be more amplified even though it’s lagging behind still and has been for years.
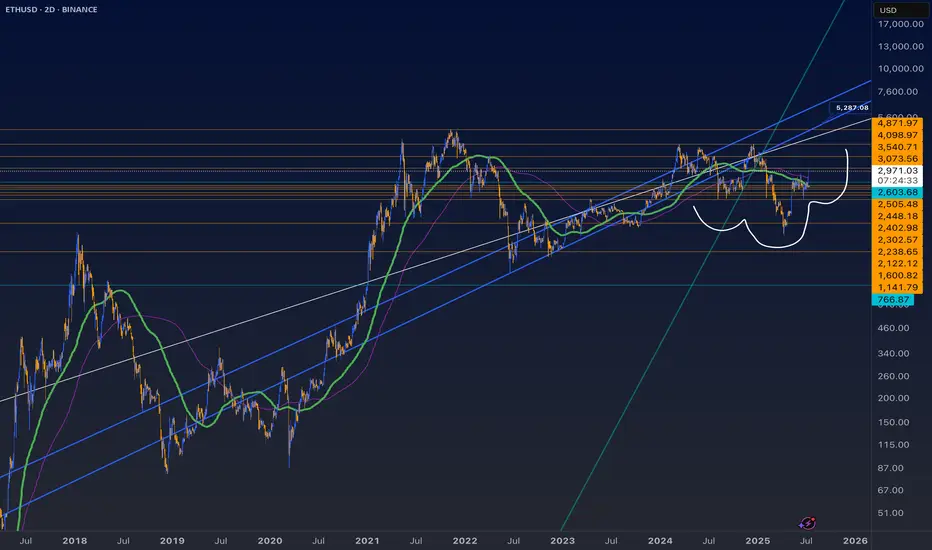
I'm predicting ETH to $4K = Diamond handsThis chart shows you ETH's whole existance bar the beginning, but as you can see, each time there was a strong increase, it solidated until it final toppled over and came down the other side. But for 2025 its still 40% off where it should be in terms of overall flow, so that means there is technically still 40% margin to be had. I would love to pull out now, but I'm going to just Diamond hands, this thing. I don't need the money, and its already grown 40% so if I can get a bit more why not. But inevitable I'd love to just keep on holding for ever, I'll try. Good luck people think with your brain not your heart. This is not technical advice.

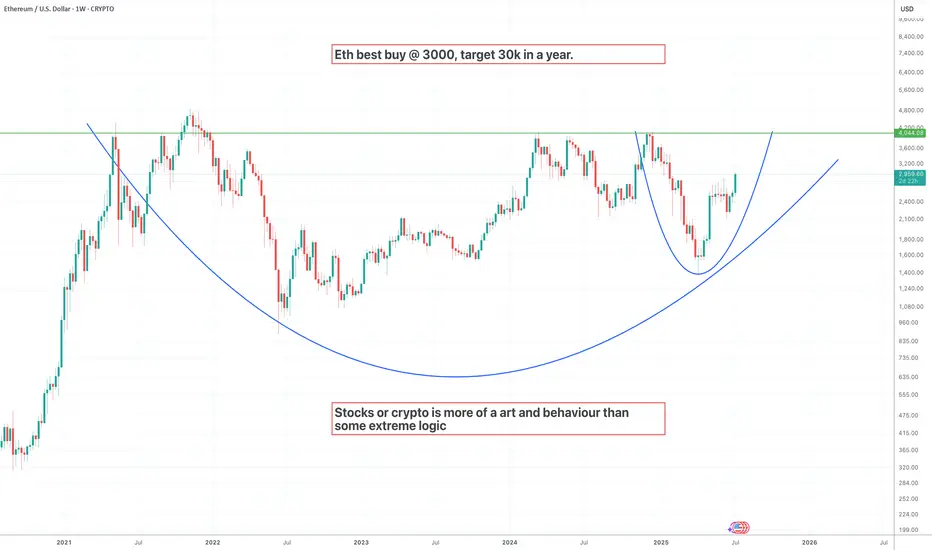
Ethusd next target 30kETH just painted the cup. Now comes the rocket. 🚀
Buy zone was $3,000 — now entering escape velocity.
🎯 Target: $30,000 within 12 months.
Crypto isn’t just logic — it’s human behavior + belief cycles.
This is art in motion. Don't blink. 👀
#Ethereum #Crypto #Altseason #BullMarket #UniproAI™
ETHUSD-SELL strategy 6 hourly chart Reg.ChannelAs usual, Crypto is highly volatile, and the crowd expectation of much higher levels, is the hype we are dealing with. Fair to say, short-term fundamentals reasons may support the current move, but technically no0w we are very overbought short-term.
Str5ategy SELL @ $ 2,940-3,000 or higher (scaling in carefully) and take profit near $ 2,725 for now.

Moonboi? 👦 You have to be a LUNA-tic ''Oh Professor you are a Moonboi, you only post Long positions.''
Well Thank God everything I post (and everything you post) stays here for EVER:
Show me just ONE author with Short ideas on Luna from 110$ to 5$ (i had around 9 posts proposing shorts, needless to say you can check everything here:
and here and here
Ethereum Short positions from close to 5,000$ here:
Dip on Ethereum bough here:
I am not going to go deeper into this, there is no need, you can check how many short positions i gave on Ape from 20$ and other projects.
In a few words:
- I post what i see (and what i trade)
- In the past month I have been Bullish and switched some shorts to longs (Ethereum for example)
- I always hedge even my posts: some Long some Short
- You do your own research, what we post here is just our ideas
- Try to post something too, it's the best way to make Tradingview better! Would be happy to give you my 5 cents of advise on any chart
And yes, remember to hedge but also remember to pick a side and stick with it... like right now: I have been LONG since this:
PS. all the Gurus/experts on Twitter: post some Tradingview ideas sometime..best feature of Tradingview is that EVERYTHING stays documented.
Twitter? OMG! It's a different story! I feel SO sorry for people looking at Twitter and Youtube and expecting to get nothing more than MOSTLY BULLCRAP!
One Love,
The FXPROFESSOR

ETH Not Taking Profits Yet – System Still Long
ETH on the 4H is pausing right at the 3D 200MA, picture perfect, actually.
Now we wait to see if this resistance flips into support.
If that happens, price could go for the 0.382 Fib level around $3,040.
Of course, that’s the ideal scenario, but the market could easily contradict me, so keep that in mind.
Personally, it’s not time to take profits yet.
Both my 4H and 1D systems are still in long positions.
For extra safety, you could set a partial take-profit just under the second-to-last PSAR dot.
Always take profits and manage risk.
Interaction is welcome.

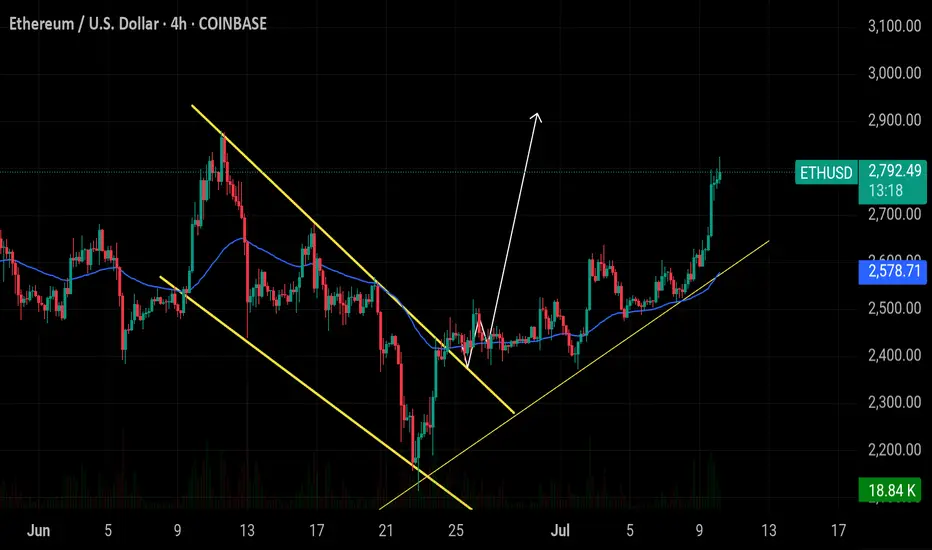
ETH Decision Zone: Breakout or Bull Trap?Ethereum (ETHUSD) just broke out of a tight symmetrical triangle on the 1H chart — but price is now stalling near the previous high, signaling a critical decision point.
📊 Key Technical Notes:
🔹 Triangle Breakout: Clean push above downtrend resistance, but no candle close above key high.
🔹 Previous High Acting as Resistance: Bulls need continuation to validate this move.
🔹 Two Scenarios in Play:
1️⃣ Bullish Continuation:
→ ETH breaks and holds above ~$2,865
→ Next resistance levels sit at $3,000+
2️⃣ Bearish Rejection / Fakeout:
→ Rejection from highs
→ Retest of triangle → Failure = drop toward previous low near $2,150
🎯 Risk-Reward Defined — both long and short setups are clearly outlined.

Bullish on ETHWe took out SSL, then price broke down and inverted towards bullish price action. Target is previous double tops at 4200

$ETH 4H Update: Both Targets Hit! Ethereum successfully reacheCRYPTOCAP:ETH 4H Update:
Both Targets Hit! Ethereum successfully reached both $2,600 and $2,800 after the breakout.
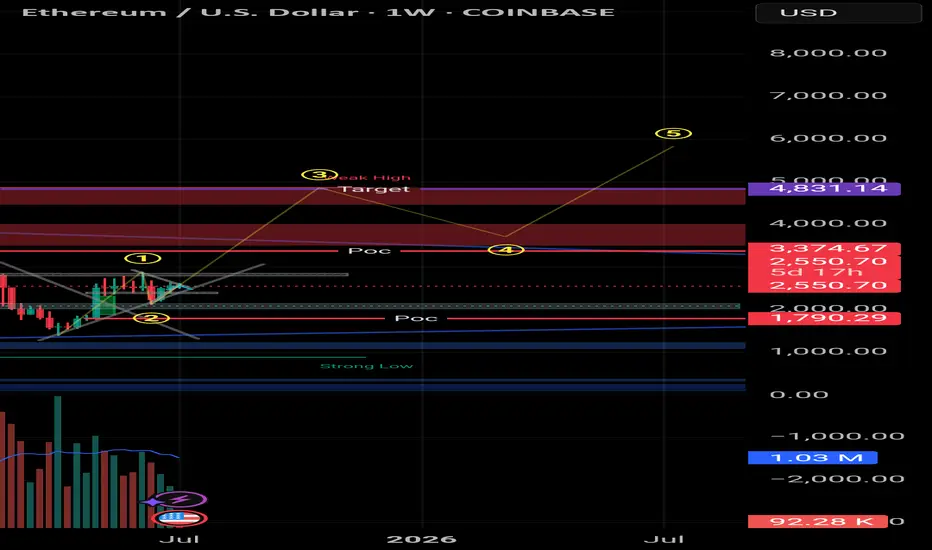
Etherium is forming MeghahorneKey Elements in the Chart:
Wave Count (Possibly 1,2,3,4,5):
The chart shows a potential Elliott Wave formation inside a "Megaphone" (broadening wedge) pattern.
The current wave appears to be completing Wave 4, heading toward Wave 5.
Buy Zone and No Trading Zone:
A "Buy Above" level is marked just above $2,763, indicating a bullish breakout confirmation.
A "No Trading Zone" is identified between ~$2,378 and ~$2,763, suggesting uncertainty or consolidation.
Downside Targets (If bearish breakout occurs):
Target 1: Around ~$1,900.
Target 2: Much lower, near ~$1,000.
Indicators:
Bollinger Bands are applied, suggesting increased volatility within the megaphone pattern.

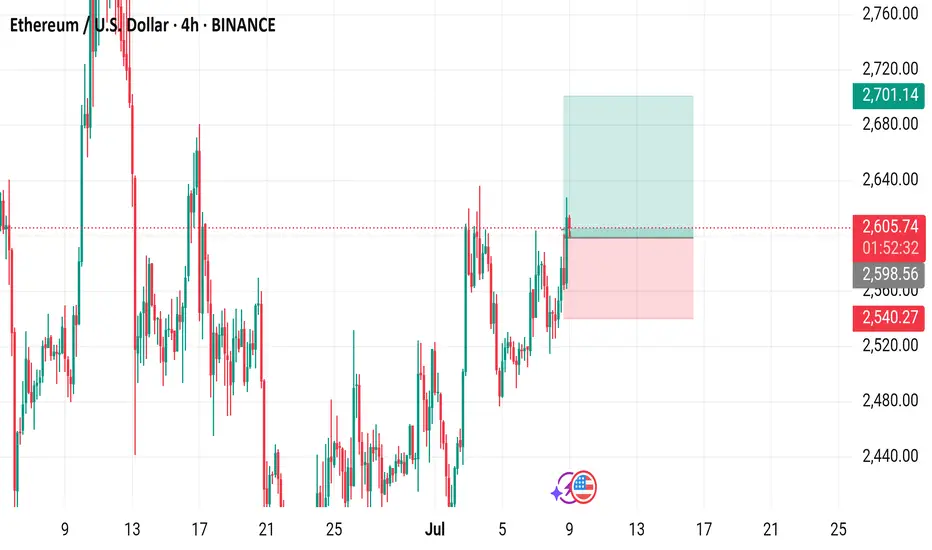
Ethereum (ETH) to U.S. Dollar (USD) 4-Hour Chart - Binance4-hour candlestick chart from Binance displays the price movement of Ethereum (ETH) against the U.S. Dollar (USD) from late June to early July 2025. The current price is $2,608.76, reflecting a +$65.53 (+2.58%) change. The chart includes buy and sell indicators at $2,608.76, with a highlighted resistance zone around $2,700-$2,760 and a support zone around $2,540-$2,600. The chart also shows a recent upward trend with fluctuating volatility.
Ethereum (ETH) Market UpdateOrder Flow Signals Bullish Momentum
The current order flow structure for Ethereum is decisively bullish. Buy-side liquidity is dominant, indicating strong demand from market participants. This suggests that institutional and smart money flows are favoring long positions, providing solid support for higher price continuation.
Daily Fair Value Gap (FVG) Holding as a Strong Support Zone
The daily timeframe shows a key Fair Value Gap (FVG) that has been respected multiple times. This zone has acted as a significant area of demand, absorbing selling pressure and fueling upward momentum. As long as price holds above this level, the bias remains strongly in favor of continued bullish price action.
Correlation with Bitcoin’s Strength
Bitcoin’s current bullish structure is reinforcing ETH’s outlook. As BTC continues to maintain upward momentum and structure, ETH is benefiting from the positive market sentiment and correlation. Historically, Ethereum often follows Bitcoin’s macro trend, and this synchronized bullish movement adds further conviction to ETH’s upside potential.
ETHUSD: Bullish Momentum, SUPPORT:2400/2100 TARGET=3400/3700The ETH/USD chart looks bullish, with room to move higher toward $3,400 and possibly $3,700. If the trend loses steam, support near $2,400 could come into play.

Ethereum Bullish Rally IncomingIf Ethereum can break above that point and clear $2,840, this level will turn into a major support, where fresh supply waits. However, a drop below the 200-EMA could lead the price to retest $2,400. A break below this level would shift momentum negative and risk a slide toward the April low near $1,500.
Read More at: www.cointrust.com

ETHUSD – From Dip to DecisionETH swept lows at $2,460 then began a steady stair-step recovery. After reclaiming $2,580, it climbed into $2,630 and is consolidating just under resistance. Bulls need to break $2,645 to maintain momentum — failure to do so might bring a retest of $2,600.

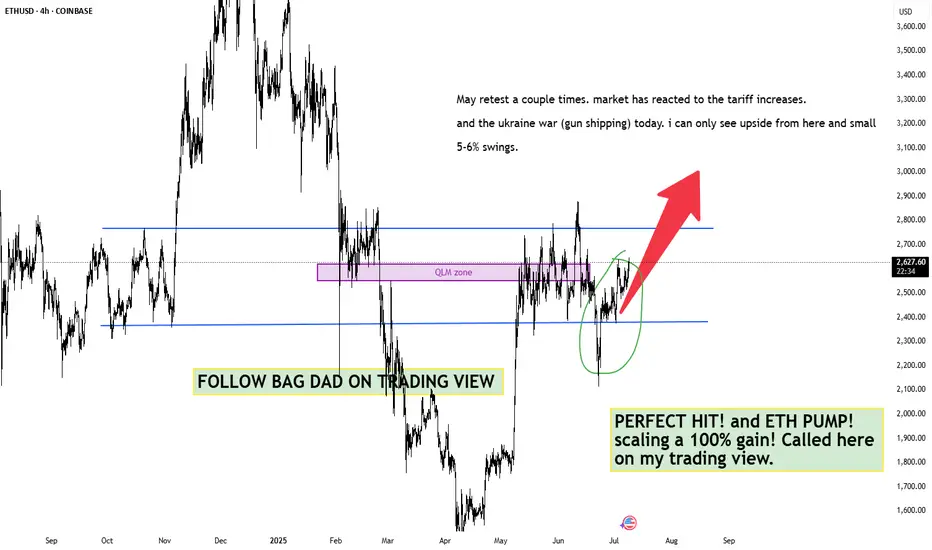
$ETH UPDATE 2 (series 11) bull incoming. altseasonWe are very close to pressing insane ranges on bitcoin and eth starting the super cycle of alts and memecoins. i first want to indicate all my longs i called have been made here on the trading view and with full transparecey. not confusing people with bull crap chart patterns.
realistic scaling and simple common sense on these longs. QLM zone is obvious here. RSI looked healthy and good. only overbought a couple times.
lets hope tomorrow we see a trump pump from the tariff announcements on apparent deals!
ETH///LONG///4h TIME FRAMEETH braking trend lines on 4h. Trendline is from 30 days. 1:2 risk to reward. GL

Crypto Don't sleep on ETHHI it me again
don't you like my chart it's so beautiful right just look at the profits and % the everything well I'm drop something like this all week
COINBASE:ETHUSD

ETH to 3KETH is looking set to challenge the 3k level.
You can see by the small breakout and old resistance acting as new support levels at fig 1 that ETH is building towards a leg up.
Look for ETH to move higher with a small breakout (fig 2), retest (fig 3) before moving higher towards the 3K range.

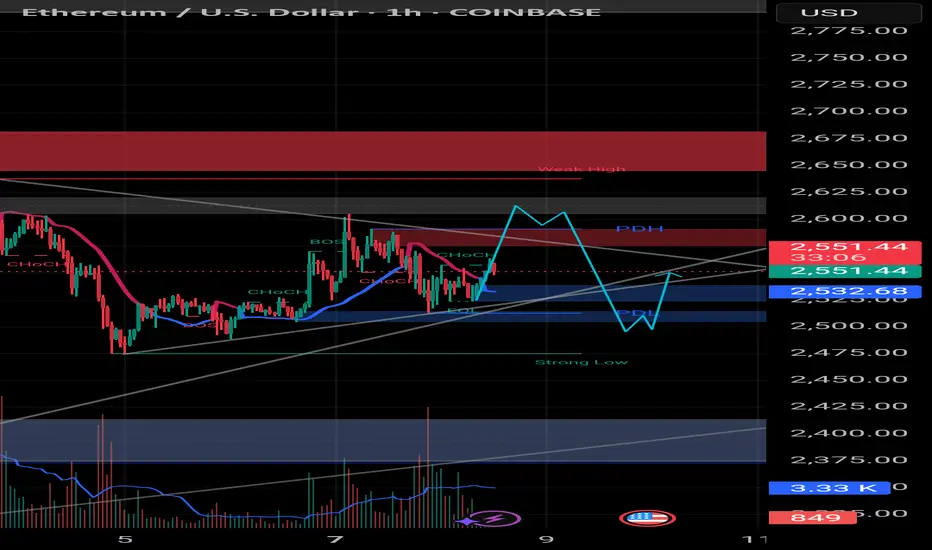
Update on postAs expected chart is going for the buying liquidity
Buying can be done at 2480-90 levels with astoploss around 2450
Major direction ethI think eth 2nd wave local bottom is created around 2100.now we r moving in the third wave
Eth liquidity huntingFirst eth to take upside liquidity and then downside after that continuation yo upside