ETHUSD Bearish FVG Play | Premium Rejection Loading?Ethereum (ETHUSD) 1H Smart Money Bearish Setup | FVG + Fib Confluence
Textbook short scenario lining up on ETHUSD as it retraces into a premium zone filled with imbalance. Let’s unpack the key ingredients of this setup for the squad.
🔍 1. Trade Idea Summary
Price dumped sharply, leaving a clean Fair Value Gap
Retracement into premium (Fib 61.8%–79%) zone
Confluence of:
✅ FVG Supply
✅ Fib retracement zone
✅ Internal structure breaker
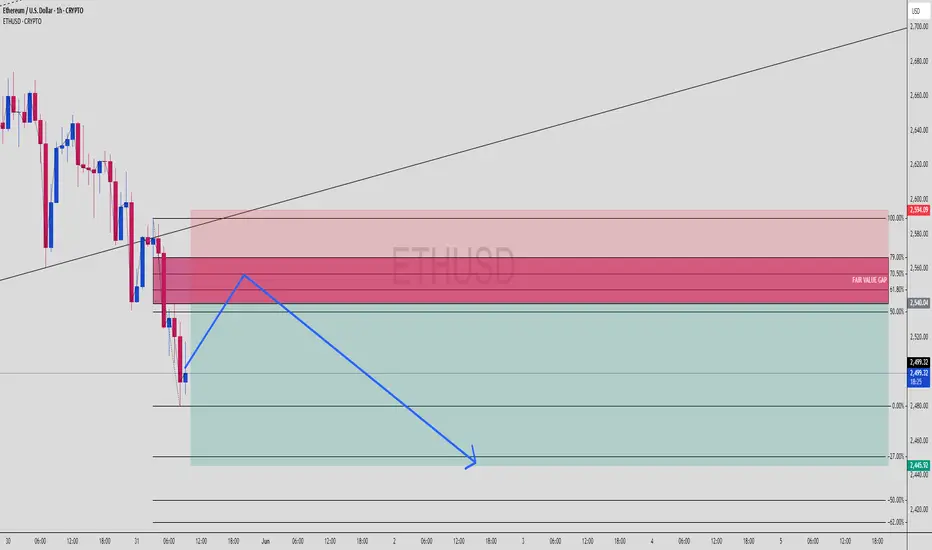
Targeting sell-side liquidity near 2,445 for a smooth RR 1:3+ setup.
📊 2. Key Zones on Chart
Entry Zone: 2,540 – 2,590 (FVG + 61.8%–79% Fib)
Strong High for Sweep (if needed): 2,594
TP Zone (Sell Side Liquidity): 2,445
SL: Above 2,600
🧩 3. Smart Money Concept Breakdown
Market made a lower low ➝ bias shifts bearish
Now retracing into the last up candle before the dump (FVG zone)
Expecting:
Premium rejection
Lower time frame CHoCH
Push to sell-side liquidity
⚙️ 4. Execution Plan
Let price enter FVG zone
Wait for M5 or M15 bearish break of structure
Confirm with:
OB rejection
Entry confirmation candle
Ride it down to TP or trail SL at midpoint
💡 5. Trader Tips:
Watch volume drop as price enters FVG — sign of weak buyers
Don’t force entry — let structure confirm
⚔️ Comment "ETH Breakdown 🔪" if you're eyeing this short
📈 Save this setup & follow @ChartNinjas88 for real-time sniper breakdowns
🎯 DM “TRADE” for access to my sniper SMC playbook
ETHUSD.PI trade ideas
ETH BuyETH Buy Stop
ETh Forming a double Bottom and Falling Wedge and RSI Divergence on 1H Time frame.
Either Instant Buy Or buy Stop at break out confirmation

ETH (Daily) Holding up significantly wellETH is holding up its motif wave 1 rally significantly appearing to have completed an ending diagonal for wave 5 after finding a bottom at the major support high volume node (HVN).
Wave 2 is expected to retrace to the S1 pivot, 61.8 Fibonacci retracement and HVN at $1930 but may be front run at the daily pivot and wave 4 bottom $2300.
Safe trading

Ethereum (ETH/USD) Price Action Analysis (1-Hour Timeframe) 📊 Ethereum (ETH/USD) Price Action Analysis (1-Hour Timeframe) 📈
🔍 Chart Context:
Timeframe: 1-hour (intraday outlook)
Asset: ETH/USD (Binance)
🟠 Key Levels & Observations:
✅ Support Zone:
Around $2,470 - $2,500 (highlighted with orange boxes).
Price consistently tests and respects this area multiple times, indicating strong demand.
✅ Resistance Levels:
First significant resistance: $2,710 - $2,720 (highlighted with blue lines).
Extended target: around $2,760.
✅ Recent Price Action:
Clear higher low formation at the support zone, suggesting potential reversal.
Previous swing highs are well marked (orange circles), hinting at potential resistance retests.
✅ Chart Patterns:
Double bottom / accumulation pattern forming at the highlighted support zone.
Strong bullish reaction expected on successful retest.
🎯 Trade Setup Idea:
Entry: Near $2,500 support zone.
Target: Initial take-profit zone around $2,720.
Extended Target: If momentum continues, $2,760 level.
Stop-Loss: Below $2,470, ideally near $2,450 for risk management.
📈 Technical Bias:
Bullish bias in the short term, driven by repeated support tests and signs of reversal.
Chart hints at breakout potential if price overcomes $2,720.
⚠️ Risk Management & Cautions:
Key risk: False breakouts below $2,470 could trigger bearish continuation.
Maintain a favorable risk-reward ratio (e.g., 1:2 or better).
Market volatility can increase rapidly; keep trade sizes appropriate.
🚀 Summary & Conclusion:
🔵 Bias: Bullish
🔵 Entry Zone: $2,470 - $2,500
🔵 Target Zones:
TP1: $2,720
TP2: $2,760
🔵 Stop-Loss: Below $2,450
🔵 Key Indicators: Structure break, price respecting support, bullish engulfing candle potential.

ETHUSD Bullish Pennant on Daily Chart – Breakout Setup Forming📊 ETHUSD Bullish Pennant – Technical Setup in Focus
Ethereum is currently consolidating within a bullish pennant pattern on the daily timeframe. This structure often appears after a strong price rally and may indicate continuation — if confirmed by a breakout above the resistance zone.
Technical Summary:
📌 Structure: Bullish Pennant
📈 Resistance: $2,550
🔍 Watching for breakout confirmation with volume
🧠 No confirmation = no trade
As always, this is not financial advice. Just sharing a potential setup based on price action and structure.
💬 What are your thoughts on ETH here? Do you see a breakout coming

ETH/USD Technical Outlook – Key Patterns in PlayEthereum is showing key technical formations on the daily chart:
🔸 A Rectangle Range that held for months
🔸 A confirmed Falling Wedge breakout, signaling possible reversal
🚀 Immediate target is above the $3,000 level if momentum sustains.
📊 Watch for volume confirmation before entries.
This is not financial advice. DYOR ✅
#ETH #Ethereum #CryptoAnalysis #ChartPatterns #TechnicalAnalysis #TradingView #ETHUSD #Altcoins #CryptoTraders #BullishSetup

ETH on high time frame
"Hello traders, focusing on ETH, the price is currently at a critical level around $2,800, where it has made multiple unsuccessful attempts to break through. On the high time frames, the price has swept liquidity without showing any signs of reversal. This leads me to anticipate a higher price movement, with the next potential level being around $3,400."
If you need further assistance or have any specific questions, feel free to let me know!

ETHUSDWait for a strong candle close above $2,596
This chart represents a bullish trading setup for Ethereum (ETH/USD) on the 1-hour timeframe, combining price action with RSI confirmation. Let me break it down step by step:
Take Entry after Breakout of LH
LH stands for Lower High.

$ETHUSD LongBITSTAMP:ETHUSD has been consolidating within a daily inside bar for the past few sessions, signaling a potential move.
📈If bullish momentum resumes, we could see a strong breakout to the upside, with initial resistance expected around the $3,300 level. Currently, price is hovering near $2,500.
📉On the downside, if ETH fails to hold $2,400 and we see a weekly candle close below that level, it opens the door for a deeper retracement toward $2,000, and possibly as low as $1,800.
My current targets to the upside are:
🎯 Upside Profit Targets:
✅ ~$2,850
✅ ~$3,200
✅ ~$3,600 - $4,000

ETHEREUM Bearish Signal | Technical + Custom AlgoSmart Trend Signal | Technical Analysis + Custom Algorithm
This signal is the result of a combination of classic technical trend analysis and a proprietary software I personally developed.

ETHEREUM Bounce Zone Activated – Bulls Waking Up?Ethereum just tapped into a high-probability demand zone (highlighted in brown) and is now consolidating around $2,514.96, teasing a potential bullish reversal.
🔎 Technical Overview – ETHUSD (15m Timeframe):
✅ Demand Zone: $2,510 – $2,521 (high interest zone with historical reaction)
⚠️ Support Holding at: $2,521.24
📉 Previous sell-off stalled after testing this strong area of interest
🧠 Using LuxAlgo Supply & Demand Range, price is reacting to major volume clusters
📈 Key Resistance Levels:
Minor: $2,635.00
Major: $2,765.45 (heavy supply area, caution here)
💡 Potential Setup:
> 🟢 Long above $2,520 with confirmation
❌ SL: Below $2,500 (tight risk control)
🎯 TP1: $2,635
🎯 TP2: $2,765
🔥 Scenario to Watch: If buyers gain momentum, ETH could run into the $2,635 area quickly. Break above that, and $2,765 becomes the next magnet.
🧠 Smart traders are watching for:
Bullish engulfing candle 🕯️
RSI divergence 📉
Volume spike 🚀
📌 Are you buying this dip or waiting for confirmation? Let’s discuss in the comments! 👇
#ETHUSD #Ethereum #CryptoAnalysis #SupplyDemand #LuxAlgo #CryptoTraders #ETH #PriceAction #ScalpingSetup #IntradayCrypto #BuyTheDip
---

Ethereum Technical Breakdown – Support Zone in FocusETHUSD – Channel Breakdown and Support Retest in Play (4H Chart)
Ethereum has recently broken below a rising channel structure on the 4H timeframe, indicating a possible shift in short-term momentum.
🔹 Channel Structure: Price maintained higher highs and higher lows within a well-defined ascending channel.
🔹 Breakdown: A clean break below the lower trendline suggests weakening bullish momentum.
🔹 Support Zone: ETH is approaching a previously tested support area, which may act as a reaction zone.
🔹 Retest Potential: If price moves back upward, watch for a retest of the broken channel as resistance.
🔹 Risk Area Highlighted: If support fails, further downside may be possible.
This chart is shared for educational and technical analysis purposes only. No financial advice is being offered.

June Will Be Good ETHUSD ETH has reclaimed the 50MA this month and with a day until June i suspect the bull action will continue
Monthly chart with the 50MA in yellow
Keen to see where this goes

$ETH Ethereum Breakdown Threatens Channel:
ETH is testing the lower boundary of the ascending channel. Repeated rejections from the midline and strong sell volume suggest weakness.
🔸 Key Support Zone at $2,450 – $2,420:
This zone is under pressure. A clean break below this area will confirm a breakdown from the channel structure, shifting bias bearish.
🔸 Downside Target: $2,300 – $2,250
If ETH fails to hold above the support zone, the next demand level lies around $2,300, with further potential downside toward $2,250.
🔸 Upside Target:
If Ethereum fails to break down and instead bounces from the current support zone ($2,450–$2,420), the upside target remains at $2,700 – $2,800, which is the upper boundary of the ascending channel shown in the chart.

SELL ETH TO 1450*I am in no way a financial advisor and you should always do your own due diligence before placing any trade. Do not trade what you are not comfortable with losing. No trade is guaranteed.
Sell ETH
Stop loss : 2812
Take profit: 1450
1-2% risk on funded accounts
3-5% on live accounts

MTF outlook: local wave X/A finished, looking for retracementThe local wave X (or A) from April 8 low seems to have finished at $2790 on May 28th.
Now looking for a retracement (wave Y or B).
Locally, 0.382 Fib level at $2250 provide an interesting level for counter-trading, and I'd be looking for sign of local strength for a short-term long position.
I'll start looking for sign of strength at 0.5 level ($2087), but in reality, I'd really like to see the POC tapped at $1875 for the best risk-to-reward ratio, and to finish the wave X (or B) move. The POC is derived from the larger wave Y since Dec. 2024 to April 2025.
Timing is a guess but based on time-fib projection and understanding of the traditional market summer lull days, I'm expecting wave Y (or B) to finish late June to mid-July. June, July, August are dubbed the 'dog days of summer' because not a lot of price action happens, so trend usually stalls or corrects (this is statistical average). Just an intuitive guess.


ETHEREUM can reach $10000 if 2017 is repeated.Ethereum / ETHUSD is consolidating under the 1day MA200 (resistance) and over the 1day MA50 (support).
The 2025 correction has been quite similar so far to 2016, both bearish Channels bottoming on a Triangle pattern and then rebounding.
In 2017 that rebound resulted in an insane rally above the 3.0 Fibonacci extension.
Even if the market doesn't rise this time this aggressively and that quickly, it can still approach the 3.0 Fib at 10000 and form the top for this Cycle.
Follow us, like the idea and leave a comment below!!

ETHEREUM Wedge Breakout! Sell!
Hello,Traders!
ETHEREUM was trading in an
Uptrend but then the coin
Formed a bearish wedge pattern
And we are now seeing a bearish
Breakout so we are locally
Bearish biased and we will be
Expecting a long awaited
Bearish correction
Sell!
Comment and subscribe to help us grow!
Check out other forecasts below too!
Disclosure: I am part of Trade Nation's Influencer program and receive a monthly fee for using their TradingView charts in my analysis.

ETH Investors Are Confused, But the Algorithm Says $40K's Coming🚨 Ethereum: Confusion or Opportunity?
Many investors are currently confused — wondering whether Ethereum (ETH) is due for a deeper retracement… or if it’s about to skyrocket. So, what’s really going on?
According to our algorithmic model, ETH confirmed a long-term price target of $40,000 the moment it broke above $3,594 on March 11, 2024.
The pullback that followed?
It’s not a sign of weakness — it’s a golden entry opportunity for the next leg up with a garenteed x15 ROI from actual prices.
📉 The $883 low is considered a protected low, and according to our structure, it will likely remain untouched until ETH reaches $40,000.
💰 Why We’re Heavily Exposed to ETH
Given the current market conditions, we’ve allocated the majority of our capital to Ethereum, as it currently represents one of the most secure and promising assets in the crypto space for mid- to long-term positioning.
This isn’t just a trade — it’s a strategic investment.
🚀 Happy Trading,

ETHUSD INTRADAY coiling consolidation pattern resistance at 2,75Trend Overview:
Ethereum (ETH/USD) remains in a bullish trend, underpinned by a sequence of higher lows and a well-defined rising structure. Recent intraday price action reflects a consolidation phase, likely forming a bullish continuation pattern within the prevailing uptrend.
Key Technical Levels:
Support: 2,360 (primary), followed by 2,160 and 2,090
Resistance: 2,750 (initial), then 2,930 and 3,130
Technical Outlook:
A corrective pullback toward 2,360, which aligns with a prior consolidation zone, may offer a buy-the-dip opportunity. A successful retest of this level could set the stage for a continuation toward 2,750, 2,930, and 3,130 over the medium to long term.
However, a confirmed break and daily close below 2,360 would invalidate the near-term bullish outlook, increasing the risk of a deeper correction toward 2,160 and 2,090.
Conclusion:
ETH/USD continues to show bullish momentum as long as it holds above the 2,360 support level. A rebound from this zone would likely confirm the ongoing consolidation as a base for further upside. A breakdown below 2,360, however, would shift the short-term bias bearish, exposing Ethereum to deeper downside risk.
This communication is for informational purposes only and should not be viewed as any form of recommendation as to a particular course of action or as investment advice. It is not intended as an offer or solicitation for the purchase or sale of any financial instrument or as an official confirmation of any transaction. Opinions, estimates and assumptions expressed herein are made as of the date of this communication and are subject to change without notice. This communication has been prepared based upon information, including market prices, data and other information, believed to be reliable; however, Trade Nation does not warrant its completeness or accuracy. All market prices and market data contained in or attached to this communication are indicative and subject to change without notice.

Ascending TriangleETH tightening up above the 20 EMA, wearing off overbought conditions. Looks ready to go in coming days.

ETH is moving within the 2550.00 - 2.765.00 range👀Possible scenario:
Ethereum (ETH) reclaimed $2,600 support and is pushing toward key resistance at $2,850 after breaking out of a bullish pattern. Analysts see upside potential toward $3,800 if the rally holds. ETH is now testing the upper zone of its $2,220–$3,900 macro range, after bouncing from below $2,000 earlier this month. However, the May 30 expiration of $11.4B in BTC and ETH options could add short-term volatility.
While the Pectra upgrade boosted institutional appeal, JPMorgan notes Ethereum’s onchain activity remains weak, with flat daily transactions and addresses. Rising ETH supply and lower fees post-Dencun raise inflation concerns.
✅Support and Resistance Levels
Support level is now located at 2,550.00.
Now, the resistance level is located at 2,765.00.
