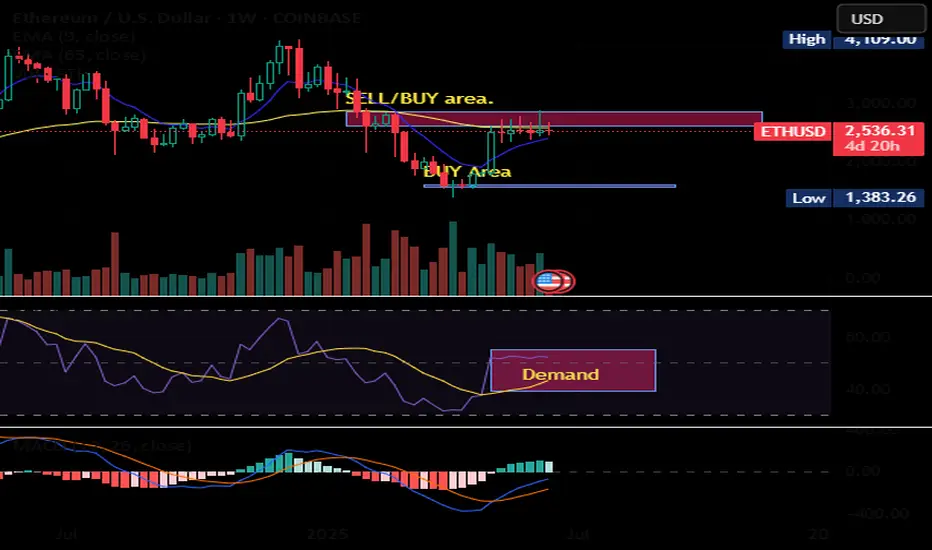
ETH local bottom?ETH has formed a broadening channel pattern and may form a local bottom here, time will tell.
ETHUSD.PI trade ideas

ETH / USDC Pool StakeSharp sell-off following the U.S. strike on Iran—ETH whale has entered. Set your liquidity pool range wide to capture a potential rebound. If the price continues to drop, no problem—full ETH position is anchored at the bottom of the range. Avoid swapping ETH to realize losses. Hold your original ETH and continue adjusting the range downward if needed. Your only real costs are minting and gas fees, so operate on a low-cost network like Arbitrum or Base to keep expenses minimal.

Bearish Wolfewave target madeThe more confluence - the better.
I combine this pattern with the SAR signal.
The odds also seem better when there’s an rsi divergence.
Typical entry is when price goes back down the 1-3 line.
Ideal target is the 1-4 line.
To spot a potential Wolfewave forming, I usually look for a wave 4 that enters wave 1.
Then, I watch if that wave 4 breaches wave 2.
If not, the next move should be a break above the 1-3 line.
Another thing to look at is if the 2-4 line forms a rising wedge with the 1-3 line ( for a bearish Wolfewave).
Earlier entry for a bearish Wolfewave could be when the SAR of the pattern moves above price.
Another earlier entry is looking for signals on a shorter timeframe.
Patterns can fail.
Do your own due diligence.

ETHUSD-SELL strategy 3D chart - GANN Etherium is under pressure, and the many stories predicting crypto becoming very high value, even more we already have observed, makes one wonder. From a technical perspective, it is on the way towards $ 1,750 and I feel we may see lower than that. we are negative medium-term and considering the LONG position and large unloading in BTC last few days, I feel this may be a valid expectation.
Strategy SELL $ 2,250-2,290 and take profit (at first) near $ 1,790.

ETH 4H – Testing Support, Rejected by Weekly 200MAOn the 4H, ETH is closing below the weekly 200MA but is trying to hold the last daily close as support—similar to what it did on June 5 at 20:00.
The difference: back then, the 4H 200MA acted as support; now it’s been clearly rejected and price sits well below it.
With the weekly close approaching, if ETH stays under the weekly 200MA, there's a strong chance it revisits the range low support.
However, if it manages to reclaim the 200MA before the close, a move toward the last two weekly closes may still be on the table.
Always take profits and manage risk.
Interaction is welcome.

ETHUSD Potential long ideaThe market made an all time high at 4095.4 following the November bull run. Street money flooded premium prices trying to buy above all time highs. Once price inevitably dropped from that premium level all of the bulls who bought above premium provided not only exit liquidity for longer term traders, but also "resistance" or "supply" levels that are easily recognizable for anyone who wants to double down on their position once the market forms what appears to be a short term low. Seeing this kind of trading occur in the way that it is occurring and at the prices that it is occurring at gives me insight that the market is now going to enter ranging conditions pairing liquidity from both sides of the range.
the market goes right to 01.23.24 low at 2165 and sweeps that level eventually making its way right back to 4097.4 only $2 higher than the all time high. These 3 levels being used in this way to send the market to both sides of a trapped range is done to allow for time to pass and orders to build up.
Since the overall trend of the crypto markets and ETH in general is upward, I am assigning this behavior to institutional accumulation of discount prices. Under this assumption I will look to see a new short term low set in the market. I will see that signature begin when a short term high leads to taking out a htf discount level with an aggressive displacement lower.
I can expect to see these sweeps just above or just below key lows
Key prices to watch
- Sunday 05.18.25 low; 2325
- Friday 05.09.25 H4 +ob; 2350.9
- Daily dealing range C.E; 2271.5
- Daily + Breaker open 2081.5
- M0A_. 1732.5

Ethereum’s Wild Ride: From Glory to Grit!🚨 Ethereum’s Wild Ride: From Glory to Grit! 🚨
📉 High: $4108 (Dec 16, 2024)
📉 Low: $1386 (Apr 9, 2025)
📈 Retracement: 50% from the fall
📍 Currently at key Oct ’24 support zone
🧠 Market teaches humility!
Ethereum touched euphoric highs in Dec ’24 at $4108, only to plunge a dramatic 66% to $1386 by April ’25. Since then, we saw a healthy 50% retracement — a classic technical response. Now, ETH has silently tiptoed back to its October 2024 support level. All eyes on whether this zone will hold… or fold. 👀
📊 Price is memory in motion — support tested, will it turn resistance or rally?
⏳ Stay patient. Stay technical.
#Ethereum #ETHUSD #CryptoAnalysis #SupportAndResistance #CryptoTrader #TechnicalAnalysis #MarketUpdate #PriceAction #ChartTalk #CryptoJourney #Blockchain #DigitalAssets #HODLOrFold #SaptharishiAlgo

Market next move 🔄 Disrupted Analysis: Bullish Counter-Scenario
🧠 Original Bias:
The chart predicts a strong bearish move, with a target around 88,000 USD.
The label "Bullish" seems misleading as it’s placed in a steep downward move.
---
📉 Issues With the Original Analysis:
1. Volume Misinterpretation:
Increasing red volume could indicate capitulation or a temporary panic sell-off, not necessarily the start of a new trend.
A bounce could follow if buyers step in.
2. Support Zone Ignored:
The analysis overlooks any previous support levels in the 100k–98k range, where buyers may be waiting.
3. No Confirmation for Breakdown:
The chart does not show a completed breakdown of a key structure or trendline.
The blue squiggle assumes a breakdown will happen, but no technical confirmation is visible.
---
📈 Disruption Scenario: Bullish Reversal Possible
Rejection from 102k zone could be a liquidity grab, not the start of a downtrend.
Hidden bullish divergence on RSI or MACD (not shown here) could support a bounce.

ETH shortTrading involves substantial risk and is not suitable for all investors. Past performance is not indicative of future results. Always conduct your own analysis and consider your risk tolerance before entering any trade.😉😉

ETH/USDT Key Levels Reclaimed on 4HOn the 4H, price has closed above the 5D + 3D, and W resistance levels.
Will these levels hold and become a launchpad for new higher highs—and possibly counter the 200MA?
We can’t know for sure, but we can make educated guesses.
Always take profits and manage risk.
Interaction is welcome.

ETH Gears Up for 8% Rally After Holding Key Support at $2,484Ethereum (ETH) is currently positioning itself for a potential bullish breakout on the 4-hour chart. After facing a period of mid-June consolidation and volatility, ETH has stabilized above the key support zone at $2,484–$2,551, which previously served as a strong reaction level. This range has now been retested successfully, and price action suggests growing bullish pressure.
At present, ETH is trading around $2,552, holding just above the defined support, which has acted as both a psychological and technical base. The past few candles show reduced selling momentum and a pattern of accumulation that often precedes a breakout. Buyers are stepping in at higher lows, and this shift in structure could signal the beginning of a new leg upward.
The overall setup suggests that Ethereum is now in a classic breakout-retest formation. Volume, while still moderate, has started to pick up slightly, which strengthens the case for a continuation toward the upper resistance zones. The resistance lines at $2,666 and $2,761 represent short- and mid-term upside targets, both previously tested levels where price struggled to close above. If ETH manages to break past $2,666 cleanly, a move to $2,761 becomes increasingly likely.
🔹 Trade Idea (Buy Setup)
• Entry Point: Around $2,552
• Stop Loss: $2,484 (placed just below the major support zone and recent reaction low)
• Target 1 (TP1): $2,666
• Target 2 (TP2): $2,761
• Risk-to-Reward Ratio: ~1:3.16
• Upside Potential: 8.26%
• Downside Risk: 2.62%
This trade setup provides a high-probability long opportunity, with a clearly defined support zone backing the entry. The stop loss at $2,484 gives the trade sufficient breathing room while minimizing downside risk in case of short-term volatility.
There is also a second entry opportunity defined at $2,416, should the market dip unexpectedly before continuing upward. However, this entry is more aggressive and should be approached with flexible risk management — the stop loss for this reentry point is not fixed and should be adjusted as per the trader’s individual risk appetite.
What further strengthens the bullish case is that this reentry zone aligns closely with a historical swing low that previously triggered a strong bullish reversal. If price tests this level again, it may offer a last-chance opportunity for buyers before a larger move unfolds.
The double target strategy — TP1 at $2,666 and TP2 at $2,761 — reflects realistic profit zones based on past price structure and market behavior. Both targets lie within resistance levels that saw significant reaction in recent trading sessions, making them ideal zones for partial or full profit-taking depending on price momentum.
In the broader context, despite ETH’s recent 10% drop, the asset’s ability to hold above the $2,480–$2,500 region demonstrates resilience. This range now acts as a solid foundation from which bulls could initiate a breakout, especially if macro conditions (like BTC strength or positive ETH-related news) align in coming days.
In summary, Ethereum presents a clean long setup from $2,552 with targets up to $2,761, backed by technical support, improving volume, and a bullish price structure. A secondary entry is available at $2,416 for those with higher risk tolerance. If momentum builds above $2,600, ETH could rapidly revisit prior swing highs — and this chart structure makes a compelling case for being prepared ahead of that move.

ETH SMC perspectiveDaily SMC is Sell (IDM Taken) , but there is fresh supply above( You are a buyer or seller ? ) hehe

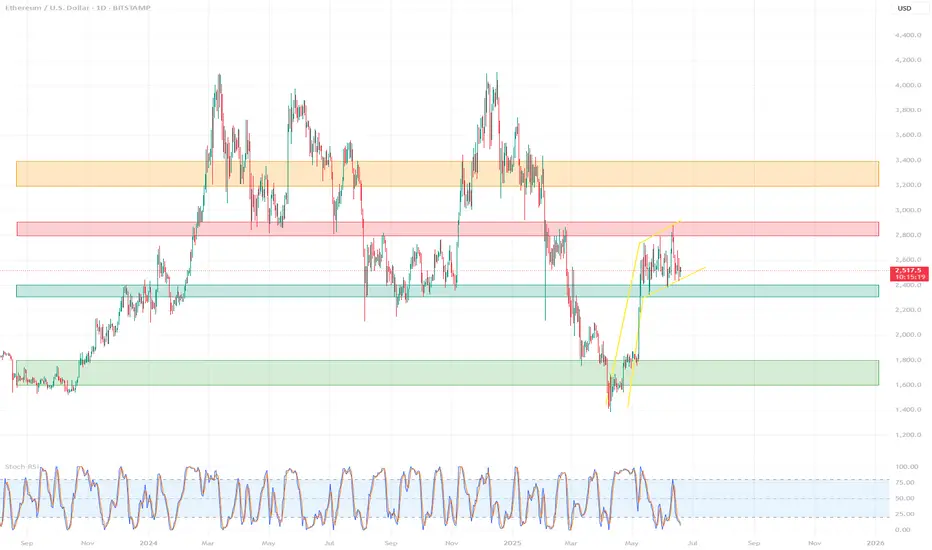
Detailed technical analysis of the ETH/USD chart🧭 General Context (1D, Long-Term):
The chart covers the period from approximately September 2023 to June 2025.
ETH/USD has gone through a complete cycle: growth → decline → correction → potential consolidation/accumulation.
🔹 Market Structure (Price Action)
🔸 Trends:
November 2023 – March 2024: strong uptrend, ETH reaches highs around $4,000+
March 2024 – February 2025: clear downtrend ending with a local low around $1,600
February 2025 – May 2025: dynamic rebound – probable trend change (new higher low + higher high)
May – June 2025: currently consolidating between ~$2,400–2,800
📉 Key Support and Resistance Levels
Type Level Notes
🔴 Resistance ~2,800 – 2,900 Local high, many candles with shadows rejected from above
🟡 Resistance ~3,200 – 3,400 Beginning of strong declines from 2024
🟢 Support ~2,300 – 2,400 Local lows in June 2025
🟢 Strong support ~1,600 – 1,800 Final market low of March 2025 (possible accumulation phase)
📊 Technical indicators
✅ Stochastic RSI (at the bottom of the chart):
Currently in the oversold zone (~0–20) → may signal a potential bottom / buying opportunity
Red-blue lines are starting to wrap upwards → possible rebound
Recent crossovers of the indicator corresponded to local price movements
🔍 Technical formations
⚠️ Possible formations:
Double Bottom: February–March 2025 → classic trend reversal formation
Rising Channel: from March 2025 to present – prices are moving in a slightly rising channel
Current consolidation may be a bull flag (continuation after the increase)
📌 Summary – scenarios
🟢 Bullish scenario:
Breakout of resistance ~2,800 → possible test of levels 3,200 – 3,400 USD
Confirmation of a higher low → continuation of the uptrend
Stochastic RSI in the oversold zone → potential for an uptrend
🔴 Bearish scenario:
Drop below 2,300 USD → possible return to the area of 1,800–1,600 USD
Breakout of the structure of higher lows
Confirmation that the increase was only a correction
🧠 Final conclusions
Currently, ETH/USD is in a key decision zone: after a strong rebound, the market is resting.
Stochastic RSI suggests a potential upside impulse, but requires confirmation by a breakout of resistance.
For traders: 2,800 (resistance) and 2,300 (support) are worth watching.
For investors: 1,600–1,800 could be considered a long-term accumulation zone.
ETHUSD is moving within the 2390.00 - 2880.00 range 👀 Possible scenario:
Ethereum dropped to $2,530, down 9.4% on the week, as market uncertainty weighs on momentum. Despite the pullback, over 35 million ETH (worth $89B) is now staked—an all-time high. While accumulation is surging too, with large wallets scooping up 800K+ ETH daily. On June 12 alone, whales bought 871K ETH—the biggest single-day haul this year. Ethereum’s liquid supply is shrinking as staking grows, aided by SEC guidance easing regulatory concerns. Lido, Coinbase, and Binance remain top staking providers.
The Pectra upgrade and Arbitrum’s ArbOS 40 rollout bring key enhancements like account abstraction and better L2 scaling. A golden cross is forming on ETH’s chart, but price remains under pressure amid geopolitical tensions.
✅Support and Resistance Levels
Support level is now located at 2,390.00.
Now, the resistance level is located at 2880.00.

ETHUSD Sell off is possible.Price tested valid resistance multiple times and formed an ascending channel.
Daily brake and close below this channel, consider its still under construction. Buy the dip!

$ETHAs stablecoins gain real-world adoption, CRYPTOCAP:ETH demand might explode.
Why? Most stablecoins are backed or run on Ethereum.
People can spend stablecoins while keeping ETH locked not sold.
This creates real utility for ETH… and tightens its supply.
#Ethereum #ETH #Stablecoins #DeFi #Crypto
Ethereum H1 | Potential bearish reversalEthereum (ETH/USD) is rising towards a pullback resistance and could potentially reverse off this level to drop lower.
Sell entry is at 2,543.15 which is a pullback resistance that aligns with the 38.2% Fibonacci retracement.
Stop loss is at 2,625.00 which is a level that sits above the 61.8% Fibonacci retracement and a swing-high resistance.
Take profit is at 2,451.35 which is a multi-swing-low support.
High Risk Investment Warning
Trading Forex/CFDs on margin carries a high level of risk and may not be suitable for all investors. Leverage can work against you.
Stratos Markets Limited (tradu.com ):
CFDs are complex instruments and come with a high risk of losing money rapidly due to leverage. 63% of retail investor accounts lose money when trading CFDs with this provider. You should consider whether you understand how CFDs work and whether you can afford to take the high risk of losing your money.
Stratos Europe Ltd (tradu.com ):
CFDs are complex instruments and come with a high risk of losing money rapidly due to leverage. 63% of retail investor accounts lose money when trading CFDs with this provider. You should consider whether you understand how CFDs work and whether you can afford to take the high risk of losing your money.
Stratos Global LLC (tradu.com ):
Losses can exceed deposits.
Please be advised that the information presented on TradingView is provided to Tradu (‘Company’, ‘we’) by a third-party provider (‘TFA Global Pte Ltd’). Please be reminded that you are solely responsible for the trading decisions on your account. There is a very high degree of risk involved in trading. Any information and/or content is intended entirely for research, educational and informational purposes only and does not constitute investment or consultation advice or investment strategy. The information is not tailored to the investment needs of any specific person and therefore does not involve a consideration of any of the investment objectives, financial situation or needs of any viewer that may receive it. Kindly also note that past performance is not a reliable indicator of future results. Actual results may differ materially from those anticipated in forward-looking or past performance statements. We assume no liability as to the accuracy or completeness of any of the information and/or content provided herein and the Company cannot be held responsible for any omission, mistake nor for any loss or damage including without limitation to any loss of profit which may arise from reliance on any information supplied by TFA Global Pte Ltd.
The speaker(s) is neither an employee, agent nor representative of Tradu and is therefore acting independently. The opinions given are their own, constitute general market commentary, and do not constitute the opinion or advice of Tradu or any form of personal or investment advice. Tradu neither endorses nor guarantees offerings of third-party speakers, nor is Tradu responsible for the content, veracity or opinions of third-party speakers, presenters or participants.

ETHUSD is moving within the 2390.00 - 2880.00 range 👀 Possible scenario:
The crypto market fell on June 17, with only 10 of the top 100 coins in the green. Total market cap dropped 2.1% to $3.45T, while trading volume surged to $118B. Ethereum (ETH) slipped 1.7% to around $2,550, retreating from an intraday high of $2,672. ETH is now attempting to reclaim the $2,610 level.
Fundamentals remain strong: U.S. spot Ether ETFs continue to accumulate ETH, with BlackRock’s ETHA holding nearly $650M. Staking yields, tokenized real-world assets, and DeFi infrastructure are also driving momentum.
However, June has historically been bearish for ETH. Data from CryptoRank shows it’s Ethereum’s second-worst month on average, with only three green Junes in 10 years. Analysts warn a drop below $2,500 could send ETH to $2,000 — but many still expect a rally to $3,500–$6,000 in the long term.
✅Support and Resistance Levels
Support level is now located at 2,390.00.
Now, the resistance level is located at 2880.00.

can eth touch previous high made? or will this coin crash?can eth touch previous high made?
or will this coin crash to oblivion?
let us know!
free transparent no edit no delete
🐉We value full transparency. All wins and fails fully publicized, zero edit, zero delete, zero fakes.🐉
🐉Check out our socials for some nice insights.🐉
information created and published doesn't constitute investment advice!
NOT financial advice

ETH SHORT TERM/MID TERM BEARISH PRICE MOVEMENTHello everyone,
i would like to share my view of ETH, in the future it will hit between 6500/7000 no doubt but short to mid term i believe we will see the lower price levels once again before it takes off to new highs!
targets: 1545 , 1288
Greetings,
The Short Master

ETH/USD Rejection at Supply Zone – Bearish Move LoadingETH/USD is currently showing a potential short opportunity after rejecting the key supply zone around $2,640 – $2,645, a level that previously acted as strong resistance.
🔍 Key Observations:
Price tapped into a visible Supply Zone (highlighted in blue) and is now consolidating below it.
Strong resistance is confirmed by repeated rejections at $2,640.
A clean support level lies at $2,576, which could act as the first target if sellers take control.
Below $2,576, watch out for a potential drop toward the demand zone around $2,508 – $2,500, a level where bulls previously stepped in aggressively.
📉 Bearish Scenario: If ETH breaks below $2,576 with volume, expect momentum to build toward the $2,508 demand area. A break below $2,500 could open the door for further downside.
📌 Trade Idea:
Entry: Below $2,576 on strong bearish candle
TP1: $2,508
TP2: $2,500
SL: Above $2,645
🚨 Note: Confirmation is key. Watch for bearish candlestick formations or volume spikes before entering short.
🔔 Follow me for more clean setups and live trade ideas.
#ETHUSD #Ethereum #CryptoTrading #SupplyAndDemand #PriceAction #Scalping #DayTrading #ShortSetup


ETHUSD is moving within the 2390.00 - 2880.00 range 👀 Possible scenario:
Ethereum dipped to $2,440 on June 13 but rebounded to trade near $2,640 on June 16. Despite muted price action, institutional and whale interest remains strong. Crypto funds saw $1.9B in net inflows last week, marking the ninth consecutive week of gains, per CoinShares. Ethereum-focused funds brought in $585M, with U.S. spot ETFs accounting for $528.2M, though the 19-day inflow streak ended Friday with minor outflows. Whale wallets (1,000–100,000 ETH) added 1.5M ETH over 30 days, a 3.7% increase, now holding 41M ETH—around 25% of supply. Retail investors, meanwhile, took profits as ETH trades 45% below its all-time high.
Network activity is also up: Ethereum Name Service usage surged 300%, lending protocols 200%, and USDC transfers on Layer 2s like Base, Arbitrum, and Optimism saw triple-digit growth. With growing institutional flows, active Layer 2 usage, and whale accumulation, Ethereum may be quietly building momentum for its next breakout.
✅Support and Resistance Levels
Support level is now located at 2,390.00.
Now, the resistance level is located at 2880.00.
